Immunohistochemical Analysis of ATRX, IDH1 and p53 in Glioblastoma and Their Correlations with Patient Survival
Glioblastoma (GBM) can be classified into molecular subgroups, on the basis of biomarker expression. Here, we classified our cohort of 163 adult GBMs into molecular subgroups according to the expression of proteins encoded by genes of alpha thalassemia/mental retardation syndrome X-linked (ATRX), isocitrate dehydrogenase (IDH) and TP53. We focused on the survival rate of molecular subgroups, depending on each and various combination of these biomarkers. ATRX, IDH1 and p53 protein expression were evaluated immunohistochemically and Kaplan-Meier analysis were carried out in each group. A total of 15.3% of enrolled GBMs demonstrated loss of ATRX expression (ATRX-), 10.4%
expressed an aberrant IDH1 R132H protein (IDH1+), and 48.4% exhibited p53
overexpression (p53+). Survival differences were statistically significant when single protein expression or different combinations of expression of these proteins were analyzed. In conclusion, in the case of single protein expression, the patients with each IDH1+, or ATRX-, or p53- GBMs showed better survival than patients with counterparts protein expressed GBMs. In the case of double protein pairs, the patients with ATRX-/p53-, ATRX-/
IDH1+, and IDH1+/p53- GBMs revealed better survival than the patients with GBMs with the remained pairs. In the case of triple protein combinations, the patients with ATRX-/
p53-/IDH+ showed statistically significant survival gain than the patients with remained combination of proteins-expression status. Therefore, these three biomarkers, individually and as a combination, can stratify GBMs into prognostically relevant subgroups and have strong prognostic values in adult GBMs.
Keywords: Glioblastoma; ATRX; p53; Isocitrate Dehydrogenase; Mutation; Overall Survival; Progression Free Survival
Ajay Chaurasia,1 Sung-Hye Park,1 Jeong-Wook Seo,1 and Chul-Kee Park2
1Department of Pathology, Seoul National University, College of Medicine, Seoul, Korea; 2Department of Neurosurgery, Seoul National University, College of Medicine, Seoul, Korea
Received: 5 August 2015 Accepted: 12 May 2016 Address for Correspondence:
Sung-Hye Park, MD
Department of Pathology, Seoul National University, College of Medicine, 103 Daehak-ro, Jongno-gu, Seoul 03080, Korea E-mail: [email protected]
Funding: This work was supported by the National Research Foundation of Korea (NRF) grant funded by the Korea government (MSIP) (No. 2010-0028631).
http://dx.doi.org/10.3346/jkms.2016.31.8.1208 • J Korean Med Sci 2016; 31: 1208-1214
INTRODUCTION
Glioblastoma (GBM) is the most aggressive diffuse glioma of the astrocytic lineage and corresponds to grade IV according to the WHO classification (1). It is also the most frequently diag- nosed brain tumor, accounting for 45.2% of primary malignant brain tumors, 54% of all gliomas, and 16% of all primary brain tumors (2). GBM comprises of primary and secondary subtypes, which evolve through different genetic pathways, affect patients at different ages, and have different survival rates (3).
GBMs can have aberrant expression of different growth-con- trol genes and their proteins, including impaired alpha thalas- semia/mental retardation syndrome X-linked (ATRX) expres- sion (ATRX-), p53 overexpression (p53+), and mutant IDH1 (H09) expression (IDH1+). Previous studies have shown that in un- selected GBMs, IDH mutations were found in approximately 8.8% of the patients (4). Selectively, IDH mutations were detect- ed in almost 90% of secondary GBM, whereas these mutations are uncommon in primary GBM (5). Moreover, IDH mutations are established markers of better prognosis in GBM (6-8). Mu-
tations in p53 have been found in approximately 60% patients with secondary and 25% with primary GBMs (6,9,10). Associa- tion of TP53 mutations with survival outcome in GBM patients has not been consistent; some studies reported better survival in patients with TP53 mutations (11,12) while others have failed to find such association (13). ATRX is frequently mutated in sec- ondary (57%) but rarely in primary GBMs (11,14,15). In GBMs, ATRX mutations are usually accompanied by IDH and TP53 mutations (14). ATRX enables the incorporation of the histone variant H3.3 into the heterochromatin, giving rise to changes in telomere length and genomic instability (16,17). Mutations of ATRX are still under study to determine its association with sur- vival outcome in GBM patients and to establish these mutations as prognostic factors.
Therefore, the aims of our study were to determine the pro- tein expression signatures of important growth-control genes, i.e., IDH1, p53, and ATRX, in our cohort of GBMs, and to deter- mine whether in GBM altered protein expression of any of these growth-control genes, or their combined variants, were associ- ated with significant increase in patient survival and, thereby,
to establish prognostically distinct molecular subgroups of GBM irrespective of the histopathological diagnosis.
MATERIALS AND METHODS
Patient population and tissue microarray
A cohort of 163 patients diagnosed with GBM, who underwent surgery and were treated at Seoul National University Hospital (SNUH) in Korea between 1999 and 2011, were enrolled in this study, which had full medical history, survival data, enough for- malin fixed paraffin embedded tissues (FFPE) for tissue micro- array (TMA) and definite diagnosis of grade IV astrocytoma with microvascular proliferation and/or necrosis. Median age of our cohort was 49.4 years old (21-79 years old) and male to female ratio was 1.4:1. Archived slides and paraffin blocks for all the cases were obtained from the Department of Pathology, SNUH.
Immunohistochemistry were carried out on TMA. Archival he- matoxylin and eosin (H & E) stained slides were re-evaluated to determine the diagnostic accuracy and representative tumor regions for inclusion in the TMA. An average of 3-mm cores were cut from FFPE tissue blocks. If the cores of TMA were not repre- sentative or the results were not convincing due to losses of large part of core tissue during processing or squeezing artifact of tu- mor cells or extensive tumor cell necrosis seen in selected areas for TMA blocks, an entire sections from the other blocks were immunostained and re-analyzed. The clinical and survival data of the patients were obtained from the SNUH online portal.
Histological evaluation
Histological evaluation was performed on H & E stained archi- val slides from 163 cases. All cases were reviewed by the neuro- pathologists and confirmed as WHO grade IV astrocytomas ac- cording to the 2007 WHO classification scheme.
Immunohistochemical studies
Immunohistochemical staining was performed according to the manufacturer’s protocols using BenchMark XT (automated immunohistochemical slide staining system, Roche Diagnos- tics, IN, USA). Immunohistochemistry was performed on TMA sections using antibodies against ATRX (rabbit polyclonal, 1:600;
Sigma-Aldrich, St. Louis, MO, USA), p53 (mouse monoclonal, Clone: DO-7, 1:50; Dako, Glostrup, Denmark), and IDH1 R132H mutant protein (mouse monoclonal, clone H09, 1:50; Dianova, Hamburg, Germany). Positive and negative controls were in- cluded in all TMAs. Sections from known mutation-positive and immunoreactive GBM tumors were used as positive controls.
Negative controls consisted of sections incubated with normal rabbit serum instead of the primary antibody. IDH1and ATRX were scored as positive or negative. p53 were scored using a four-tiered scale, namely the percentage of stained nuclei was quantified and grouped into one of the four classes: (-), < 10%
of the nuclei stained indicating the absence of immunoreactivi- ty; (l+), 10-30% of the nuclei stained; (2+), 30.1-50% of the nu- clei stained; (3+), > 50% of the nuclei stained (12,13,18). And 2+ and 3+ were regarded as positive. Immunoreactivity was per- formed using the Aperio ImageScope software with Nuclear v9 algorithm.
Statistical analysis
Survival analysis was performed using the Kaplan-Meier esti- mator and log-rank test to assess the significant association of immunopositive versus immunonegative ATRX, p53, and IDH1 proteins with overall survival (OS) and progression free survival (PFS) times in GBM patients. A P < 0.05 was considered statisti- cally significant. Analyses were carried out using IBM SPSS Sta- tistics software V22.0.
Ethics statement
Clinical data were obtained from Seoul National University Hos- pital (SNUH) online medical records in accordance with insti- tutional review board (IRB)-approved protocols (1307-093-505).
We used anonymized tissue microarray blocks (TMA) made from formalin fixed paraffin embedded tissues made before 2013 February when newly updated life and ethical law is oper- ated and informed consent was waived.
RESULTS Clinical dataset
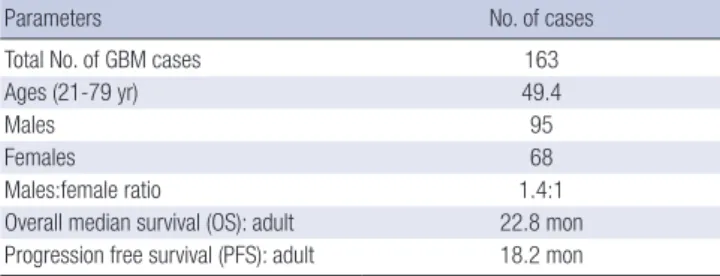
The demographic and survival characteristics of the unselected GBM population are summarized in Table 1. The study popula- tion consisted of 163 adult patients with a median age at diag- nosis of 49.4 years (Age range: adults 21-79 years). The cohort consisted of 95 males and 68 females (1.4:1). The results of me- dian OS and PFS were analyzed according to aberrant protein expression status, as each or combinations of three proteins, in our cohort of GBM patients (Tables 2-4).
Immunohistochemical and survival analysis of GBMs with individual IDH1, ATRX and p53 protein expression, and patients’ age
Immunohistochemical characteristics of the enrolled GBM pop- ulation are summarized in Table 2. From the overall study pop-
Table 1. Demographic summary of patient cohort with glioblastoma (GBM) in this study
Parameters No. of cases
Total No. of GBM cases 163
Ages (21-79 yr) 49.4
Males 95
Females 68
Males:female ratio 1.4:1
Overall median survival (OS): adult 22.8 mon Progression free survival (PFS): adult 18.2 mon
Table 2. The result of ATRX, IDH, and p53 immunoexpression in enrolled GBMs and median overall and progression free survivals in each subgroup
Mutant protein
Result of immunohis- tochemistry:
No. (%)
Median OS, mon (n = 163)
Median PFS, mon (n = 163) Mutant
protein
Wildtype protein
Mutant protein
Wildtype protein
ATRX- 25 (15.3) 32.9 21.0 25.9 16.9
IDH1+ 17 (10.4) 31.9 21.8 28.1 17.2
p53+ 80 (48.4) 19.3 26.2 15.8 20.6
OS, overall survival; PFS, progression free survival; ATRX-, loss of ATRX expression;
H09, mutant IDH1; IDH1+, positive expression; p53+, p53 overexpression.
Table 3. Analysis of various combination of two proteins-pairs in adult GBMs and survival outcomes
Results of IHC GBM variants No. (%)
n = 163 Median OS,
mon P value Median PFS,
mon P value
ATRX/IDH1 ATRX-/IDH1+
ATRX-/IDH1- ATRX+/IDH1+
ATRX+/IDH1-
7 (4.3%) 18 (11.0%) 10 (6.1%) 128 (78.5%)
42.7 28.9 24.2 20.7
0.003 42.2
19.6 18.3 16.8
0.049
ATRX/p53 ATRX-/P53-
ATRX-/P53+
ATRX+/P53- ATRX+/P53+
14 (8.3%) 11 (6.7%) 70 (42.9%) 68 (41.7%)
39.9 23.9 23.4 18.5
0.028 29.6
21.3 18.9 15.0
0.016
IDH1/p53 IDH1+/P53-
IDH1+/P53+
IDH1-/ P53- IDH1-/ P53+
9 (5.5%) 8 (4.9%) 75 (46.0%) 71 (43.6%)
33.4 30.1 25.3 18.0
0.014 30.3
25.7 19.5 14.7
0.031
P value was obtained by log rank test of Kaplan Meier survival analysis.
IHC, immunohistochemistry; GBM, glioblastoma; OS, overall survival; PFS, progression free survival; ATRX-, loss of ATRX expression; ATRX+, positive ATRX protein expression;
p53+, over-expression of p53; p53-, lack of p53 expression; IDH1+, Positive IDH1 protein; IDH1-, negative for mutated IDH1 (R132H) protein.
Table 4. Combined triple proteins of ATRX, p53, and IDH1 immunohistochemical re- sults and survival outcomes
GBM variants No. (%) n = 193
Median
OS, mon P value Median PFS, mon P value
ATRX-/P53-/IDH1+ 4 (2.5) 47.9 0.010 47.9 0.031
ATRX-/P53-/IDH1- 10 (6.1) 36.7 22.2
ATRX-/P53+/IDH1+ 3 (1.8) 35.9 34.7
ATRX+/P53+/IDH1+ 5 (3.1) 26.7 20.2
ATRX+/ P53-/IDH1- 65 (39.9) 23.5 19.1
ATRX+/P53-/IDH1+ 5 (3.1) 21.8 16.3
ATRX-/P53+/IDH1- 8 (4.9) 19.5 16.3
ATRX+/P53+/IDH1- 63 (38.7) 17.8 14.5
P value was obtained by log rank test of Kaplan Meier Survival analysis.
ATRX-, loss of ATRX expression; ATRX+, positive ATRX protein expression; p53+, over- expression of p53; p53-, lack of p53 expression; IDH1+, positive IDH1 protein ex- pression; IDH1-, negative for mutated IDH1(R132H) protein.
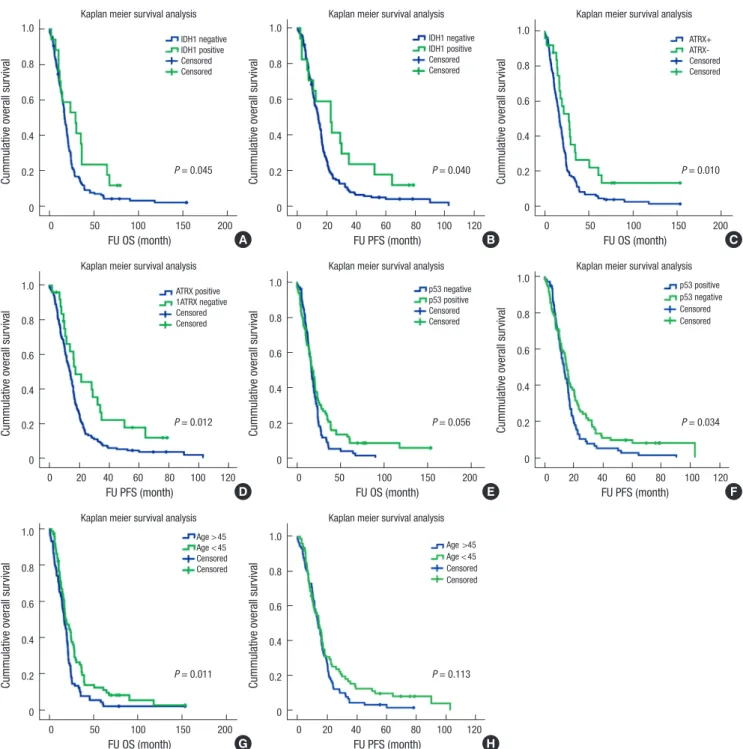
ulation, aberrant expression was observed in 25 GBMs (15.3%) for ATRX, 17 GBMs (10.4%) for IDH1, 80 GBMs (48.4%) for p53 (Fig. 1). The patients’ median OS and PFS in correlation with the aberrant protein expression are summarized in Table 2. In all patients each ATRX- and IDH1+ tumors showed the similar- ly excellent median OS of 32.9 and 31.9 months, and median PFS of 25.9 and 28.1 months, respectively, whereas the patients with p53-overexpressing tumors showed the worst median OS (19.3 months) and PFS (15.8 months). Kaplan Meier survival analysis showed statistically better OS and PFS in patients with GBMs with mutant protein expression of ATRX (ATRX-) and IDH1 (IDH1+) than the patients with GBMs with counterpart status of these two proteins (Fig. 2A-D). However, in case of p53 protein expression status, the better PFS was found in the pa- tients with p53 negative GBMs, but OS was not correlated with P53 status (Fig. 2C and D). If the GBM patients stratified as two groups, younger and older age group, the p53 overexpressed tumors were correlated with poor OS (P = 0.014), however, in young age group under 45 years old, p53 overexpression did not affect the patients’ OS. The younger patients under 45 years old had statistically better OS (P = 0.011) than the older patients (≥ 45 years old), however, they had better tendency in PFS than older patients (P = 0.113) (Fig. 2E and F).
Immunohistochemical and survival analysis of GBMs with combinations of two protein expression
Table 3 shows immunohistochemical results of two protein pairs, ATRX/IDH1, ATRX/p53, and IDH1/p53 and their median OS and PFS. In two protein pairs, the three largest combinations were ATRX+/IDH1- (78.5%), IDH1-/p53- (46.0%), and ATRX+/
p53- (42.9%). However, ATRX+/p53+ and IDH1-/p53+ combi- nation was also similarly high (41.7% and 43.6%, respectively).
The three smallest subgroups were ATRX-/DH1+ (4.3%), ATRX-/
p53+ (6.7%), and IDH1+/p53+ (4.9%).
By analyzing the patients’ survival according to the combina- tions of the ATRX/IDH1 pair, the highest median OS (42.71 mon- ths) and PFS (42.2 months) were found in the patients with ATRX- /IDH1+, while the lowest median OS (20.7 months) and PFS (16.8 months) were observed in the patients with ATRX+/IDH1- . The analysis of the ATRX/p53 pair revealed that ATRX-/p53- expression evidenced the highest median OS and PFS (39.9 and 29.6 months, respectively), while the ATRX+/p53+ combination showed the lowest median OS and PFS (18.5 and 15.0 months, respectively). IDH1/p53 pair revealed that IDH1+/p53- group
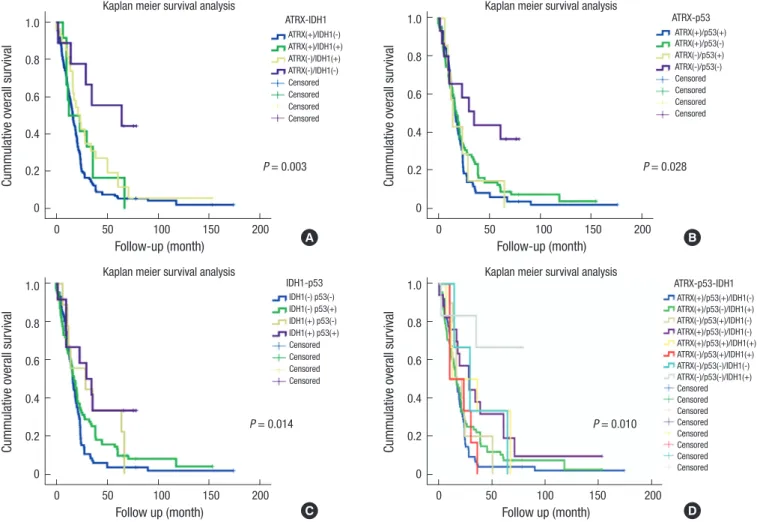
was correlated with the highest median OS and PFS (33.4 and 30.3 months, respectively), while IDH1-/p53+ group have the lowest median OS and PFS (18.0 and 14.7 months, respective- ly). Kaplan Meier survival analysis of two protein expression pairs also revealed the same results. Among them, the best sur- vival combinations group were ATRX-/IDH1+, ATRX-/p53-, and IDH1+/p53- (Fig. 3).
Immunohistochemical and survival analysis of GBMs with combinations of three protein expression
As shown in Table 4, combined three-protein immunohisto- chemical analysis revealed eight different molecular variants.
About 1.8% (3/163) of the samples was consisted of aberrant protein expression of all three proteins, i.e., ATRX-/p53+/IDH1+, while 39.9% (65/163) were wildtype protein expression group, i.e., ATRX+/p53-/IDH1-.
The survival analysis of patients with these three proteins combination revealed the highest median OS and PFS of 47.9 and 47.9 months for ATRX-/P53-/IDH1+ combination and the
lowest OS and PFS group was ATRX+/P53+/IDH1- combina- tion (17.8 and 14.5 months, respectively) (Table 4).
In three biomarker combination group, the best survival was noted in the patients with ATRX-/p53-/IDH1+, which were com- prised only 2.5% of GBMs (Fig. 3D) (P = 0.010).
DISCUSSION
It was previously observed in various studies that some relation- ship exists between aberrant expression of ATRX, p53, and IDH1 proteins in GBM patients and their OS. Though those studies, better OS outcomes in GBM patients with ATRX- and/or IDH1+
than patients with counterpart protein expression status (11,14, 15). The aim of our study was to establish a correlation between survival (OS and PFS) of GBM patients and the immunohisto- chemical expression of ATRX, IDH1, and p53, individually, as well as in different combinations. Immunohistochemically, we found ATRX loss in 15.3%, p53 overexpression in 48.4%, and IDH1 positivity in 10.4% of unselected GBM patients. Survival Fig. 1. The figures show representative pictures of one of GBMs and aberrant protein expression, that is, ATRX-/p53+/IDH1+, which are the least common combination of pro- tein status, comprising 1.8% of our studied cohort. (A) H & E. (B) ATRX. (C) p53. (D) IDH1, (A-D) × 200.
A
C
B
D ATRX
p53 IDH1
Cummulative overall survival
FU OS (month)
0 50 100 150 200
1.0 0.8 0.6 0.4 0.2 0
Kaplan meier survival analysis IDH1 negative IDH1 positive Censored Censored
P = 0.045
Cummulative overall survival
FU PFS (month)
0 20 40 60 80 100 120 1.0
0.8 0.6 0.4 0.2 0
Kaplan meier survival analysis IDH1 negative IDH1 positive Censored Censored
P = 0.040
Cummulative overall survival
FU OS (month)
0 50 100 150 200
1.0 0.8 0.6 0.4 0.2 0
Kaplan meier survival analysis ATRX+
ATRX- Censored Censored
P = 0.010
A B C
Cummulative overall survival
FU PFS (month)
0 20 40 60 80 100 120 1.0
0.8 0.6 0.4 0.2 0
Kaplan meier survival analysis ATRX positive 1ATRX negative Censored Censored
P = 0.012
Cummulative overall survival
FU OS (month)
0 50 100 150 200
1.0 0.8 0.6 0.4 0.2 0
Kaplan meier survival analysis p53 negative p53 positive Censored Censored
P = 0.056 Cummulative overall survival
FU PFS (month)
0 20 40 60 80 100 120 1.0
0.8 0.6 0.4 0.2 0
Kaplan meier survival analysis p53 positive p53 negative Censored Censored
P = 0.034
D E F
Cummulative overall survival
FU OS (month)
0 50 100 150 200
1.0 0.8 0.6 0.4 0.2 0
Kaplan meier survival analysis Age > 45 Age < 45 Censored Censored
P = 0.011
G
Cummulative overall survival
FU PFS (month)
0 20 40 60 80 100 120 1.0
0.8 0.6 0.4 0.2 0
Kaplan meier survival analysis Age >45 Age < 45 Censored Censored
P = 0.113
H
Fig. 2. Kaplan-Meier plots for GBM patient survival by ATRX, IDH, and p53 protein expressions status. (A, B) The better survival (OS and PFS) is found in the patients with GBMs with positive IDH1 than the patients with lack of IDH1. (C, D) The better survival (OS and PFS) is noted in the patient with loss of ATRX expression than the patients with preserv- ed ATRX expression. (E, F) The better survival with GBMs with lack of p53 overexpression has better PFS than the patients with GBMs with p53 overexpression, but OS is not statistically significant difference between the patients with p53 positive and negative GBMs. (G, H) Younger age patients (≤ 45 years old) have statistically significant better sur- vival than the older GBM patients (> 45 years old).
analysis based on immunohistochemical results showed a sta- tistically significant better survival with ATRX- and/or IDH1+
when compared to patients with ATRX+ and/or IDH1- (Fig. 2).
To date, some studies have demonstrated a correlation between TP53 gene mutations and decreased median survival, while others have not found such correlation. In our cohort, the pa- tients with p53 overexpression showed a poorer median overall
survival (19.3 months) when compared to GBM patients with p53- (26.2 months) (P = 0.019). However, the Kaplan Meier sur- vival analysis, the only PFS was statistically better in GBM pa- tients with p53- than patients with p53+ and the OS was ten- dency of better survival in the GBM patients with p53- than the patients with counterpart result (Fig. 2). Our results are in line with those obtained by Newcomb et al. (13); here, p53 muta-
Fig. 3. Kaplan-Meier plots for GBM patient survival by combined two and three gene immunohistochemical status. (A) Among ATRX/IDH1 combination subgroups, the highest median OS of 42.7 months is found in the patients with ATRX-/IDH1+ status. (B) Among ATRX/p53 combination subgroups, the highest median OS of 39.9 months is found in the patients with ATRX-/p53- status. (C) Among IDH1/p53 combination subgroups, the highest median OS of 33.4 months is found in the patients with IDH+/p53- status. (D) The highest median OS of 47.9 months is found in patients with ATRX-/p53-/IDH+ status among three protein combination subgroups.
Cummulative overall survival
Follow-up (month)
0 50 100 150 200
1.0 0.8 0.6 0.4 0.2 0
Kaplan meier survival analysis
ATRX-IDH1 ATRX(+)/IDH1(-) ATRX(+)/IDH1(+) ATRX(-)/IDH1(+) ATRX(-)/IDH1(-) Censored Censored Censored Censored
P = 0.003
Cummulative overall survival
Follow-up (month)
0 50 100 150 200
1.0 0.8 0.6 0.4 0.2 0
Kaplan meier survival analysis
ATRX-p53 ATRX(+)/p53(+) ATRX(+)/p53(-) ATRX(-)/p53(+) ATRX(-)/p53(-) Censored Censored Censored Censored
P = 0.028
Cummulative overall survival
Follow up (month)
0 50 100 150 200
1.0 0.8 0.6 0.4 0.2 0
Kaplan meier survival analysis
IDH1-p53 IDH1(-) p53(-) IDH1(-) p53(+) IDH1(+) p53(-) IDH1(+) p53(+) Censored Censored Censored Censored
P = 0.014
Cummulative overall survival
Follow up (month)
0 50 100 150 200
1.0 0.8 0.6 0.4 0.2 0
Kaplan meier survival analysis
ATRX-p53-IDH1 ATRX(+)/p53(+)/IDH1(-) ATRX(+)/p53(-)/IDH1(+) ATRX(-)/p53(+)/IDH1(-) ATRX(+)/p53(-)/IDH1(-) ATRX(+)/p53(+)/IDH1(+) ATRX(-)/p53(+)/IDH1(+) ATRX(-)/p53(-)/IDH1(-) ATRX(-)/p53(-)/IDH1(+) Censored Censored Censored Censored Censored Censored Censored Censored
P = 0.010
A B
C D
tions were found to be related to survival in an age specific man- ner being favorable if mutations are found in younger popula- tion (22-40 age group), whereas unfavorable after 40 years old (41-60 and 61-80 age groups). Our cases of GBMs with p53 over- expression also showed unfavorable OS in the patients with 45 years old and over that age (P = 0.014).
Immunohistochemically analyzing two and three protein combinations, we hypothesized whether certain molecular al- terations were more likely to be associated with better OS and PFS. We found that the different protein alterations were asso- ciated with distinct survival rates. The survival differences rea- ched statistical significance in all ATRX/p53, ATRX/IDH, and IDH1/p53 combination, and ATRX/IDH1/p53 combinations, with P < 0.05 in all categories (Fig. 3).
In conclusion, we have shown aberrant expression of ATRX, p53, and IDH1 proteins in our cohort of GBMs. Immunohisto- chemical analysis of ATRX, p53, and IDH1 individually, and in different combinations, revealed that aberrant expression of ATRX and IDH1 proteins and lack of p53 expression, together
with combinations of ATRX-/IDH1+, ATRX-/p53-, IDH1+/p53-, and ATRX-/p53-/IDH1+ groups, were associated with a distinct and statistically significant increased survival rates regarding both OS and PFS. Therefore, these protein expression signatures individually, as well as the combined protein expression signa- tures, can stratify GBMs into prognostically relevant subgroups and may be used as prognostic markers in addition to diagnos- tic markers.
DISCLOSURE
The authors have no potential conflicts of interest to disclose.
AUTHOR CONTRIBUTION
Conception and design: Park SH, Seo JW. Acquisition of clinical data: Park CK, Chaurasia A. Analysis and interpretation of data:
Chaurasia A. Writing: Chaurasia A. Review and revision: Park SH, Seo JW, Park CK. Final approval: all authors.
ORCID
Ajay Chaurasia http://orcid.org/0000-0003-0479-3442 Sung-Hye Park http://orcid.org/0000-0002-8681-1597 Jeong-Wook Seo http://orcid.org/0000-0003-0242-1805 Chul-Kee Park http://orcid.org/0000-0002-2350-9876 REFERENCES
1. Louis DN, Ohgaki H, Wiestler OD, Cavenee WK, Burger PC, Jouvet A, Sch
eithauer BW, Kleihues P. The 2007 WHO classification of tumours of the central nervous system. Acta Neuropathol 2007; 114: 97109.
2. Ostrom QT, Gittleman H, Farah P, Ondracek A, Chen Y, Wolinsky Y, Stroup NE, Kruchko C, BarnholtzSloan JS. CBTRUS statistical report: primary brain and central nervous system tumors diagnosed in the United States in 20062010. Neuro-oncol 2013; 15 Suppl 2: ii156.
3. Kleihues P, Ohgaki H. Phenotype vs genotype in the evolution of astrocyt
ic brain tumors. Toxicol Pathol 2000; 28: 16470.
4. Nobusawa S, Watanabe T, Kleihues P, Ohgaki H. IDH1 mutations as mo
lecular signature and predictive factor of secondary glioblastomas. Clin Cancer Res 2009; 15: 60027.
5. Ohgaki H, Burger P, Kleihues P. Definition of primary and secondary glio
blastomaresponse. Clin Cancer Res 2014; 20: 2013.
6. Parsons DW, Jones S, Zhang X, Lin JC, Leary RJ, Angenendt P, Mankoo P, Carter H, Siu IM, Gallia GL, et al. An integrated genomic analysis of hu
man glioblastoma multiforme. Science 2008; 321: 180712.
7. Yan H, Parsons DW, Jin G, McLendon R, Rasheed BA, Yuan W, Kos I, Ba
tinicHaberle I, Jones S, Riggins GJ, et al. IDH1 and IDH2 mutations in gli
omas. N Engl J Med 2009; 360: 76573.
8. Balss J, Meyer J, Mueller W, Korshunov A, Hartmann C, von Deimling A.
Analysis of the IDH1 codon 132 mutation in brain tumors. Acta Neuro- pathol 2008; 116: 597602.
9. Ohgaki H, Dessen P, Jourde B, Horstmann S, Nishikawa T, Di Patre PL, Burkhard C, Schüler D, ProbstHensch NM, Maiorka PC, et al. Genetic pathways to glioblastoma: a populationbased study. Cancer Res 2004;
64: 68929.
10. Ohgaki H, Kleihues P. Genetic pathways to primary and secondary glio
blastoma. Am J Pathol 2007; 170: 144553.
11. Liu XY, Gerges N, Korshunov A, Sabha N, KhuongQuang DA, Fontebas
so AM, Fleming A, Hadjadj D, Schwartzentruber J, Majewski J, et al. Fre
quent ATRX mutations and loss of expression in adult diffuse astrocytic tumors carrying IDH1/IDH2 and TP53 mutations. Acta Neuropathol 2012; 124: 61525.
12. Nguyen DN, Heaphy CM, de Wilde RF, Orr BA, Odia Y, Eberhart CG, Mee
ker AK, Rodriguez FJ. Molecular and morphologic correlates of the alter
native lengthening of telomeres phenotype in highgrade astrocytomas.
Brain Pathol 2013; 23: 23743.
13. Newcomb EW, Cohen H, Lee SR, Bhalla SK, Bloom J, Hayes RL, Miller DC. Survival of patients with glioblastoma multiforme is not influenced by altered expression of p16, p53, EGFR, MDM2 or Bcl2 genes. Brain Pathol 1998; 8: 65567.
14. Jiao Y, Killela PJ, Reitman ZJ, Rasheed AB, Heaphy CM, de Wilde RF, Ro
driguez FJ, Rosemberg S, ObaShinjo SM, Nagahashi Marie SK, et al. Fre
quent ATRX, CIC, FUBP1 and IDH1 mutations refine the classification of malignant gliomas. Oncotarget 2012; 3: 70922.
15. Wiestler B, Capper D, HollandLetz T, Korshunov A, von Deimling A, Pfis
ter SM, Platten M, Weller M, Wick W. ATRX loss refines the classification of anaplastic gliomas and identifies a subgroup of IDH mutant astrocytic tumors with better prognosis. Acta Neuropathol 2013; 126: 44351.
16. Schwartzentruber J, Korshunov A, Liu XY, Jones DT, Pfaff E, Jacob K, Sturm D, Fontebasso AM, Quang DA, Tönjes M, et al. Driver mutations in his
tone H3.3 and chromatin remodelling genes in paediatric glioblastoma.
Nature 2012; 482: 22631.
17. Lovejoy CA, Li W, Reisenweber S, Thongthip S, Bruno J, de Lange T, De S, Petrini JH, Sung PA, Jasin M, et al. Loss of ATRX, genome instability, and an altered DNA damage response are hallmarks of the alternative length
ening of telomeres pathway. PLoS Genet 2012; 8: e1002772.
18. Newcomb EW, Madonia WJ, Pisharody S, Lang FF, Koslow M, Miller DC.
A correlative study of p53 protein alteration and p53 gene mutation in glioblastoma multiforme. Brain Pathol 1993; 3: 22935.