http://e-nrp.org
Short Communication
Analysis of the association between health-related and
work-related factors among workers and metabolic syndrome using data from the Korean National Health and Nutrition Examination Survey (2016)
Kyoung Yun Kim and Jung-Mi Yun
§Department of Food and Nutrition, Chonnam National University, Yongbong-ro, Buk-gu, Gwangju 61186, South Korea
BACKGROUND/OBJECTIVE: This study analyzed health-related factors for metabolic syndrome (Mets) among workers in South Korea.
SUBJECTS/METHODS: This analysis included 4,666 adults aged 19-64 years to analyzed health-related risk factors for Mets from the Korean National Health and Nutrition Examination Survey (2016). The sociodemographic, working, health-related, and biochemical characteristics were presented as percentages (%) by chi-square tests. Multiple logistic regression analysis was performed to analyze the 95% confidence intervals (CIs) and associations between health-related factors characteristic of workers and the odds ratios of Mets.
RESULTS: An increased prevalence of Mets was associated with male day workers compared to male shift workers (1.726-fold increase, 95% CI: 1.077-2.765), and with ≥ 8 hrs/day sleep duration compared to < 6 hrs/day sleep duration in female workers (2.133-fold, 95% CI: 1.041-4.368). In addition, reduced odds of high Mets were associated with male workers consumed of breakfast 5-7 times/wk compared to those consumed < 1 time/wk (0.593-fold decrease, 95% CI: 0.372-0.944).
CONCLUSIONS: Health-related factors (sleep duration, frequency of breakfast) and working type in Korean workers may affect the prevalence of Mets.
Nutrition Research and Practice 2019;13(5):444-451; https://doi.org/10.4162/nrp.2019.13.5.444; pISSN 1976-1457 eISSN 2005-6168
Keywords: Korean, metabolic syndrome, working type and health-related factors
INTRODUCTION
*According to Grundy et al. [1], metabolic syndrome (Mets) describes multiple metabolic disorders associated with elevated blood pressure, abdominal obesity, low high-density lipoprotein (HDL) cholesterol, hypertriglyceridemia, and hypertension. The prevalence of Mets in 2015 was 24.3% in 10 European countries [2] and 24.5% in China [3].
The dietary habits of Koreans have changed frequently due to rapid economic development and westernized living habits.
Previous studies reported an age-standardized prevalence of Mets of 20.3% (95% confidence interval [CI], 19.6%-21%) based on data from the Korean National Health and Nutrition Examination Survey (KNHANES) VI (2013-2015) [4]. While the mechanism of ongoing Mets is not clear, the interaction of environmental factors such as genetic and health behavior factors (e.g., smoking, alcohol consumption, stress, sleeping duration, and breakfast intake) is involved [5]. Recent studies have reported Mets improvement or prevention through the management of risk factors such as physical activity [6] and breakfast consumption [7].
In 2014, the statistics of industrial accidents in Korean workers indicated that 415 (10.2% of the total 4,085) workers with work-related illnesses had CVD, which is closely related to the Mets. However, studies on work-related factors among Korean workers are thus far insufficient. There is a lack of population- based research on topics such as Korean workers. The factors affecting Mets in workers include age, sex [8], smoking status, physical activity level [9], diet [10], working hours [11], shift work [12], and occupation [13]. Wang et al. [12] reported that shift work is significantly associated with the risk of Mets, especially in those who are working long hours at night. Yu [11] reported that the relationship between working hours and Mets among 1,148 workers differed according to sex. The prevalence of Mets was significantly higher in women who worked more than 60 hrs/wk (odds ratio [OR], 2.21; 95% CI (1.07, 4.57) compared to that in women working 40-51 hrs/wk. However, the associations with Mets are not consistent due to differences in study subjects, designs, and period [12,14]. Therefore, large-scale population-based studies are needed to analyze the association of working type and health-related factors with Mets.
§Corresponding Author: Jung-Mi Yun, Tel. 82-62-530-1332, Fax. 82-62-530-1339, Email. [email protected] Received: June 25, 2019, Revised: July 9, 2019, Accepted: August 5, 2019
This is an Open Access article distributed under the terms of the Creative Commons Attribution Non-Commercial License (http://creativecommons.org/licenses/by-nc/3.0/) which permits unrestricted non-commercial use, distribution, and reproduction in any medium, provided the original work is properly cited.
Metabolic syndrome
P-value1) No
(n = 3,645) Yes
(n = 1,021)
Age (yrs), n (%)2) < 0.001*
19-34 1,088 (29.8) 107 (10.5)
35-49 1,393 (38.2) 404 (39.6)
50-64 1,164 (31.9) 510 (50.0)
Sex, n (%) < 0.001*
Men 1,470 (40.3) 579 (56.7)
Women 2,175 (59.7) 442 (43.3)
Education, n (%)3) < 0.001*
Elementary school or less 221 (6.7) 142 (14.7)
Junior high school 260 (7.9) 120 (12.4)
High school 1,241 (37.9) 351 (36.4)
Undergraduate and above 1,555 (47.5) 352 (36.5)
Table 1. General characteristics and Health-related factors of workers according to metabolic syndrome in KNHNES, 2016 (n = 4,666)
SUBJECTS AND METHODS Subjects and study design
The KNHANES, conducted by the Ministry of Health-Welfare and the Korea Centers for Disease Control and Prevention, is a cross-sectional study. The study design was a sample survey rather than a full survey and used a two-stage stratified cluster sampling. All estimates were weighted and calculated considering the complex study design. The 7
thKNHANES, conducted from January to December 2016, included 3,513 households and 8,150 participants. After excluding pregnant and lactating women who could affect the onset of Mets, as well as self-employed and employers, unpaid family workers, unemployed individuals, and the non-economically-active population, a total of 4,666 participants were selected as the final analysis subjects in the present study.
This study was approved by the Institutional Review Board (IRB) of Chonnam National University, Gwangju, Korea (IRB:
1040198-180529-HR-052-01) and was performed in accordance with the principles of the Declaration of Helsinki.
Metabolic syndrome diagnostic criteria
Mets was defined according to the diagnostic criteria proposed by the Adult Treatment Program III of the National Cholesterol Education Program (NCEP ATP III, 2005) [15,16].
Assessment of sociodemographic and health-related characteristics of workers
To analyze the sociodemographic characteristics of the subjects, as described in a previous study [17], the ages of the study subjects were grouped as follows: 19-34, 35-49, and 50-64 years. The classification of occupations in the KNHANES was based on standard occupational classifications, with managers, experts and related workers, clerks categorized as office workers, while service workers, sales workers, agriculture fishery skilled workers, functional and related functional workers, equipment, machine operators and assembly workers, and laborers were classified as non-office workers. Using the KNHANES′ working hour variable, we classified the working type as day work (6 am-6 pm) and shift work. This shift work were included evening work (2 pm-midnight), night work (9 pm-8 am the next day), day and night regular shift work and all irregular shift work.
In the dietary survey, the frequency variables of eating breakfast and eating out for one week in the previous year were assessed.
Eating out was defined as eating food prepared at places other than the home, such as food for delivery, pre-packaged food, or food provided by a religious group. This study did not consider snacks to be eating out.
Assessment of anthropometry, biochemical and nutrient intake characteristic
The anthropometry and biochemical characteristic of the participants were assessed by anthropometric measurements and BP, body mass index (BMI), WC, FBG, TG, and HDL-C data from the KNHANES. KNHANES was conducted by asking the participants to recall their food consumption in 24-hr during a face-to-face interview in order to estimate the daily energy and nutrient intakes. Detailed information on anthropometric and biochemical measurements, and nutrient intake characteristic is described elsewhere [4].
Statistical analysis
Statistical analysis was performed using SPSS 18.0 (SPSS Statistics, Armonk, NY, USA). Continuous variables were expressed as means ± standard deviation using the general linear model t-test. Categorical variables were presented as percentages (%) by chi-square tests. Multiple logistic regression analysis was performed to analyze the 95% CIs and the association between health-related factors of workers with the OR of Mets. In order to identify accurate associations through multiple logistic regression analysis, we used a regression model that corrected for confounding factors.
RESULTS
General characteristics of workers with metabolic syndrome As shown in Table 1, participant age (P < 0.001), sex (P <
0.001), education level (P < 0.001), economic level (P < 0.001),
occupation (P = 0.002), and working type (P = 0.004) differed
significantly according to Mets status. Men and women comprised
of 579 (56.7%) and 442 (43.3%) of participants in the Mets
group, respectively. With regards to working type among
participants with of Mets, 86.2% were day workers (n = 661) and
13.8% were shift workers (n = 106). In terms of health-related
Metabolic syndrome
P-value1) No
(n = 3,645)
Yes (n = 1,021)
Economic level, n (%)3) < 0.001*
Low 318 (8.8) 137 (13.4)
Low-middle 822 (22.6) 266 (26.1)
Middle-high 1,168 (32.1) 313 (30.7)
High 1,326 (36.5) 304 (29.8)
Occupation, n (%)3) 0.002*
Office worker 1,035 (31.6) 254 (26.3)
Non-office worker 2,240 (68.4) 711 (73.7)
Working hrs/wk, n (%)3)
< 40 858 (24.9) 229 (22.4)
40-49 851 (27.6) 295 (28.9)
50-59 391 (11.3) 110 (10.8)
≥ 60 1,248 (36.2) 387 (37.9)
Working type, n (%)3) 0.004*
Day worker 2,048 (81.7) 661 (86.2)
Shift worker 458 (18.3) 106 (13.8)
Smoking status, n (%)3) < 0.001*
non-smoker 2,169 (63.8) 462 (46.0)
ex-smoker 574 (16.9) 219 (21.8)
current smoker 659 (19.4) 324 (32.2)
Drinking, n (%)3) < 0.001*
0-once a mo 1,490 (46.9) 403 (43.3)
2-4 times a mo 929 (29.3) 213 (22.9)
2-3 times a wk 570 (18.0) 195 (21.0)
more than 4 times a wk 186 (5.9) 119 (12.8)
Stress perception, n (%)3) 0.252
feel a bit 1,002 (29.5) 315 (31.3)
feel a lot 2,399 (70.5) 690 (68.7)
Sleep duration (hrs), n (%)3)
< 6 439 (12.7) 163 (16.0)
6-8 853 (24.7) 260 (25.5)
≥ 8 2,156 (62.5) 598 (58.6)
Sitting in a wk (hrs), n (%)3)
< 5 613 (17.8) 172 (16.8)
5-10 1,455 (42.2) 421 (41.2)
≥ 10 1,380 (40.0) 428 (41.9)
Practice of aerobic physical activity4), n (%)3)
Yes 1,650 (50.4) 403 (41.8)
Frequency of breakfasts/wk, n (%)3)
< 1 time 499 (16.1) 129 (15.7)
1-2 times 415 (13.4) 104 (12.6)
3-4 times 443 (14.3) 90 (10.9)
5-7 times 1,737 (56.1) 501 (60.8)
Frequency of eating-out, n (%)3)
< 1 time/mo 84 (2.7) 41 (5.0)
1-3 times/mo 435 (14.1) 152 (18.4)
1-6 times/wk 1,638 (52.9) 373 (45.3)
1/time/day 643 (20.8) 177 (21.5)
≥ 2 times/day 294 (9.5) 81 (9.8)
All estimates were weighted and calculated taking the complex study design into account.
1)P-value were obtained from a chi-square test for categorical variable.
2)Allvalues are expressed as the number of subjects for each category n (%).
3)The response base differs because there are cases of irrelevant responses or no responses.
4)Practice of aerobic physical activity was assigned "yes" if the subject practiced moderate-intensity physical activity for a wk for more than 2 hrs 30 minutes or practiced high-intensity physical activity for more than 1 hr and 15 minutes or practiced with moderate intensity and high-intensity physical activity (2 minutes moderate intensity for high intensity one minute)
*P< 0.05 Table 1. continued
Metabolic syndrome
P-value1) No
(n = 3,645)
Yes (n = 1,021) Characteristics of anthropometry and biochemical
Weight (kg)2) 62.2 ± 11.2 74.6 ± 13.2 < 0.001*
Height (m) 1.6 ± 8.5 1.7 ± 9.4 < 0.001*
Body mass index (kg/m2), n (%)2),3)
< 18.5 177 (5.1) 3 (0.3) < 0.001*
18.5-24.9 2,467 (71.7) 285 (28.0)
25.0-29.9 717 (20.8) 555 (54.5)
> 30.0 81 (2.4) 176 (17.3)
Characteristics of nutrition intake
Total energy intakes (kcal) 2,026.7 ± 907.7 2,103.8 ± 958.4 0.032*
Nutrient density per 1,000 kcal
Carbohydrate (g/1,000 kcal) 150.2 ± 33.3 180.9 ± 37.4 0.635
Protein (g/1,000 kcal) 36.1 ± 10.7 34.8 ± 10.0 0.002*
Fat (g/1,000 kcal) 23.9 ± 10.2 21.4 ± 9.7 < 0.001*
n-3 fatty acids (g/1,000 kcal) 0.8 ± 0.7 0.8 ± 0.8 0.615
n-6 fatty acids (g/1,000 kcal) 4.9 ± 2.8 4.5 ± 2.6 < 0.001*
Calcium (mg/1,000 kcal) 247.4 ± 129.3 243.3 ± 124.5 0.415
Sodium (mg/1,000 kcal) 1,908.8 ± 934.6 1,975.4 ± 930.8 0.069
Potassium (mg/1,000 kcal) 1,542.8 ± 621.9 1,544.8 ± 625.5 0.937
Iron (mg/1,000 kcal) 8.7 ± 7.1 8.7 ± 4.5 0.885
Vit A (μgRE/1,000 kcal) 372.0 ± 570.0 350.0 ± 351.6 0.287
Riboflavin (mg/1,000 kcal) 0.6 ± 0.3 0.8 ± 0.2 0.010*
Vit C (mg/1,000 kcal) 56.4 ± 63.0 53.5 ± 57.3 0.234
Dietary fiber (g/1,000 kcal) 11.7 ± 5.5 12.0 ± 5.6 0.198
All estimates were weighted and calculated taking the complex study design into account.
1)P-value were obtained from the general linear model (GLM) for continuous variables and from a chi-square test for categorical variable.
2)Values are expressed as mean ± SD or each category n (%).
3)The response base differs because there are cases of irrelevant responses or no responses.
*P< 0.05
Table 2. Anthropometry, biochemical and, nutrition intake characteristics of workers according to metabolic syndrome in KNHNES, 2016 (n = 4,666)
factors, smoking status (P < 0.001), alcohol consumption (P <
0.001), sleep duration (P = 0.016), aerobic physical activity (P <
0.001), frequency of breakfast consumption (P = 0.039), and frequency of eating out (P < 0.001) differed significantly according to Mets status. 58.6% (n = 598) of participants with Mets had sleeping durations of ≥ 8 hrs/day (P = 0.016). Regarding the frequency of breakfast consumption, 60.8% (n = 501) of the participants with Mets ate breakfast 5-7 times/wk. Finally, 45.3%
(n = 373) of the participants with Mets reported eating out 1-6 times/wk, and 31.3% (258) reported eating out ≥ 1 time/day (P < 0.001).
Anthropometry, biochemical and, nutrition intake of workers with Mets
As shown in Table 2, among Met subjects, 54.5% (n = 555) were overweight (BMI 25.0-29.9 kg/m
2) while 28.0% (n = 285) were normal weight (BMI 18.5-24.9 kg/m
2). The total energy intake differed significantly between the Mets (2,103.8 kcal) and non-Mets (2,026.7 kcal) groups (P = 0.032). The protein (g/1,000 kcal), fat (g/1,000 kcal), n-6 fatty acid (g/1,000 kcal), riboflavin (mg/1,000 kcal) intakes (P < 0.05) differed significantly between the Mets and non-Mets groups.
Association between health-related factors and metabolic syndrome prevalence
Health-related factors of the workers on Mets were analyzed and the data are presented in Table 3. In order to validate the health-related factors of workers with Mets, multiple logistic regression analysis was performed using the regression model as the confounding factor. Model 3 was adjusted for multiple confounding factors, including sex; age; BMI; education;
economic level; smoking status; alcohol consumption; stress perception; aerobic physical activity; frequency of eating out;
and intakes of total energy (kcal), protein (g/1,000 kcal), fat (g/1,000 kcal), n-6 fatty acids (g/1,000 kcal), and riboflavin (mg/1,000 kcal). With regard to working type, the adjusted odds ratio (AOR) of Mets increased by 1.726-fold (95% CI: 1.077- 2.765)] in male day workers compared to male shift workers.
Regarding breakfast frequency, the AOR of Mets decreased by
0.593-fold (95% CI: 0.372-0.944) for a frequency of 5-7 times/wk
compared to < 1 time/wk in men. With regard to sleep duration,
the AOR of Mets increased by 2.133-fold (95% CI: 1.041-4.368)
for sleep duration of ≥ 8 hrs compared to < 6 hrs. Thus, the
working type and frequency of breakfast consumption in men
and sleep duration and frequency of breakfast consumption in
women affected the prevalence of Mets in our study.
Characteristics
Model 11)
OR (95% CI) Model 22)
OR (95% CI) Model 33)
OR (95% CI) Men
(n = 2,049) Women
(n = 2,617) Men
(n = 2,049) Women
(n = 2,617) Men
(n = 2,049) Women
(n = 2,617) Working hrs/wk
< 40 1.0 (reference) 1.0 (reference) 1.0 (reference) 1.0 (reference) 1.0 (reference) 1.0 (reference)
40-49 1.056 (0.755-1.477) 0.734 (0.509-1.060) 1.045 (0.710-1.537) 0.760 (0.496-1.167) 1.047 (0.688-1.594) 0.807 (0.486-1.340) 50-59 0.734 (0.485-1.111) 0.756 (0.443-1.290) 0.676 (0.420-1.087) 0.513 (0.273-0.965) 0.847 (0.504-1.425) 0.487 (0.223-1.061)
≥ 60 1.214 (0.813-1.814) 1.078 (0.659-1.763) 0.979 (0.615-1.557) 1.031 (0.582-1.827) 0.952 (0.574-1.578) 1.146 (0.582-2.258) Working type
Shift worker 1.0 (reference) 1.0 (reference) 1.0 (reference) 1.0 (reference) 1.0 (reference) 1.0 (reference)
Day worker 1.778 (1.202-2.629) 0.959 (0.643-1.431) 1.653 (1.059-2.579) 0.901 (0.567-1.433) 1.726 (1.077-2.765) 0.742 (0.439-1.255) Occupation
Office worker 1.0 (reference) 1.0 (reference) 1.0 (reference) 1.0 (reference) 1.0 (reference) 1.0 (reference) Non-office worker 1.176 (0.901-1.535) 2.782 (1.952-3.964) 1.128 (0.828-1.537) 1.397 (0.910-2.144) 1.110 (0.754-1.634) 0.984 (0.547-1.769) Sleep duration (hrs/day)
< 6 1.0 (reference) 1.0 (reference) 1.0 (reference) 1.0 (reference) 1.0 (reference) 1.0 (reference)
6-8 0.845 (0.555-1.286) 1.701 (1.004-2.881) 0.838 (0.521-1.350) 1.636 (0.886-3.021) 0.814 (0.488-1.359) 2.695 (1.252-5.801)
≥ 8 0.750 (0.509-1.103) 1.199 (0.736-1.956) 0.774 (0.500-1.198) 1.515 (0.861-2.666) 0.769 (0.482-1.227) 2.133 (1.041-4.368) Frequency of breakfasts/wk
< 1 time 1.0 (reference) 1.0 (reference) 1.0 (reference) 1.0 (reference) 1.0 (reference) 1.0 (reference)
1-2 times 0.938 (0.596-1.478) 0.866 (0.471-1.592) 0.673 (0.401-1.131) 0.575 (0.278-1.188) 0.658 (0.379-1.142) 0.393 (0.161-0.962) 3-4 times 0.752 (0.470-1.205) 1.070 (0.583-1.964) 0.621 (0.363-1.063) 0.534 (0.258-1.104) 0.670 (0.377-1.191) 0.553 (0.240-1.274) 5-7 times 0.906 (0.636-1.289) 1.092 (0.696-1.711) 0.566 (0.369-0.869) 0.603 (0.350-1.037) 0.593 (0.372-0.944) 0.585 (0.310-1.102) OR, Odds Ratio; CI, Confidence Interval.
1)Model 1: crude.
2)Model 2: adjusted for sex, age and body mass index.
3)Model 3: adjusted for sex, age, body mass index, education, economic level, smoking status, drinking, stress perception, practice of aerobic physical activity, frequency of eating-out, total energy intakes (kcal), protein (g/1,000 kcal), fat (g/1,000 kcal), n-6 fatty acids (g/1,000 kcal) and riboflavin (mg/1,000 kcal).
*P< 0.05 (by multiple logistic regression analysis).
Table 3. Odds ratio and 95% confidence interval of metabolic syndrome according to the workers’ health-related factors characteristics in KNHNES, 2016
Working type
P-value1) Shift worker
(n = 564) Day worker
(n = 2,709) Characteristics of sociodemographic and health related factors of workers
Age (yrs), n (%)2) < 0.001
19-34 204 (36.2) 627 (23.1)
35-49 185 (32.8) 1,111 (41.0)
50-64 175 (31.0) 971 (35.8)
Sex, n (%) 0.043
Men 262 (46.5) 1,385 (51.1)
Women 302 (53.5) 1,324 (48.9)
Education, n (%)3) < 0.001
Elementary school or less 39 (6.9) 222 (8.2)
Junior high school 44 (7.8) 252 (9.3)
High school 269 (47.7) 930 (34.3)
Undergraduate and above 212 (37.6) 1,304 (48.2)
Occupation, n (%)3) < 0.001
Office worker 155 (27.5) 1,134 (41.9)
Non-office worker 408 (72.5) 1,572 (58.1)
Working hrs/wk, n (%) < 0.001
< 40 269 (47.7) 818 (30.2)
40-49 143 (25.4) 1,103 (40.7)
50-59 70 (12.4) 431 (15.9)
≥ 60 82 (14.5) 357 (13.2)
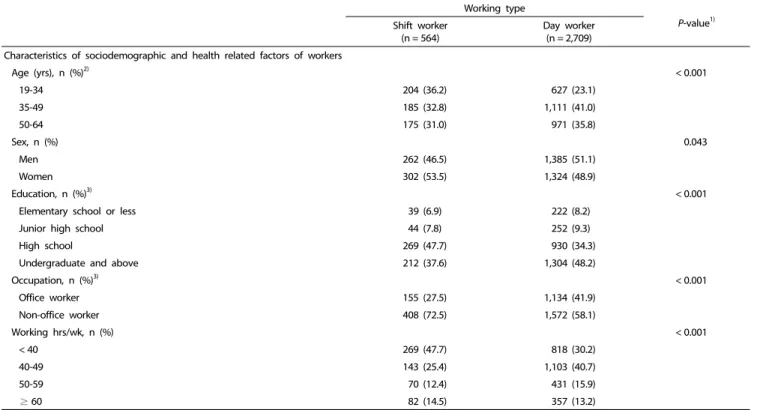
Table 4. General characteristics of workers according to working type in KNHNES, 2016 (n = 3,273)
Working type
P-value1) Shift worker
(n = 564)
Day worker (n = 2,709)
Smoking status, n (%)3) 0.177
non-smoker 319 (56.6) 1,468 (54.2)
ex-smoker 100 (17.7) 574 (21.2)
current smoker 145 (25.7) 664 (24.5)
Drinking, n (%)3) 0.050
less than once a mo 232 (43.5) 1,064 (41.6)
2-4 times a mo 174 (32.6) 735 (28.8)
2-3 times a wk 89 (16.7) 533 (20.9)
more than 4 times a wk 38 (7.1) 223 (8.7)
Stress perception, n (%)3) 0.018
feel a bit 145 (25.7) 831 (30.7)
feel a lot 419 (74.3) 1,875 (69.3)
Sleep duration (hrs), n (%) < 0.001
< 6 115 (20.4) 332 (12.3)
6-8 123 (21.8) 763 (28.2)
≥ 8 326 (57.8) 1,614 (59.6)
Sitting in a week (hrs), n (%) 0.325
< 5 123 (21.8) 524 (19.3)
5-10 244 (43.3) 1,170 (43.2)
≥ 10 197 (34.9) 1,015 (37.5)
Practice of aerobic physical activity4), n (%)3) 0.236
Yes 284 (50.4) 1,288 (47.6)
Frequency of breakfasts/wk, n (%)3) 0.016
< 1 time 89 (18.8) 352 (15.7)
1-2 times 77 (16.2) 304 (13.6)
3-4 times 75 (15.8) 302 (13.5)
5-7 times 233 (49.2) 1,280 (57.2)
Frequency of eating-out, n (%)3) 0.032
< 1 time/mo 11 (2.3) 247 (9.1)
1-3 times/mo 65 (13.7) 1,091 (40.3)
1-6 times/wk 254 (53.6) 586 (21.6)
1 time/day 100 (21.1) 265 (9.8)
≥ 2 times/day 44 (9.3) 266 (10.8)
Metabolic syndrome, n (%) 0.004
Yes 106 (18.8) 661 (24.4)
No 458 (81.2) 2,048 (75.6)
Characteristics of nutrition intake
Total energy intakes (kcal) 2,068.5 ± 954.9 2,122.2 ± 931.0 0.257
Potassium (mg/1,000 kcal) 1,459.1 ± 555.6 1,521.9 ± 573.8 0.030
All estimates were weighted and calculated taking the complex study design into account.
1)P-value were obtained from the general linear model (GLM) for continuous variables and from a chi-square test for categorical variable.
2)All values are expressed as the number of subjects for each category n (%) or mean ± SD.
3)The response base differs because there are cases of irrelevant responses or no responses.
4)Practice of aerobic physical activity was assigned "yes" if the subject practiced moderate-intensity physical activity for a week for more than 2 hrs 30 minutes or practiced high-intensity physical activity for more than 1 hour and 15 minutes or practiced with moderate intensity and high-intensity physical activity (2 minutes moderate intensity for high intensity one minute)
*P< 0.05 Table 4. continued
Participant characteristic according to working type
As shown in Table 3, the OR for Mets of day workers was higher than that of shift workers; thus, we sought to identify the health-related variables of day workers. Therefore, we analyzed the characteristics of subjects according to working
type, as shown in Table 4. According to working type, there
were significant differences in participant age (P < 0.001), sex
(P = 0.043), education (P < 0.001), occupation (P < 0.001), working
hours (P < 0.001), alcohol consumption (P = 0.05), stress perception
(P = 0.018), sleep duration (P < 0.001), frequency of breakfast
consumption (P = 0.016), frequency of eating out, (P = 0.032), Mets (P = 0.004), and potassium intake (mg/1,000 kcal) (P = 0.030) between day and shift workers.
DISCUSSION
Mets risk factors are affected by the interactions between lifestyle factors such as smoking, alcohol consumption, stress, sleeping hours, breakfast intake, and physical activity [5,6]. The aim of this study was to identify the risk factor of Mets in Korean workers, including various health-related factors, using 2016 KNHANES data. Male day workers had a 1.726-fold increased prevalence of Mets compared to that of male shift workers (95%
CI: 1.077-2.765). In addition, male consumption of breakfast 5-7 times/wk was associated with a 0.593-fold reduced risk of Mets compared to that in male workers who consumed breakfast
< 1 time/wk (95% CI: 0.372-0.944). Similar to the report from Cheserek et al. [8], men in our study were more vulnerable to Mets than were women.
Traditional Korean dietary patterns have been westernized in recent decades and it has become common to substitute bread for rice in daily diets. Although the importance of breakfast as a healthy dietary factor has been reported [18], the breakfast type (ready-to-eat cereal breakfast, etc.) has changed and the ratio of those who skip breakfast is increasing [19].
In the KNHANES 2013-2016 report, 25.1% of men and 22.6%
of women skipped breakfast in 2013, which increased to 29.5%
and 24.9%, respectively, for in 2016 [19]. According to previous studies, compared to subjects who reported eating breakfast daily, the maximally-adjusted hazard ratios and 95% CIs of those with the frequencies of almost every day and 3-5, 1-2, and 0 days/week were 1.06 (95% CI, 0.73-1.53), 2.07 (95% CI, 1.20-3.56), 1.37 (95% CI, 0.82-2.29), and 2.12 (95% CI, 1.19-3.76), respectively [20]. There is increasing evidence that skipping breakfast is directly related to weight gain and other unhealthy results such as insulin resistance and T2D [18]. Thus, skipping breakfast, at least in part, might affect the risk of Mets. In our study, consuming breakfast 5-7 times/wk was associated with a 0.593-fold reduced OR (95% CI: 0.372-0.944) compared to consuming breakfast
< 1 time/wk in men, while eating breakfast 1-2 times/wk was associated with a 0.393-fold reduced OR (95% CI: 0.161-0.962) compared to < 1 time/wk in women.
In this study, 20.6% of day workers ate out ≥ 1 times/day.
Based on the KNHANES 2008-2014 report, the percentage of eating-out increased from 23.8% in 2008 to 28.3% in 2014 [21].
The negative effects of frequent eating-out on T2DM, CVD, Mets, and obesity have been reported and the frequency of eating-out is increasing, indicating the need to create healthy eating environments [22]. The results of the present study of a higher prevalence of Me ts among day worker compared to that of shift worker were in contrast to the results of a previous study [12].
Therefore, we analyzed the general characteristics of day workers. Table 4 shows that day workers were significantly older (P < 0.001) than shift workers and that male workers, with a higher prevalence of Mets than that in female workers (data not presented). In addition, day workers had a significantly higher distribution of office workers (P < 0.001) than shift
workers as well as a higher distribution of workers who worked
≥ 40 hrs/wk. According to the OECD report, Korea's average working hours were 2,163 hrs/year (180 hrs/month) in 2013, which was second among 34 OECD member countries [23].
Although the definitions of long working hours (self-reported working hours) and shift work were not appropriately addressed, a systematic review of 12 prospective cohort and seven cross-sectional studies showed that the number of working hours was associated with disease, including depressive state, anxiety, sleep condition, and coronary heart disease [24].
However, our study observed no association between working hours and Mets.
As shown in Table 3, comparison of ≥ 8 and < 6 hrs/ day sleep duration was associated with a 2.133-fold (95% CI:
1.041-4.368) increased prevalence of Mets in female workers.
Furthermore, the sleep duration of women was associated with a 2.695-fold (95% CI: 1.252-5.801) increased OR of Mets in 6-8 hrs/day. In 2018, Kim et al. [25] reported that the effects of sleeping duration on Mets differed according to sex. In particular, women′s sleeping duration was negatively related to Mets compared to that in men. Compared to < 6 hrs/day, the OR of Mets for sleep duration of 6-8 hrs/day increased by 1.12-fold (adjusted OR: 1.12, 95% CI: 1.05-1.19) in men and the OR of Mets for WC was also increased (1.09, 1.04-1.14) in women. Furthermore, in women, compared to < 6 hrs/day, a sleep duration of > 10 hrs/day was associated with Mets (1.40, 1.24-1.58), increased WC (1.14, 1.02-1.27), increased TG (1.41, 1.25-1.58), decreased HDL-C (1.24, 1.12-1.38), and elevated FBG (1.39, 1.23-1.57). Numerous studies (including ours) have suggested that long hours of sleep are not beneficial to health [26,27].
Our study is meaningful in analyzing various risk factors of Mets among a representative population of adult Korean workers aged 19-64 years participating in the 7
thKNHANES (2016). However, the KNHANES is not an investigation conducted for the specialized study of working characteristics; therefore, details on working environments such as shift hours, duration, and work intensity are not considered. In order to clarify their precise relationship with disease, additional studies including various variables related to worker environment are required. Also there is a limit to investigating the characteristics of sleep duration and stress perception using health-related factors. Sleep duration was not used as a sensitive measure of worker health as we examined hours only and not sleep quality. Despite these limitations, we sought to identify in depth the health-related factors of workers associated with Mets by calibrating variables that showed significant differences in the nutrient intake of the workers analyzed.
In conclusion, health-related factors (sleep duration, frequency of breakfast) and working type in Korean workers may affect the prevalence of Mets. Based on the results of analyzing the general characteristics of day workers, detailed studies are warranted on diseases among environmental factors related to the health of male workers.
CONFLICT OF INTEREST
The authors declar no potential conflicts of interests
ORCID
Jung-Mi Yun: https://orcid.org/0000-0001-6044-0647 Kyoung Yun Kim: https://orcid.org/0000-0001-8135-5273 REFERENCES
1. Grundy SM, Cleeman JI, Daniels SR, Donato KA, Eckel RH, Franklin BA, Gordon DJ, Krauss RM, Savage PJ, Smith SC Jr, Spertus JA.
Diagnosis and management of the metabolic syndrome: an American Heart Association/National Heart, Lung, and Blood Institute scientific statement. Crit Pathw Cardiol 2005;4:198-203.
2. Scuteri A, Laurent S, Cucca F, Cockcroft J, Cunha PG, Mañas LR, Mattace Raso FU, Muiesan ML, Ryliškytė L, Rietzschel E, Strait J, Vlachopoulos C, Völzke H, Lakatta EG, Nilsson PM; Metabolic Syndrome and Arteries Research (MARE) Consortium. Metabolic syndrome across Europe: different clusters of risk factors. Eur J Prev Cardiol 2015;22:486-91.
3. Xiao J, Huang JP, Xu GF, Chen DX, Wu GY, Zhang M, Shen Y, Cai H. Association of alcohol consumption and components of metabolic syndrome among people in rural China. Nutr Metab (Lond) 2015;12:5.
4. Huh JH, Kang DR, Jang JY, Shin JH, Kim JY, Choi S, Cho EJ, Park JS, Sohn IS, Jo SH, Sung KC, Koh KK. Metabolic syndrome epidemic among Korean adults: Korean survey of Cardiometabolic Syndrome (2018). Atherosclerosis 2018;277:47-52.
5. Oh JD, Lee SY, Lee JG, Kim YJ, Cho BM. Health behavior and metabolic syndrome. Korean J Fam Med 2009;30:120-8.
6. Wang Q, Chair SY, Wong EM. The effects of a lifestyle intervention program on physical outcomes, depression, and quality of life in adults with metabolic syndrome: a randomized clinical trial. Int J Cardiol 2017;230:461-7.
7. Chung SJ, Lee Y, Lee S, Choi K. Breakfast skipping and breakfast type are associated with daily nutrient intakes and metabolic syndrome in Korean adults. Nutr Res Pract 2015;9:288-95.
8. Cheserek MJ, Wu GR, Shen LY, Shi YH, Le GW. Disparities in the prevalence of metabolic syndrome (MS) and its components among university employees by age, gender and occupation. J Clin Diagn Res 2014;8:65-9.
9. Ryu H, Chin DL. Factors associated with metabolic syndrome among Korean office workers. Arch Environ Occup Health 2017;72:249-57.
10. Molzof HE, Wirth MD, Burch JB, Shivappa N, Hebert JR, Johnson RL, Gamble KL. The impact of meal timing on cardiometabolic syndrome indicators in shift workers. Chronobiol Int 2017;34:337-48.
11. Yu J. Relationship between long working hours and metabolic syndrome among Korean workers. Asian Nurs Res 2017;11:36-41.
12. Wang F, Zhang L, Zhang Y, Zhang B, He Y, Xie S, Li M, Miao X, Chan EY, Tang JL, Wong MC, Li Z, Yu IT, Tse LA. Meta-analysis on night shift work and risk of metabolic syndrome. Obes Rev 2014;15:709-20.
13. Akintunde AA, Oloyede TW. Metabolic syndrome and occupation:
any association? Prevalence among auto technicians and school
teachers in South West Nigeria. Diabetes Metab Syndr 2017;11 Suppl 1:S223-7.
14. Stefani KM, Kim HC, Kim J, Oh K, Suh I. The influence of sex and age on the relationship between sleep duration and metabolic syndrome in Korean adults. Diabetes Res Clin Pract 2013;102:250-9.
15. Hanley AJ, Karter AJ, Williams K, Festa A, D'Agostino RB Jr, Wagenknecht LE, Haffner SM. Prediction of type 2 diabetes mellitus with alternative definitions of the metabolic syndrome: the insulin resistance atherosclerosis Study. Circulation 2005;112:3713-21.
16. Lee S, Park HS, Kim SM, Kwon HS, Kim DY, Kim DJ, Cho GJ, Han JH, Kim SR, Park CY, Oh SJ, Lee CB, Kim KS, Oh SW, Kim YS, Choi WH, Yoo HJ. Cut-off points of waist circumference for defining abdominal obesity in the Korean population. Korean J Obes 2006;15:1-9.
17. Hwang WJ, Lee CY. Effect of psychosocial factors on metabolic syndrome in male and female blue-collar workers. Jpn J Nurs Sci 2014;11:23-34.
18. Mekary RA, Giovannucci E, Cahill L, Willett WC, van Dam RM, Hu FB. Eating patterns and type 2 diabetes risk in older women:
breakfast consumption and eating frequency. Am J Clin Nutr 2013;98:436-43.
19. Ministry of Health and Welfare, Korea Centers for Disease Control and Prevention. Korea Health Statistics 2016: Korea National Health and Nutrition Examination Survey (KNHANES VII). Cheongwon;
Korea Centers for Disease Control and Prevention; 2017.
20. Uemura M, Yatsuya H, Hilawe EH, Li Y, Wang C, Chiang C, Otsuka R, Toyoshima H, Tamakoshi K, Aoyama A. Breakfast skipping is positively associated with incidence of type 2 diabetes mellitus:
evidence from the Aichi workers' cohort study. J Epidemiol 2015;25:351-8.
21. Bae YJ. Evaluation of dietary intake in Korean adults according to energy intake from eating-out: based on 2013-2014 Korea National Health and Nutrition Examination Survey. J Nutr Health 2016;49:
482-94.
22. Tsukinoki R, Morimoto K, Nakayama K. Association between lifestyle factors and plasma adiponectin levels in Japanese men. Lipids Health Dis 2005;4:27.
23. Lee SR. A Study on the Relationship between Working Hours, Health and Productivity of Workers. Sejong: Korea Labor Institute; 2015.
24. Bannai A, Tamakoshi A. The association between long working hours and health: a systematic review of epidemiological evidence.
Scand J Work Environ Health 2014;40:5-18.
25. Kim CE, Shin S, Lee HW, Lim J, Lee JK, Shin A, Kang D. Association between sleep duration and metabolic syndrome: a cross-sectional study. BMC Public Health 2018;18:720.
26. Kim K, Shin D, Jung GU, Lee D, Park SM. Association between sleep duration, fat mass, lean mass and obesity in Korean adults: the fourth and fifth Korea National Health and Nutrition Examination Surveys. J Sleep Res 2017;26:453-60.
27. Itani O, Jike M, Watanabe N, Kaneita Y. Short sleep duration and health outcomes: a systematic review, meta-analysis, and meta- regression. Sleep Med 2017;32:246-56.