© 2018 The Korean Ophthalmological Society
This is an Open Access article distributed under the terms of the Creative Commons Attribution Non-Commercial License (http://creativecommons.org/licenses /by-nc/3.0/) which permits unrestricted non-commercial use, distribution, and reproduction in any medium, provided the original work is properly cited.
Original Article
Glaucoma drainage valves can be implanted to reduce intraocular pressure (IOP) in eyes with intractably elevated IOP [1-4]. Such treatment is usually preferred when con- ventional trabeculectomy is likely to fail or has failed al- ready. For instance, glaucoma drainage valves are often
implanted to treat elevated IOP in eyes that have undergone pars plana vitrectomy (PPV) [5-7]. IOP might be elevated due to either to the PPV procedure or the ocular pathology that prompted the PPV [8-10]. Up to 35% of patients who undergo PPV subsequently experience IOP elevation to higher than 30 mmHg [8]. When IOP is elevated shortly af- ter PPV, it may soon resolve; however, in some eyes, IOP remains high and must be lowered surgically. Although glaucoma drainage valves are commonly implanted in eyes with elevated IOP after PPV, no research has thoroughly investigated the factors associated with long-term outcomes
Received: November 17, 2017 Accepted: December 26, 2017
Corresponding Author: Kyung Rim Sung, MD, PhD. Department of Oph- thalmology, Asan Medical Center, University of Ulsan College of Medicine,
#88 Olympic-ro 43-gil, Songpa-gu, Seoul 05505, Korea. Tel: 82-2-3010- 3680, Fax: 82-2-470-6440, E-mail: [email protected]
Influence of Vitrectomy-related Factors on the Outcome of Ahmed Glaucoma Valve Implantation
Jaehyuck Jo, Kyung Rim Sung, Yoon Jeon Kim
Department of Ophthalmology, Asan Medical Center, University of Ulsan College of Medicine, Seoul, Korea
Purpose: To evaluate the outcome of Ahmed glaucoma valve (AGV) implantation in eyes with refractory sec- ondary glaucoma following pars plana vitrectomy (PPV) and the associated prognostic factors.
Methods: A total of 146 eyes in 146 patients who underwent AGV implantation after PPV (followed up for ≥1 year) were included. AGV implantation was considered successful when the intraocular pressure (IOP) was 6 to 21 mmHg regardless of using IOP-lowering medication. The hazard ratios (HRs) associated with surgical failure were determined with Cox proportional analysis.
Results: The most common cause for PPV was complications of proliferative diabetic retinopathy (50%). The mean and peak IOPs between PPV and AGV implantation were 26.9 ± 6.6 and 35.9 ± 10.2 mmHg, respec- tively. AGV implantation was performed on average 18.7 months after PPV, and its overall success rate was 80.1% during a mean follow-up period of 43.6 months. In multivariate analyses, rubeosis observed before AGV implantation (HR, 4.07; 95% confidence interval, 1.57 to 10.6; p = 0.004) and higher peak IOP before AGV (HR, 1.04; 95% confidence interval, 1.00 to 1.07; p = 0.034) were predictive of failure. However, no PPV-related fac- tors were associated with the surgical outcome of AGV implantation.
Conclusions: The outcome of AGV implantation is good in refractory glaucoma following PPV. Rubeosis after PPV and higher peak IOP before AGV are risk factors for poor outcomes. Patients who undergo PPV should be followed for the development of rubeosis and IOP control.
Key Words: Ahmed glaucoma valve, Increased intraocular pressure, Vitrectomy
of this treatment. Therefore, we analyzed the outcomes of Ahmed glaucoma valve (AGV) implantation in eyes with intractably elevated IOP after PPV. Furthermore, we ex- plored which factors were associated with these long-term outcomes. In particular, we investigated various factors as- sociated with PPV procedures themselves as well as pre- and post-PPV ocular status.
Materials and Methods
Subjects
Data were retrospectively collected from consecutive pa- tients who underwent AGV implantation (model: FP7) after PPV at the glaucoma clinic of Asan Medical Center, Seoul, South Korea, between March 2008 and July 2014 to treat intractable IOP elevation. In all patients, IOP remained high, although the maximum-tolerated medical therapy (MTMT) was used. All AGVs were implanted by a single surgeon (KRS). Only patients who had been followed up for at least 1 year after implantation were included. If both eyes from a single patient met the inclusion criteria, one eye was chosen at random. Patients who underwent con- comitant procedures, such as cataract extraction, penetrat- ing keratoplasty, or silicone oil (SO) removal, during AGV implantation were excluded. Eyes that showed rubeosis at either the anterior chamber angle or the iris before PPV, i.e., diagnosed as neovascular glaucoma (NVG) before PPV were also excluded. The study was approved by our institu- tional review board (2016-0507) and followed the principles of the Declaration of Helsinki. Written informed consent was obtained.
Surgical procedure
The surgical procedure has been described elsewhere [11].
Briefly, AGVs were implanted by using a fornix-based con- junctival flap, which was constructed at the superotemporal or inferotemporal area. A limbus-based, half-thickness scleral flap (5-mm circumference × 7-mm radius) was then prepared. The AGV was placed under Tenon’s capsule, 8 to 10 mm posterior to the superotemporal or inferotemporal limbus. It was fixed and sutured with a 9-0 nylon suture.
The chamber was accessed under the scleral flap with a 23-gauge needle, and the AGV was implanted 2 mm poste-
rior to the limbus, parallel to the plane of the iris. The tube was inserted in the bevel-up position into the anterior chamber. The scleral flap was sutured with 9-0 nylon, and a watertight conjunctival closure was performed. A topical corticosteroid, cycloplegic, and antibiotic were prescribed for approximately 1 month after surgery, though the length of prescription depended on the condition of the eye. If se- vere rubeosis was observed in the iris or anterior chamber angle before AGV implantation, anti-vascular endothelial growth factor (anti-VEGF) was injected intracamerally.
Follow-up examinations were performed 1 day, 1 week, 1 month, and 6 months after surgery and every 6 months thereafter. Additional visits were scheduled as needed.
Analysis
At each visit, IOP was measured by Goldmann applana- tion tonometry, and the attending physician noted whether IOP-lowering medication was being used. Any complica- tions were recorded. The surgery was considered a success if IOP was 6 to 21 mmHg, regardless of whether IOP-low- ering medication was being used, but without additional glaucoma surgery, AGV removal, or serious complications.
The following variables were compared between the
“success” and “failure” groups: pre-PPV diagnosis, pres- ence of diabetes mellitus (DM), glaucoma diagnosis before PPV, best-corrected visual acuity, presence of peripheral anterior synechiae greater than 180 degrees of the anterior chamber angle, presence of rubeosis at either the anterior chamber angle or iris before AGV implantation, lens status at AGV implantation, presence of SO, interval between PPV and AGV implantation, PPV before IOP, IOP 1 week after PPV, mean and peak IOP in the interval between PPV and AGV implantation, and duration of MTMT before AGV implantation. Variables related to the PPV procedure were also compared between groups, namely PPV opera- tion time, concurrent phacoemulsification, concurrent scleral buckling (segmental or encircling buckle), and vit- rectomy probe size (20G, 23G, and 25G). History of an- ti-VEGF injection or concurrent anti-VEGF injection at AGV implantation was also assessed. IOP was measured and compared 1 week, 1 month, and every 6 months after AGV implantation. The Kolmogorov-Smirnov test was used to test for the normality of numeric variables. To com- pare two normally distributed numerical variables, an un- paired t-test was used. Chi-squared tests were performed to
compare categorical data. Univariate and multivariate Cox proportional hazard modeling was conducted to determine which factors were associated with failed AGV implanta- tion. This modeling included the aforementioned putative factors as well as demographics. Variables with a p-value
<0.3 in univariate analyses were included in multivariate analyses. To ensure that highly correlated variables do not affect each other in multivariate analyses, only peak IOP values during each period (before PPV, PPV-AGV, and af- ter AGV) were included in the multivariate model. The same analyses were performed with subgroups that had rubeosis before AGV implantation (NVG group) and that underwent AGV implantation within 100 days after PPV (early AGV group). All statistical analyses were performed with IBM SPSS Statistics ver. 24.0 (IBM Corp., Armonk, NY, USA).
Results
A total of 146 eyes from 146 patients were included in the final analyses. This group included 105 men and 41 women; all were Asians (1 Indonesian and 145 Koreans).
The mean (± standard deviation) age at AGV implantation was 51.8 ± 14.9 years. The most common cause of PPV with subsequent AGV implantation was proliferative dia- betic retinopathy (PDR) that led to vitreous hemorrhage or traction retinal detachment (73 eyes, 50.0%) followed by rhegmatogenous retinal detachment (30 eyes, 20.5%). Trau- ma-related globe rupture and non-diabetic vitreous hemor-
rhage accounted for 8 and 10 cases, respectively (Table 1).
The mean IOPs before and 1 week after PPV were 16.1 ± 5.8 and 21.2 ± 9.0 mmHg, respectively. The mean and peak IOPs between PPV and AGV implantation were 26.9 ± 6.6 and 35.9 ± 10.2 mmHg, respectively. The mean duration of MTMT before AGV implantation was 4.1 ± 8.1 months.
The mean elapsed time between PPV and AGV implanta- tion was 18.7 ± 26.3 months. Among the 146 eyes, peripher- al anterior synechiae was observed in 65 (44.5%) and rubeosis in 71 (48.6%) before AGV implantation (Table 2).
The mean follow-up period after AGV implantation was 43.6 ± 23.1 months. Overall, 117 eyes (80.1%) were catego- rized as “successful” at last follow-up. The “failure” group consisted of 29 eyes: 23 of which had an IOP higher than 22 mmHg despite medical treatment and 6 had hypotony (IOP lower than 6 mmHg). Among the 29 eyes in the “failure”
group, 3 underwent additional AGV implantation. The
“success” and “failure” groups did not differ significantly in terms of age, sex, or IOP before, 1 week after, or 1 month after PPV. However, peak IOP before and 6 months after AGV were higher in the “failure” group (34.7 ± 9.7 vs. 40.8
± 10.6 mmHg, p = 0.003; 15.6 ± 4.4 vs. 22.8 ± 12.8 mmHg, p
< 0.007; respectively (Table 3). The DM prevalence was sig- nificantly greater in the “failure” group (79.3%) than in the
“success” group (52.1 %), and rubeosis was more common before AGV implantation in the “failure” group (75.9%) than in the “success” group (41.8%). No PPV-related factors were differed significantly between groups (Table 3).
Among the factors associated with failed AGV implanta- tion, univariate analyses revealed that the presence of DM, peak IOP between PPV and AGV implantation, and the presence of rubeosis were possibly associated. In multivar- iate analyses, rubeosis and peak IOP were predictive of surgical failure (hazard ratio [HR], 4.07; 95% confidence interval [CI], 1.57 to 10.56; p = 0.004; HR, 1.04; 95% CI, 1.00 to 1.07; p = 0.034; respectively) (Table 4). No PPV-proce- dure-related variables were associated with longitudinal outcomes after AGV implantation.
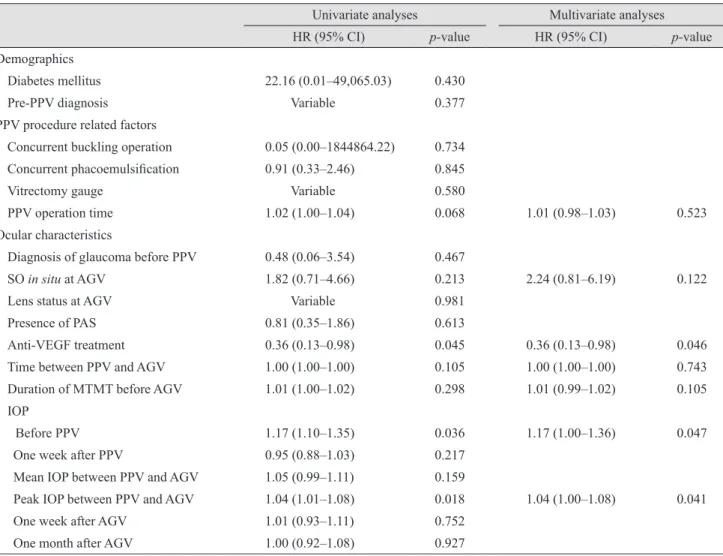
Subgroup analyses were performed for the 71 NVG eyes that had rubeosis before AGV implantation. Either pre- AGV intravitreal anti-VEGF injection or concurrent intra- cameral anti-VEGF injection at AGV implantation were more common in the “success” group than in the “failure”
group (93.9% [46 / 49] vs. 77.3% [17 / 22], p = 0.041). This result was confirmed in the Cox analysis showing that an- ti-VEGF injection was predictive of long-term success (HR, Table 1. Diagnoses of study subjects before pars plana vitrec-
tomy
Diagnosis No. (%)
VH/tractional RD (proliferative DR) 73 (50.0)
VH (non-DR) 10 (6.8)
Rhegmatogenous RD 30 (20.5)
Ruptured globe 8 (5.5)
Lens dislocation (crystalline / IOL) 1 (0.7) / 2 (1.4)
Noninfectious uveitis 7 (4.8)
Macular disease* 9 (6.2)
Endophthalmitis 1 (0.7)
Others 5 (3.4)
VH = vitreous hemorrhage; RD = retinal detachment; DR = dia- betic retinopathy; IOL = intraocular lens.
*Included epiretinal membrane and macular hole.
0.36; 95% CI, 0.13 to 0.98; p = 0.046) (Table 5). IOP before PPV and peak IOP before AGV were also associated with surgical failure in this subgroup (HR, 1.17; 95% CI, 1.00 to 1.36; p = 0.047; HR, 1.04; 95% CI, 1.00 to 1.08; p = 0.041;
respectively) (Table 5).
Additional subgroup analyses were performed for the 38 eyes that underwent AGV implantation within 100 days of PPV. The percentage of eyes with an initial diagnosis of Table 2. Demographics and clinical characteristics of the study patients
Value
Demographics
Age (yr) 51.8 ± 14.9
Sex (men / women) 105 (71.9) / 41 (28.1)
Diabetes mellitus 84 (57.5)
PPV-procedure-related factors
Concurrent buckling operation 12 (8.2)
Concurrent phacoemulsification 93 (63.7)
Vitrectomy gauge (23G / 25G / others) 67 (45.9) / 57 (39.0) / 22 (15.1)
PPV operation time (min) 81.2 ± 36.6
Ocular characteristics
Diagnosis of glaucoma before PPV 22 (15.1)
Presence of SO at AGV 30 (20.5)
Lens status at AGV (phakic / pseudophakic / aphakic) 14 (9.6) / 122 (83.6) / 10 (6.8)
Presence of PAS 65 (44.5)
Rubeosis 71 (48.6)
Anti-VEGF injection before AGV 69 (47.3)
Concurrent anti-VEGF injection 28 (19.2)
Time between PPV and AGV (mon) 18.7 ± 26.3
Duration of MTMT before AGV (mon) 4.1 ± 8.1
Mean follow-up time after AGV (mon) 43.6 ± 23.1
logMAR BCVA
Before PPV 1.24 ± 0.77
One month after PPV 1.44 ± 0.76
Before AGV 1.62 ± 0.82
After 1-month AGV 1.41 ± 0.85
IOP (mmHg)
Before PPV 16.1 ± 5.8
One week after PPV 21.2 ± 9.0
Mean IOP between PPV and AGV 26.9 ± 6.6
Peak IOP between PPV and AGV 35.9 ± 10.2
One week after AGV 11.4 ± 5.5
One month after AGV 17.4 ± 5.9
Six months after AGV 17.0 ± 7.4
One year after AGV 16.3 ± 7.2
Values are presented as mean ± standard deviation or number (%).
PPV = pars plana vitrectomy; SO = silicone oil; AGV = Ahmed glaucoma valve; PAS = peripheral anterior synechia; VEGF = vascular endothelial growth factor; MTMT = maximum-tolerated medical therapy; logMAR = logarithm of the minimum angle of resolution;
BCVA = best-corrected visual acuity; IOP = intraocular pressure.
ruptured globe or macular disease was 10.5% (4 / 38), but the percentage with DMR was similar to that for the total study population (47.4% vs 50.0%). Rubeosis and peak IOP between PPV and AGV were not significant factors for
failed AGV implantation, but PPV time, concurrent phaco- emulsification at PPV, and elapsed time between PPV and AGV showed a possible association. In multivariate analy- ses, however, only PPV time was statistically significantly Table 3. Comparison of “success” and “failure” groups after AGV implantation
Success group
(n = 117 eyes) Failure group
(n = 29 eyes) p-value
Demographics
Age (yr) 52.1 ± 15.5 50.8 ± 12.3 0.676
Sex (men / women) 85 (72.6) / 32 (27.4) 20 (69.0) / 9 (31.0) 0.712
Diabetes mellitus 61 (52.1) 23 (79.3) 0.008
PPV procedure related factors
Concurrent buckling operation 11 (9.4) 1 (3.4) 0.296
Concurrent phacoemulsification 71 (60.7) 22 (75.9) 0.128
Vitrectomy gauge (23G / 25G / 20G) 55 (47.0) / 46 (39.3) / 16 (13.7) 12 (41.4) / 11 (37.9) / 6 (20.7) 0.628
PPV operation time (min) 79.6 ± 36.4 87.6 ± 37.0 0.291
Ocular characteristics
Diagnosis of glaucoma before PPV 18 (15.4) 4 (13.8) 0.830
SO in situ at AGV 22 (18.8) 8 (27.6) 0.295
Lens status before AGV
0.453 (phakic / pseudophakic / phakic) 13 (11.1) / 96 (82.1) / 8 (6.8) 1 (3.4) / 26 (89.7) / 2 (6.9)
Presence of PAS 51 (43.6) 14 (48.3) 0.649
Rubeosis 49 (41.9) 22 (75.9) 0.004
Time between PPV and AGV (mon) 18.1 ± 24.5 21.0 ± 33.0 0.589
Duration of MTMT before AGV (mon) 3.9 ± 6.9 5.0 ± 11.7 0.534
Mean follow-up time after AGV (mon) 43.7 ± 22.7 43.0 ± 24.9 0.873
logMAR BCVA
Before PPV 1.23 ± 0.79 1.32 ± 0.70 0.550
One month after PPV 1.39 ± 0.77 1.63 ± 0.73 0.141
Before AGV 1.59 ± 0.82 1.73 ± 0.84 0.414
One month after AGV 1.34 ± 0.83 1.69 ± 0.87 0.044
IOP (mmHg)
Before PPV 16.0 ± 6.2 16.6 ± 4.0 0.649
One week after PPV 21.6 ± 9.4 19.7 ± 7.3 0.313
Mean IOP between PPV and AGV 26.6 ± 6.7 28.3 ± 6.4 0.194
Peak IOP between PPV and AGV 34.7 ± 9.7 40.8 ± 10.6 0.003
One week after AGV 11.3 ± 5.5 11.6 ± 5.4 0.842
One month after AGV 17.2 ± 5.6 18.4 ± 6.9 0.322
Six months after AGV 15.6 ± 4.4 22.8 ± 12.8 0.007
One year after AGV 14.5 ± 3.4 24.0 ± 12.3 <0.001
Values are presented as mean ± standard deviation or number (%).
AGV = Ahmed glaucoma valve; PPV = pars plana vitrectomy; SO = silicone oil; PAS = peripheral anterior synechia; MTMT = maxi- mum-tolerated medical therapy; logMAR = logarithm of the minimum angle of resolution; BCVA = best-corrected visual acuity; IOP = intraocular pressure.
associated with the long-term success of AGV implantation (HR, 1.03; 95% CI, 1.01 to 1.06; p = 0.007), and elapsed time between PPV and AGV showed a marginal association (HR, 1.02; 95% CI, 1.00 to 1.05; p = 0.052) (Table 6).
Discussion
Among eyes that had previously undergone PPV and had intractably elevated IOP despite MTMT, the overall suc- cess rate of AGV implantation was 80.1% during a mean follow-up period of 3.6 years. The mean IOP 1 year after AGV implantation was 16.3 ± 7.2 mmHg. These results are comparable to those of AGV implantation in general re- fractory glaucoma [2]. Taken together with previous find-
ings, our data suggest that AGV implantation provides good surgical outcomes in eyes that have previously under- gone PPV [12-15].
Eyes that had elevated IOP after PPV did not have high IOP before PPV (mean, 16.1 ± 5.8 mmHg). Nonetheless, 1 week after PPV, mean IOP increased to 21.2 ± 9.0 mmHg, which means that the majority of eyes that required AGV implantation had mild IOP elevation soon after PPV. Mean- while, factors related to surgical procedure, such as a con- current buckling procedure, different vitrectomy gauges, and PPV operation time, did not differ significantly between the “success” and “failure” groups. A similar result was found in Cox proportional hazard analysis, showing that no procedure-related factors were significant associated with outcomes of AGV implantation. In summary, the “failure”
Table 4. Cox proportional hazard modeling for factors associated with failure of AGV implantation
Univariate analyses Multivariate analyses
HR (95% CI) p-value HR (95% CI) p-value
Demographics
Diabetes mellitus 3.01 (1.24–7.50) 0.015 1.76 (0.35–8.84) 0.492
Pre-PPV diagnosis Variable 0.737
PPV procedure related factors
Concurrent buckling operation 0.37 (0.05–2.68) 0.322
Concurrent phacoemulsification 1.92 (0.82–4.50) 0.132 1.31 (0.50–3.43) 0.583
Vitrectomy gauge Variable 0.627
PPV operation time 1.01 (1.00–1.01) 0.285 1.01 (1.00–1.02) 0.053
Ocular characteristics
Diagnosis of glaucoma before PPV 0.91 (0.32–2.60) 0.856
SO in situ at AGV 1.60 (0.70–3.60) 0.262 1.21 (0.50–2.92) 0.672
Lens status at AGV Variable 0.472
Presence of PAS 1.18 (0.57–2.43) 0.665
Rubeosis 3.64 (1.55–8.51) 0.003 4.07 (1.57–10.56) 0.004
Time between PPV and AGV 1.00 (1.00–1.00) 0.582
Duration of MTMT before AGV 1.00 (0.99–1.01) 0.504 IOP
Before PPV 1.01 (0.96–1.07) 0.669
One week after PPV 0.98 (0.93–1.03) 0.352
Mean IOP between PPV and AGV 1.04 (0.99–1.09) 0.171
Peak IOP between PPV and AGV 1.05 (1.02–1.08) 0.004 1.04 (1.00–1.07) 0.034
One week after AGV 1.01 (0.94–1.07) 0.849
One month after AGV 1.04 (0.98–1.10) 0.250 1.03 (0.96–1.10) 0.367
AGV = Ahmed glaucoma valve; HR = hazard ratio; CI = confidence interval; PPV = pars plana vitrectomy; SO = silicone oil; PAS =pe- ripheral anterior synechia; MTMT = maximum-tolerated medical therapy; IOP = intraocular pressure.
group did not differ from the “success” group in terms of the PPV procedure. This finding may have resulted from the variable time intervals between PPV and AGV implantation (18.7 ± 26.3 months). Patients who underwent AGV implan- tation a long time after PPV may have been less affected by PPV procedures. Hence, we performed a subgroup analysis of participants who underwent AGV implantation less than 100 days after PPV. The subgroup analysis found somewhat different results than the overall data showing that a longer PPV operation time was a significant risk factor for surgical failure. Hence, patients who underwent early AGV implan- tation soon after PPV may have been affected by the PPV procedure, but this subgroup had a small number of patients (38 patients) and further study is needed.
The most common cause of PPV with subsequent AGV
implantation was PDR. The prevalence of both DM and ru- beosis were significantly greater in the “failure” group than in the “success” group. Such eyes are prone to NVG due to ischemic insult, thus may also have intractably elevated IOP after PPV [16]. In a Cox proportional hazard analysis, the univariate result showed that both factors were associ- ated with surgical failure. In multivariate analyses, both rubeosis and peak IOP between PPV and AGV were corre- lated with surgical failure. Considering that most patients with rubeosis receive PPV as a consequence of PDR, if ru- beosis occurs after surgery in patients with DM, the likeli- hood of treatment failing due to NVG is high. Recently, in- traocular injection of anti-VEGF has been to treat retinal ischemia. Intravitreal anti-VEGF injection in NVG patients could improve the prognosis of AGV implantation [17-20].
Table 5. Cox proportional hazard modeling to analyze factors associated with failure of AGV implantation (n = 71) Univariate analyses Multivariate analyses
HR (95% CI) p-value HR (95% CI) p-value
Demographics
Diabetes mellitus 22.16 (0.01–49,065.03) 0.430
Pre-PPV diagnosis Variable 0.377
PPV procedure related factors
Concurrent buckling operation 0.05 (0.00–1844864.22) 0.734 Concurrent phacoemulsification 0.91 (0.33–2.46) 0.845
Vitrectomy gauge Variable 0.580
PPV operation time 1.02 (1.00–1.04) 0.068 1.01 (0.98–1.03) 0.523
Ocular characteristics
Diagnosis of glaucoma before PPV 0.48 (0.06–3.54) 0.467
SO in situ at AGV 1.82 (0.71–4.66) 0.213 2.24 (0.81–6.19) 0.122
Lens status at AGV Variable 0.981
Presence of PAS 0.81 (0.35–1.86) 0.613
Anti-VEGF treatment 0.36 (0.13–0.98) 0.045 0.36 (0.13–0.98) 0.046
Time between PPV and AGV 1.00 (1.00–1.00) 0.105 1.00 (1.00–1.00) 0.743
Duration of MTMT before AGV 1.01 (1.00–1.02) 0.298 1.01 (0.99–1.02) 0.105
IOP
Before PPV 1.17 (1.10–1.35) 0.036 1.17 (1.00–1.36) 0.047
One week after PPV 0.95 (0.88–1.03) 0.217
Mean IOP between PPV and AGV 1.05 (0.99–1.11) 0.159
Peak IOP between PPV and AGV 1.04 (1.01–1.08) 0.018 1.04 (1.00–1.08) 0.041
One week after AGV 1.01 (0.93–1.11) 0.752
One month after AGV 1.00 (0.92–1.08) 0.927
AGV = Ahmed glaucoma valve; HR = hazard ratio; CI = confidence interval; PPV = pars plana vitrectomy; SO = silicone oil; PAS = peripher- al anterior synechia; VEGF = vascular endothelial growth factor; MTMT = maximum-tolerated medical therapy; IOP = intraocular pressure.
Our subgroup analysis of NVG patients also found that pre-AGV or concurrent intracameral anti-VEFG injection was predictive of surgical success. Intracameral anti-VEGF injection at the same time as AGV implantation may be an option for patients with severe rubeosis.
The presence of SO at AGV implantation was not a risk factor for surgical failure in this study. However, evidence on whether the presence of SO is a risk factor for surgical failure in AGV implantation is conflicting [14,15,21]. Ishida et al. [14] reported that AGV implantation can control IOP in a majority of eyes after PPV and SO injection. However, they found that the presence of SO was associated with in- creased risk of surgical failure in eyes treated with AGV.
Likewise, Park et al. [15] reported that intraocular SO tam-
ponade is a risk factor for failure of AGV implantation.
However, their study, in contrast to ours, only included NVG after PPV. Meanwhile, Al-Jazzaf et al. [21] reported that SO-filled eyes that have not responded to medical ther- apy can be effectively managed by implanting a glauco- ma-drainage device in an inferior quadrant.
Several limitations of our study should be noted. Since it was not prospectively designed and most of the participants were of a single ethnicity, the results should be interpreted with caution. We performed subgroup analyses of eyes that underwent AGV implantation shortly after PPV, and the results differed from the overall population showing that PPV time affected the outcome of AGV implantation. This result may suggest that longer PPV times are predictive of Table 6. Cox proportional hazard modeling to analyze factors associated with failure of AGV implantation within 100 days of PPV (n = 38)
Univariate analyses Multivariate analyses
HR (95% CI) p-value HR (95% CI) p-value
Demographics
Diabetes mellitus 1.11 (0.30–4.13) 0.879
Pre-PPV diagnosis Variable 0.966
PPV procedure related factors
Concurrent buckling operation 0.05 (0.00–6364.75) 0.508
Concurrent phacoemulsification 6.44 (0.81–51.48) 0.079 3.61 (0.44–29.79) 0.234
Vitrectomy gauge Variable 0.835
PPV operation time 1.03 (1.01–1.05) 0.005 1.03 (1.01–1.06) 0.007
Ocular characteristics
Diagnosis of glaucoma before PPV 0.69 (0.14–3.35) 0.650
SO in situ at AGV 1.54 (0.41–5.76) 0.519
Lens status at AGV Variable 0.940
Presence of PAS 1.01 (0.25–4.03) 0.992
Rubeosis 2.35 (0.63–6.77) 0.202 0.65 (0.11–3.91) 0.634
Time between PPV and AGV 1.02 (1.00–1.05) 0.049 1.02 (1.00–1.05) 0.052
Duration of MTMT before AGV 1.09 (0.88–1.34) 0.434 IOP
Before PPV 1.00 (0.92–1.08) 0.916
One week after PPV 0.97 (0.92–1.03) 0.354
Mean IOP between PPV and AGV 1.02 (0.93–1.11) 0.697
Peak IOP between PPV and AGV 1.04 (0.97–1.11) 0.259 1.09 (0.98–1.20) 0.106
One week after AGV 1.04 (0.91–1.20) 0.540
One month after AGV 1.04 (0.93–1.15) 0.505
AGV = Ahmed glaucoma valve; PPV = pars plana vitrectomy; HR = hazard ratio; CI = confidence interval; SO = silicone oil; PAS = pe- ripheral anterior synechia; MTMT = maximum-tolerated medical therapy; IOP = intraocular pressure.
poor surgical outcomes in early AGV implantation; howev- er, it should be duplicated with a larger sample size.
In summary, AGV implantation was successful in pa- tients who had intractably elevated IOP after PPV in gener- al. The development of rubeosis after PPV and a high peak IOP before AGV were predictive of surgical failure.
PPV-procedure-related variables were not associated with long-term outcomes of AGV implantation.
Conflict of Interest
No potential conflict of interest relevant to this article was reported.
Acknowledgements
This study was supported by the Basic Science Research Program through the National Research Foundation of Ko- rea (NRF), which is funded by the Ministry of Education, Science, and Technology (NRF-2014R1A1A3A04051089).
References
1. Coleman AL, Hill R, Wilson MR, et al. Initial clinical ex- perience with the Ahmed glaucoma valve implant. Am J Ophthalmol 1995;120:23-31.
2. Souza C, Tran DH, Loman J, et al. Long-term outcomes of Ahmed glaucoma valve implantation in refractory glauco- mas. Am J Ophthalmol 2007;144:893-900.
3. Christakis PG, Tsai JC, Kalenak JW, et al. The Ahmed ver- sus Baerveldt study: three-year treatment outcomes. Oph- thalmology 2013;120:2232-40.
4. Lee JY, Sung KR, Tchah HW, et al. Clinical outcomes after combined Ahmed glaucoma valve implantation and pen- etrating keratoplasty or pars plana vitrectomy. Korean J Ophthalmol 2012;26:432-7.
5. Nguyen QH, Lloyd MA, Heuer DK, et al. Incidence and management of glaucoma after intravitreal silicone oil in- jection for complicated retinal detachments. Ophthalmology 1992;99:1520-6.
6. Broadway DC, Chang LP. Trabeculectomy, risk factors for failure and the preoperative state of the conjunctiva. J Glau- coma 2001;10:237-49.
7. Takihara Y, Inatani M, Fukushima M, et al. Trabeculectomy with mitomycin C for neovascular glaucoma: prognostic factors for surgical failure. Am J Ophthalmol 2009;147:912-8.
8. Han DP, Lewis H, Lambrou FH Jr, et al. Mechanisms of intraocular pressure elevation after pars plana vitrectomy.
Ophthalmology 1989;96:1357-62.
9. Honavar SG, Goyal M, Majji AB, et al. Glaucoma after pars plana vitrectomy and silicone oil injection for complicated retinal detachments. Ophthalmology 1999;106:169-76.
10. Aaberg TM, Van Horn DL. Late complications of pars plana vitreous surgery. Ophthalmology 1978;85:126-40.
11. Won HJ, Sung KR. Hypertensive phase following silicone plate ahmed glaucoma valve implantation. J Glaucoma 2016;25:e313-7.
12. Hong JW, Choi GJ. Ahmed valve implantation for refrac- tory glaucoma following pars plana vitrectomy. Korean J Ophthalmol 2005;19:293-6.
13. Sidoti PA, Dunphy TR, Baerveldt G, et al. Experience with the Baerveldt glaucoma implant in treating neovascular glaucoma. Ophthalmology 1995;102:1107-18.
14. Ishida K, Ahmed II, Netland PA. Ahmed glaucoma valve surgical outcomes in eyes with and without silicone oil en- dotamponade. J Glaucoma 2009;18:325-30.
15. Park UC, Park KH, Kim DM, Yu HG. Ahmed glaucoma valve implantation for neovascular glaucoma after vitrec- tomy for proliferative diabetic retinopathy. J Glaucoma 2011;20:433-8.
16. Summanen P. Neovascular glaucoma following vitrecto- my for diabetic eye disease. Acta Ophthalmol (Copenh) 1988;66:110-6.
17. Andreoli CM, Miller JW. Anti-vascular endothelial growth factor therapy for ocular neovascular disease. Curr Opin Ophthalmol 2007;18:502-8.
18. Moraczewski AL, Lee RK, Palmberg PF, et al. Outcomes of treatment of neovascular glaucoma with intravitreal bevaci- zumab. Br J Ophthalmol 2009;93:589-93.
19. Wakabayashi T, Oshima Y, Sakaguchi H, et al. Intravitreal bevacizumab to treat iris neovascularization and neovascu- lar glaucoma secondary to ischemic retinal diseases in 41 consecutive cases. Ophthalmology 2008;115:1571-80.
20. Kwon J, Sung KR. Effect of preoperative intravitreal beva- cizumab on the surgical outcome of neovascular glaucoma at different stages. J Ophthalmol 2017;2017:7672485.
21. Al-Jazzaf AM, Netland PA, Charles S. Incidence and man- agement of elevated intraocular pressure after silicone oil injection. J Glaucoma 2005;14:40-6.