Study on an Image Reconstruction Algorithm for 3D Cartilage OCT Images (A Preliminary Study)
Dong-Su Ho*
†, Ee-Hwa Kim*, Yong-Min Kim*, Beop-Min Kim
‡*The Clinical Trial Center for Bio-Industry at Semyung University, Jecheon,
†
Department of Biomedical Engineering, Yonsei University, Wonju,
‡
Department of Biomedical Engineering, Korea University, Seoul, Korea
Recently, optical coherence tomography (OCT) has demonstrated considerable promise for the noninvasive assessment of biological tissues. However, OCT images difficult to analyze due to speckle noise. In this paper, we tested various image processing techniques for speckle removal of human and rabbit cartilage OCT images.
Also, we distinguished the images which get with methods of image segmentation for OCT images, and found the most suitable method for segmenting an image. And, we selected image segmentation suitable for OCT before image reconstruction. OCT was a weak point to system design and image processing. It was a limit owing to measure small a distance and depth size. So, good edge matching algorithms are important for image reconstruction. This paper presents such an algorithm, the chamfer matching algorithm. It is made of background for 3D image reconstruction. The purpose of this paper is to describe good image processing techniques for speckle removal, image segmentation, and the 3D reconstruction of cartilage OCT images.
Key Words: Optical coherence tomography, Image segmentation, Image reconstruction
This work was supported by a grant from the Ministry of Knowledge Economy of the Republic of Korea (RIC-07-06-01).
Submitted April 27, 2009, Accepted June 5, 2009
Corresponding Author: Dong-Su Ho, The Clinical Trial Center for Bio-Industry, Semyung University, 579, Shinwol-dong, Jecheon 390- 711, Korea
Tel: 043)653-6303, Fax: 043)653-6302 E-mail: [email protected]
INTRODUCTION
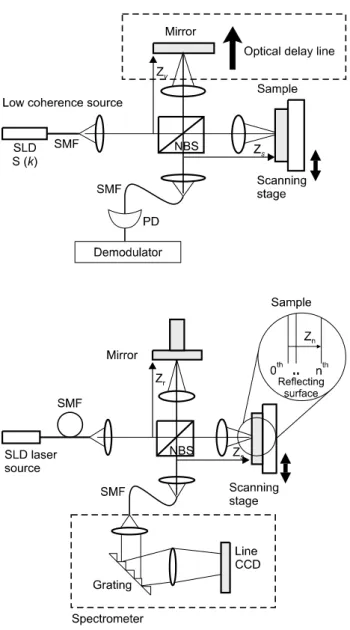
Optical coherence tomography (OCT) is capable of produc- ing a high resolution, high sensitivity reflectivity profile of a sample using a low coherence interferometric technique. OCT has a high data acquisition rate, near video speed. It is a non- invasive imaging technique that provides microscopic tomo- graphic sectioning of biological samples. An OCT image (B-scan) is built up as a series of adjacent axial depth scans (A-scans). The depth is gated by low coherence interferometry, where the sample is placed in one arm of a Michelson inter- ferometer (sample arm) and a scanning optical delay line is lo- cated in the other arm (reference arm).
1)Fig. 1 shows the ba- sic OCT and S-D (spectral domain) OCT system used in this study. A superluminescent diode (SLD) with a center wave-
length of 841 nm and a full width at half maximum band- width of 45 nm was used as the low coherent light source.
We chose 135 mA to be the optimal input current of the SLD, at which the output power exiting the single-mode optical fiber pigtail was 5.5 mW. Light from the SLD was split by a beam splitter and delivered into the reference and sample arms. The combined back-reflected sample light Is and the reference light Er in the Michelson interferometer were detected by a linear charge coupled device (CCD) array. We assumed that the sam- ple was composed of n scattering thin plates with the normal- ized intensity reflection Rn for the n-th scatter at the depth po- sition Zn. Zn was the distance between the beam splitter and the n-th scatter. The light intensity incident on each element of the CCD through the grating was proportional to the spectral intensity I(k).
I k ( ) = Ir k ( ) + Is k ( )
2( )[1 2 n mcos2 ( n m) 2 ncos 2 ( n r)]
n m n
S k R R k z z R k z z
≠
= +
∑
− +∑
−(1)
Where k is the wavenumber for the light and Zr is the path-length between the beam splitter and reference mirror.
The first term on the right hand side of Eq. (1) is the spec-
Fig. 1. OCT and SD (spectral domain)-OCT setup. The com-
ponents of the system are: a superluminescent diode source (SLD), single mode fiber (SMF).trum of the light source. The second and third terms include the interference terms that were produced by the combination of light from each scatter of the sample itself and by the com- bination of light from the sample scatter and reference mirror.
Recently, optical coherence tomography has demonstrated con- siderable promise for the assessment of articular cartilage (Herrmann et al. 1999).
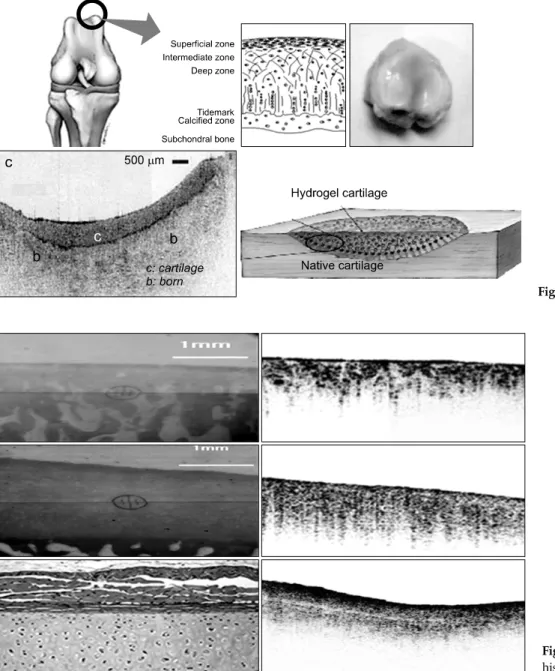
2)The width of the cartilage is an im- portant indication of the degree of osteoarthritis. As in any other imaging modality, OCT images are affected by different existing sources of random or structured noise. While the
elimination of random white noise is achievable by matched filters, discarding the colored noise in a signal or image poses many difficulties. Fig. 2 shows human joint structure. Cartilage is become accomplished with hydrogel and native cartilage.
Osteoarthritis is the progressive loss of joint cartilage or carti- lage degradation. Based on a number of therapeutics studies, it is possible to reverse the cartilage degradation. However, an examination of the change in cartilage thickness is of partic- ular importance in the clinical treatment of osteoarthritris. The small thickness of the cartilage and important submicron changes in its thickness necessitate an imaging modality capa- ble of high resolution. Cartilage is a tough, semi transparent, elastic, flexible connective tissue consisting of cartilage cells (chondrocytes and chondroblasts) scattered through a lip- oprotein material strengthened by collagen fibers. The exterior of cartilage is covered by a dense fibrous membrane called the perichondrium. There are no nerves or blood vessels in carti- lage, and when damaged it does not heal readily. Cartilage has several functions. It covers the surface of joints, allowing bones to slide over one another, thus reducing friction and preventing damage; it also acts as a shock absorber. It forms part of the structure of the skeleton in the ribs, where it joins them to the breastbone (sternum). Cartilage is found in the tip of the nose, in the external ear, and in the walls of the wind- pipe (trachea) and voice box (larynx), where it provides sup- port and shape. The skeleton of an embryo is formed of carti- lage, which is gradually replaced by bone as the embryo grows.
Cartilage is known as elastic cartilage, fibrocartilage, or hya- line cartilage, depending on its different physical properties.
Elastic cartilage is strong, containing proteins called elastin
and collagen embedded in the ground substance. The elastin
gives it a distinctive yellow color. Elastic cartilage makes up
the springy part of the outer ear, and also forms the epiglottis
(a flap of tissue attached at the front that prevents food from
entering the airway). Fibrocartilage contains large amounts of
collagen, making it both resilient and able to withstand
compression. It is found between the bones of the spinal col-
umn, and in the hip and pelvis. Hyaline cartilage is a tissue
that contains collagen fibers. It forms the skeleton in an em-
bryo and remains as a thin layer on the ends of bones that
form joints. It also forms the end of the nose, and the stiff
Fig. 2. Human joint structure.
Fig. 3. Human, rabbit cartilage
histology and OCT images.rings around the windpipe. It is found on the ends of the ribs and supports the larynx. Human and rabbit cartilage images were obtained postmortem. Fig. 3 shows the OCT cartilage used in our system. OCT speckle noise occurs when light from a coherent source illuminates scatters separated by dis- tances near that of the coherence length of the source. It is signal dependant and carries information about the tissue being imaged.
3,4)Before MRI was available, DOT (diffuse optical to- mography) and CT were used for medical imaging. While these were fully capable of discerning bone and muscle, they
could not be used for delicate imaging, such as for cartilage and ligaments. So our lab obtained images of rabbit and hu- man cartilages and analyzed their structure.
5)These were ob- tained by applying an adaptive speckle suppression filter, called restating kernel transformation, to the OCT images.
OCT was a weak point to system design and image pro- cessing. It was a limit owing to measure small a distance and depth size.
The goal of this research most is to develop image process-
ing where is suitable from OCT.
MATERIALS AND METHODS
1. Acquisition of cartilage OCT images
The OCT cartilage image was placed on a stage and scan- ned in the x-z plane. It was imaged with 841 nm diode source that had an axial resolution of 10μm. The dynamic range of the system was 115 dB.
2. OCT image processing techniques
Several techniques for automated edge enhancement and de- tection were evaluated. Image processing operations were ap- plied for speckle removal, edge detection, and segmentation.
After the speckle removal, the borders between the cartilage and bone, and cartilage and air, were detected with a vertical gradient and Sobel edge detection filter. The aim of image en- hancement is to improve the interpretability or perception of information in images for human viewers, or to provide better input for other automated image processing techniques. Image segmentation was performed using thresholding and a region growing algorithm. One of the noise removal techniques was image smoothing using a mean or median filter. With a mean filter, the value of each pixel is replaced by the average of all the pixel values in a local neighborhood. With a median filter, the value of each pixel is replaced by a median value calcu- lated in a local neighborhood. While smoothing out small tex- tural variations, median smoothing, unlike smoothing with a mean filter, does not shift boundaries. However, it can round off corners. A hybrid median overcomes this limitation by ranking the pixels separately as a function of direction and combining the results.
6)3. ROI establishment and function coordinate
Since it is not separated through image segmentation, artifi- cial division is required to abstract the human body-dynamics structure from the image. To accomplish this, we created a program with a function for setting the ROI (region of inter- est). Generally, an ROI function allows users to select a region of interest in an image using a polygon. It is used when image processing or other work needs to be done in the region of interest. Also, we used ROI establishment before image processing. We established that users can make most approach
original region when them make curving region or add curving region, transform standard region to Bezier curve and first di- vide interesting region with hand. Region dividing is estab- lished user to set up first directly approximately and then to adjust with action of semi-auto method (Here, semi-auto meth- od is region dividing algorithm, and fix up previous adjusted region to origin outline by slow). But this region separation is not perfect so we reworked for most approach. Image segmen- tation is one of the most widely used steps in the process of reducing an image to useful information. Many techniques are available to deal with image segmentation problems.
7-9)4. OCT image registration algorithm
1) Development of OCT image registration program:
Matching is a key problem in digital image analysis, and edges are perhaps the most important low-level image feature.
We developed a program tool that can realize two image reg- istration techniques, using chamfer matching and mutual information. The chamfer matching technique was developed by Barrow et al. (1977) and has been widely used as an in- telligent pattern-matching algorithm. The mutual information technique is a volume-based registration method, and was de- rived for use with a communication channel. The scale factor was calculated using the voxel size information before the matching process, and six transform parameters (rotation in x, y, z and translation in x, y, z) were considered in this study.
The registration tool was designed considering the accuracy
and effectiveness of the registration process. For practical uses
in clinical cases, the BMP and JPEG formats are available in
the developed program. In this paper, we registrated basic
OCT image and S-D (Spectral Domain) OCT image. So, we
obtained good image reconstructed. An option allows the user
to choose the registration method, and the registered image is
displayed in an overlay, with control of the transparency.
10,11)2) Chamfer matching algorithm: Chamfer matching is a
technique for finding the best fit for the edge points from two
different images, by minimizing the generalized distance be-
tween them. It is a low level feature based method, in which
edge points or low level feature points are extracted from digi-
tal images (using any suitable edge extraction scheme) and
converted to binary images that are distance transformed, and
then a distance transform is used for matching. A template
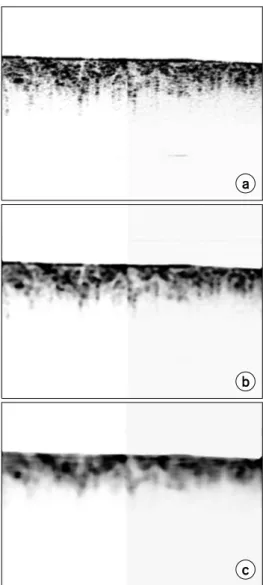
Fig. 4. The results of the rotating kernel transformation filter with
kernels: (a) source image (b) 11×11, (c) 20×20 pixels - human cartilage images.Fig. 5. The results of the rotating kernel transformation filter
with kernels: (a) source image (b) 11×11, (c) 20×20 pixels - rabbit cartilage images.transform is superimposed on the distance transform of the model, values are subtracted pixel wise, and matching is found by minimizing the rms average.
12)Given the two point sets U = { } u
i in=1and V = { } v
j jm=1, the
chamfer distance function is the mean of the distances between each point, u
i∈ U and its closest point in V
( , ) 1 min
i
cham i j
u u
d u v u v
n
∈= ∑ − . (2)
The symmetric chamfer distance is obtained by adding
( , )
d
chamv u . The chamfer distance between two shapes can be efficiency computed using a distance transform. This trans- formation takes a binary feature image as its input, and as- signs to each pixel in the image the distance to its nearest feature. The distance between a template and an edge map can then be computed as the mean of the distance transform values at the template point coordinates. The matching can be made more robust by using the mean of the threshold distance
, ( , ) 1 max(min , )
i
cham i j
u u
d u v u v
τ
n τ
∈
= ∑ − , (3)
where τ is the threshold value. This reduces the effect of
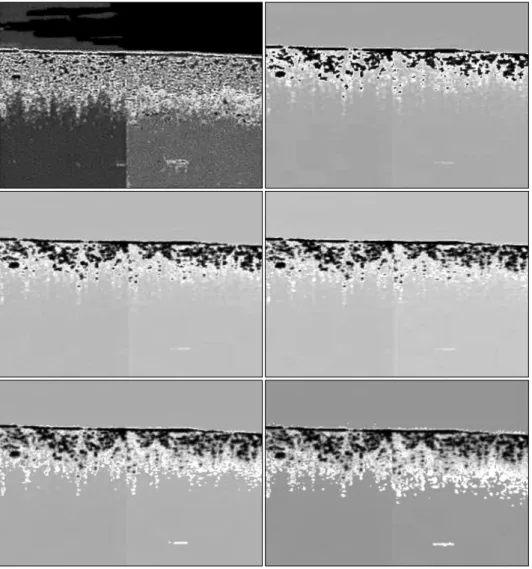
Fig. 6. The results of the image
segmentation for human cartilage OCT images.outliers and missing edges.
13)RESULTS
In the image processing, mean, median, and hybrid median techniques were used with several kernel sizes, varying from 11×11 to 20×20 pixels. As the kernel size increased, the speckle in the image blurred and the edges were less visible.
Fig. 4. and 5 shows the results of the speckle removal techni- ques using the median and hybrid median filters with pixels of 256×256. The OCT images were also processed using the ro- tating kernel transformation filter with several kernel sizes varying from 11×11 to 20×20. Fig. 4 presents the results of the human cartilage image processing and Fig. 5 presents those for the rabbit cartilage image processing. Post image
processing is important. It reduced raw data losses which are possible and remove a noise for 3D image optimization. When hybrid median filter used, will be able to remove a more noise, but if filter kernel size will become larger and there is a weak point will be able to lose a data.
1. Image segmentation results
Prior to the implementation of this algorithm on the three,
the largest image that was segmented with this hybrid image
segmentation algorithm was OCT image. To demonstrate the
effectiveness of the hybrid image segmentation algorithm in
selecting important region features from image data, it would
be best to show several images illustrating segmentations at
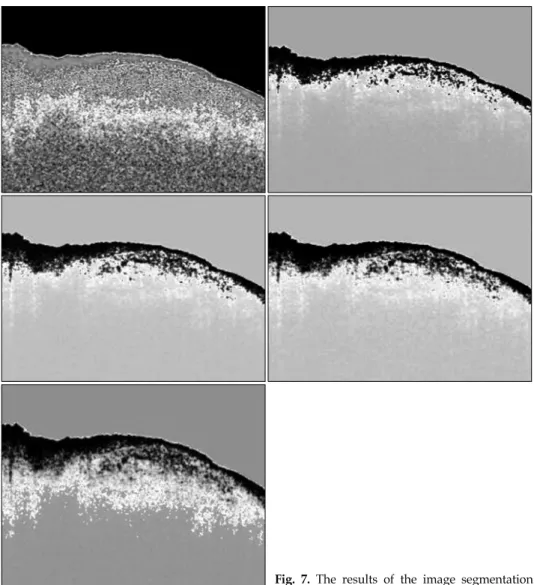
several levels of detail. Fig. 6 shows the results of the auto
image segmentation for human cartilage OCT images. The
Fig. 7. The results of the image segmentation for rabbit cartilage OCT images.
threshold values for these were 48, 80, 100, 150, and 230. Fig.
7 shows the results of the auto image segmentation for rabbit cartilage OCT images. The threshold values were 48, 100, 150, and 230. The threshold values of optimization. The best of threshold values is 230. When above of it ascends and the noise comes to be many, when gets off a price below that and the data is lost.
14)2. Image matching results
This section presents the experimental results for evaluating the efficiency of the proposed chamfer matching algorithm. All of the experiments were implemented on a personal computer with a Pentium IV, 2 GHz processor. The Sobel operator was applied to the images for edge detection. After finding the
OCT image, templates were matched to the reference as per the matching measurements. Results were simulated in the stu- dent version of IDL 5.5. It took about 98 seconds to produce the match, including about 57 seconds of distance trans- formation computation time. Fig. 8 and 9 show that the tem- plate was matched to the reference. Only the translational pa- rameter was used for matching. Fig. 8 and 9 are combined the various image which makes 3D images.
15)3. Image reconstruction
Using the point correspondencies obtained in the previous
step, the fundamental matrix could be calculated.
16)To im-
prove the result, an iterative process was implemented that de-
tects weak point correspondencies and excludes them from the
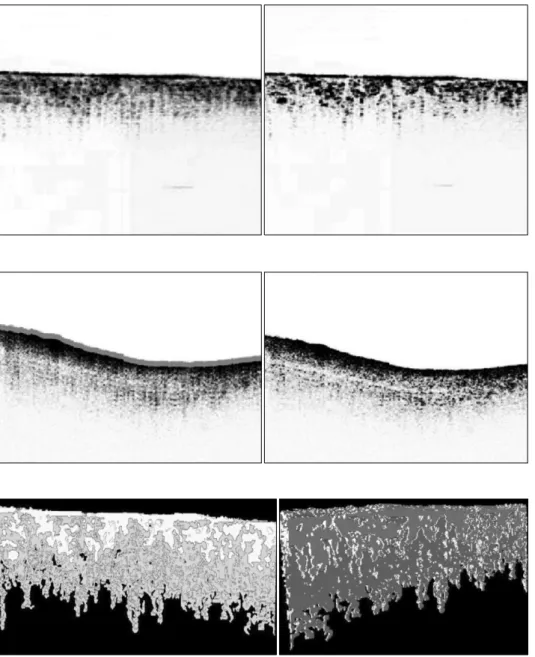
Fig. 8. The results before and
after image matching for the human cartilage OCT image.Fig. 9. The results before and
after image matching for the rabbit cartilage OCT image.Fig. 10. The results of the 3D
image reconstruction for the human cartilage OCT images.calculation. Furthermore, special geometric cases were taken into consideration.
17)Fig. 10 shows the results of the 3D im- age reconstruction for human cartilage OCT images. Fig. 11 shows the results of the reconstruction for the rabbit cartilage OCT images.
DISCUSSION
In this study, we used OCT images to observe the structure of human and rabbit cartilages. Before MRI was available, CT scans were used for medical imaging. While these were fully
capable of discerning bone and muscle, they could not be used
for delicate imaging, such as for cartilage and ligaments. So
we obtained rabbit and human cartilage images structure in
Fig. 3, Fig. 10, and Fig. 11. We also tried numerous image
segmentation algorithms to determine the ideal method for seg-
menting the needed parts. This image segmentation worked
well to divide the part that we wanted. The algorithm employs
an edge detection method, thresholding method, region grow-
ing method, and watershed method. We used both an edge de-
tection algorithm method and a thresholding algorithm method
and segmented human and rabbit cartilage images. The algo-
Fig. 11. The results of the 3D image reconstruction for the
rabbit cartilage OCT images.rithm program is a rapid, robust, vote requiring tuning parame- ters, easy to use segmentation method. It is applicable to a wide range of images. However, it is semiautomated because it requires the manual selection of seed regions. Actually, over- coming order dependencies are important when numerous small seed regions exist on relatively small images.
Also, we tried to match the data information before 3D imaging. There are many methods for an image registration al- gorithm, but we used a chamfer matching algorithm method and could register data for the same region. Medical diagnosis can benefit from the complementary information from different imaging methods. Multi-modal image registration and fusion is an essential task in numerous 3D medical image-processing applications. Registered images provide greater correlative in- formation to aid in diagnosis and assist with the planning and monitoring of surgery and radiotherapy. An automatic image registration method was presented in this paper. The proposed system includes pre-processing, 2D segmentation, 3D registra- tion, fusion, and rendering sub-systems for multi-modal OCT images.
CONCLUSION
We analyzed features in human and rabbit cartilage images in a comparison of several image division methods to abstract the part that we were interested in. We knew that using a method with more than two algorithms would be more effec- tive for segmentation than the commonly used method for the human and rabbit cartilage images. In this study, we per-
formed image segmentation using a region growing method and a thresholding method algorithm. Also, we prepared a foundation for the composition of 3-D images by using a chamfer matching algorithm to match images. We thus ob- tained the possibility of reconstituting a 3D image by improv- ing on the method used for the OCT images.
REFERENCES
1. Huang D, Swanson EA, Fujimoto JG, et al: Optical coher- ence tomography. Science 253:1178 (1991)
2. Kim J, Soh KS, Ho DS, Kim BM: Real spectral-domain op- tical coherence tomography using a superluminescent diode.
JKPS 47:375-379 (2005)
3. Saxer CE, de Boer JF, Park BH, Zhao Y, Chen Z, Nelson JS: Real-time multi-functional optical coherence to- mography. Opt Lett 25:1355 (2000)
4. Pierce MC, Strasswimmer J, Park BH, Cense B, de Boer JF: Fiber-based polarization-sensitive fourier domain optical coherence tomography using B-scan-oriented polar- ization modulation method. J Biomed Opt 9:287 (2004) 5. Ho DS, Kim BM, Shin K, Hwang ID: Evaluation of a chip
LED sensor module at 770 nm for fat thickness measurement of optical tissue phantoms and human body tissue. JKPS 51:1663-1667 (2007)
6. Rogowska J, Brezinski M: Image processing techniques for noise removal, enhancement and segmentation of cartilage OCT images. Phys Med Biol 47:641-655 (2002)
7. Gao H, Siu W, Hou C: Improved techniques for automatic image segmentation, IEEE trans. CSVT 11:1273-1280 (2001) 8. Tobias OJ, Seara R, Soares FAP: Automatic image seg-
mentation using fuzzy sets. Proceedings of the 38th Midwest Symposium on Circuits and Systems 2:921-924 (1995) 9. Eom SG, Chang SC, Ahn BH: Watershed-based region
merging using conflicting regions, Proceedings 2002 International Conference on Image Processing 2:II781-784 (2002)
10. Abdelsayed S, Ionescu D, Goodenough D: Matching and registration method for remote sensing images, Proceedings of the international geoscience and remote sensing symposium IGARSS’95, Florence, Italy, 1029-1031 (1995)
11. Alhichri HS, Kamel M: Virtual circles: a new set of features for fast image registration. P.A.Lett 24:1181-1190 (2003)
3차원 연골 광간섭 단층촬영 이미지들에 대한 영상 재구성 알고리듬 연구
*세명대학교 한방바이오산업 임상지원센터,
†연세대학교 의공학과,
‡고려대학교 의공학과
호동수*
†ㆍ김이화*ㆍ김용민*ㆍ김법민
‡최근에 광간섭 단층촬영은 생물학적 조직을 비 침습적으로 이미지를 얻는데 많이 사용되고 있다. 그러나, 광간섭 단층촬 영은 노이즈 때문에 해석하는데 아직까지는 어려움을 갖고 있다. 본 논문에서는 인체와 토끼의 연골 이미지들의 이미지 에서 잡음을 제거하는 다양한 영상처리 기술을 적용해 보았다. 또한 광간섭 단층촬영으로 얻은 이미지들을 영상 분할 방법을 통해 얻고자 하는 부위를 구별 하였으며 대부분의 이미지들이 영상분할 알고리즘에 적합함을 볼 수 있었다. 그리 고, 광간섭 단층영상에 적합한 영상분할 방법을 선택한 후 영상을 재구성 하였다. 광간섭 단층촬영은 작은 깊이와 거리 에 제한을 가지고 있기 때문에 영상처리장치에 단점을 가지고 있다. 광간섭 이미지가 매우 작은 공간에서 이루어 짐으로 같은 지역의 영상을 재구성 하기는 어려운 점이 있다. 그래서, 광간섭 단층영상 재구성을 할 때 좋은 매칭 알고리즘 방 법이 필요하다. 본 논문에서는 챔퍼 매칭 알고리즘을 사용하여 재구성 하였다. 본 연구에서는 OCT 연골 이미지를 얻어 노이즈 제거, 영상 분할, 3D 광간섭 단층 영상을 재구성 할 수 있었다.
중심 단어: 광간섭단층촬영장치, 영상분할, 영상재구성
12. Cheung KW, Yeung DY, Chin RT: A bayesian frameworkfor deformable pattern recognition with application to handwritten character recognition. IEEE Transactions on Pattern Analysis and Machine Intelligence 20:1382-1388 (1998)
13. Borgefors G: An improved version of the chamfer matching algorithm, In 7th Int. Conf, Pattern Recognition, Montreal, P.Q., Canada, 1175-1177 (1984)
14. Ho DS, Lee HK, Suh TS: Feature extraction and image seg- mentation of mechanical structures from human medical images.
Korean Journal of Medical Physics 15:112-119 (2004)
15. Song JY, Nah BS, Suh TS: The application of chanfer matching algorithm to the reeor analysis of a treatment field be- tween a cimulation image and a portal image. Korean Journal of Medical Physics 14:189-195 (2003)
16. Hartley R, Zisserman A: Multiple view geometry in computer vision, Cambridge University Press (2000)
17. Torr PHS: Motion segmentation and outlier detection, PhD Thesis, Department of Engineering Science, University of Oxford, Hilary Term (1995)