Analysis of BRD Components Over Major Land Types of Korea
Sang-Il Kim*, Kyung-Soo Han*†, Soo-Jea Park*, Kyoung-Jin Pi*, In-Hwan Kim*, Min-Ji Lee*, Sun-Gu Lee**, and Young-Sik Chun**
*Dept. of Geoinformatic Engineering, Pukyung National University, Daeyeon-3 Nam-Gu, Busan 608-737, Korea
**Satellite Operations & Application Division, Satellite Information Research Institute (SIRI), Korea Aerospace Research Institute (KARI)
Abstract :The land surface reflectance is a key parameter influencing the climate near the surface.
Therefore, it must be determined with sufficient accuracy for climate change research. In particular, the characteristics of the bidirectional reflectance distribution function (BRDF) when using earth observation system (EOS) are important for normalizing the reflected solar radiation from the earth’s surface. Also, wide swath satellites like SPOT/VGT (VEGETATION) permit sufficient angular sampling, but high resolution satellites are impossible to obtain sufficient angular sampling over a pixel during short period because of their narrow swath scanning. This gives a difficulty to BRDF model based reflectance normalization of high resolution satellites. The principal objective of the study is to add BRDF modeling of high resolution satellites and to supply insufficient angular sampling through identifying BRDF components from SPOT/VGT. This study is performed as the preliminary data for apply to high-resolution satellite. The study provides surface parameters by eliminating BRD effect when calculated biophysical index of plant by BRDF model. We use semi-empirical BRDF model to identify the BRD components. This study uses SPOT/VGT satellite data acquired in the S1 (daily) data. Modeled reflectance values show a good agreement with measured reflectance values from SPOT satellite. This study analyzes BRD effect components by using the NDVI (Normalized Difference Vegetation Index) and the angle components such as solar zenith angle, satellite zenith angle and relative azimuth angle. Geometric scattering kernel mainly depends on the azimuth angle variation and volumetric scattering kernel is less dependent on the azimuth angle variation. Also, forest from land cover shows the wider distribution of value than cropland, overall tendency is similar. Forest shows relatively larger value of geometric term (K1·f1) than cropland, When performed comparison between cropland and forest. Angle and NDVI value are closely related.
Key Words :
EOS, SPOT/VGT, BRDF, geometric scattering, volumetric scattering.Received November 18, 2010; Accepted December 14, 2010.
†Corresponding Author: Kyung-Soo Han ([email protected])
1. Introduction
For the last 3 decades, the greening period of vegetation in spring has been moved back caused by global warming. In addition, global warming with large spatial scale has been implicit on potentiality after the 21
stcentury could influence (IPCC, 2007) on climate system. This global climate change is undergoing and it is important to exactly understand form and status of surface for monitoring climate change. Consequently, knowledge of the phenology of plant communities is relevant to estimate biological productivity, understanding land- atmosphere interactions and biome dynamics, modeling vegetative inputs into biogeochemical cycles, as well as for the management of vegetation resources (Tarpley et., 1984; Justice et al., 1985). The sun-target-sensor geometry effects inherent in optical satellite measurements are a potential source of biophysical information about terrestrial ecosystems.
To realize this potential, it is necessary to obtain s sufficient number of satellite measurements with a range of sun-target-sensor geometries while the target remains unchanged. The effects of this variation are corrected by applying the Bidirectional Reflectance Distribution Function (BRDF), which is a function that is based on viewing and illumination geometrics.
The BRDF effects can be seen in satellite data having a wide swath. Especially, wide-swath satellite has anisotropy effects that can cause serious error in estimations of solar radiation parameters such as reflectance, albedo, vegetation indices and insolation.
The BRDF can be used to correct reflectance to the reflectance at nadir (Kimes et al., 1985; Roujean et
al., 1992). Therefore, the BRDF is one of the mostimportant factors to consider when utilizing satellite data and deriving biophysical information from the ground surface (Chopping., 2000; Wanner &
Strahler., 1995). Also, this model has been optimized
to base on the wide-swath satellite to provide sufficient angular sampling for a short time. There are several kinds of BRDF models, mainly utilizing physical (Gao., 1993), semi-empirical (Roujean et al., 1992) and empirical (Walthall et al., 1985) methods to estimate standard sun-target-sensor geometry. In order to correct the surface anisotropy effects, this paper attempted the semi- empirical kernel-driven BRDF model of Roujean. However, in case of high resolution satellite is difficult to obtain sufficient angular sampling unlike wide swath satellite.
Detected change at local scale or management of national territory need for technology development that is normalized reflectance method of high- resolution satellite. The calculated reflectance values by BRDF model can provide the reflectance property.
To supply insufficient angular samplings, this study is to add BRDF modeling of high resolution satellites through identifying BRDF components by extracting geometric and volumetric term. Therefore, we can exactly understand bi-direction effect of surface reflectance that plays an important role to moisture of surface and energy balance. Also, this study performed as the preliminary data for apply to high-resolution satellite. The study can provide exact surface parameters through eliminated BRD effect when calculated biophysical index of plant by BRDF model.
2. Data and study area
We used data remotely sensed by S1 (daily) data of
SPOT/VGT. Detailed information on SPOT/VGT
sensor is presented in Table 1. This is synthesis data
of band collected during 24 hours. The study area is a
section of Korea between 32.5˚ and 40.0˚N and
124.5˚ and 130.0˚E from 1 January to 31 December
2006. S1 data of SPOT/VGT has a variety of
products and spatial resolution of 1km. It is optimized
for vegetation observation to one of the representative polar-orbiting satellites. Besides the band, S1 product includes angle data of satellite/sun, composite time, NDVI (Normalized Difference Vegetation Index) and SM (Status Map) data. SM data provides clear, shadow, uncertain and cloud condition to each pixel.
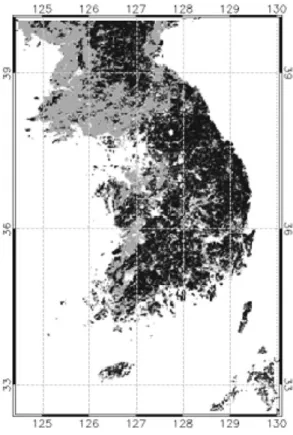
When was clear pixel, the study was performed. Land cover classification map used MODIS Global Land Cover 1km data (Fig. 1). To adjust regional and
temporal inconsistencies, we established study area of cropland and forest through unsupervised classification of SPOT/VGT S10 NDVI data. S10 data has a 1km spatial resolution at nadir. In this study, the provided S10 NDVI data at S10 used MVC (Maximum Value Composite) method. The MVC method considers the maximum value assumed by the NDVI in a time period as a good estimate of the entire period. The MVC procedure, as referred to earlier, requires that a series of multi-temporal geo- referenced satellite data be processed into NDVI images. On a pixel-by-pixel basis, each NDVI value is examined, and only the highest value is retained for each pixel location. A final MVC image is produced after all pixels have been evaluated (Holben, 1986).
NDVI is the most widely used vegetation index in order to uncover biological characteristics of vegetation canopy (Jiang et al., 2006). NDVI is a useful index to monitoring growth of the vegetation cover. NDVI can calculate RED channel (B2) and NIR channel (B3) using the reflectance difference of maximum surface vegetation chlorophyll. Therefore, this study was performed to use B2 and B3 band that is useful for monitoring in growth of vegetation cover.
3. Methods
1) BRDF model
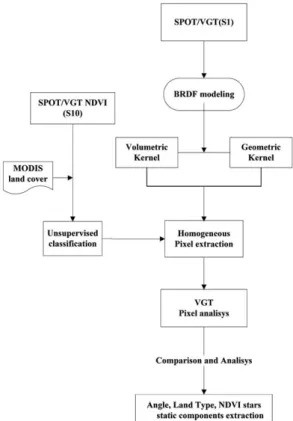
The overall research method shows in Fig. 2.
Table 1. Characteristics of SPOT VEGETATION sensor
Orbit Type Sun-synchronous
Altitude =820km
Repetitiveness =12hours
Channel B0(blue) B2(red) B3(NIR) MIR(SWIR)
Wavelength 0.43~0.47 0.61~0.68 0.78~0.89 1.58~1.75
Resolution at Nadir (km) 1.0×1.0 1.0×1.0 1.0×1.0 1.0×1.0
NIR: Near-InfraRed channel, IR: InfraRed channel, SWIR: Short Wave InfraRed Orbit Type
Altitude Repetitiveness
Channel Wavelength Resolution at Nadir (km)
Fig. 1. MODIS land cover map of the study area delineated in grey color (cropland) and black color (forest).
Procedure for correction the angle effects of surface depend on the BRDF. In addition, it is essential to estimate accurate reflectance through BRDF. In particular, Kernel-driven semi-empirical models can solve complex relationships to be in estimating BRDF. We used the method developed by Roujean, Leroy, and Deschamps (1992), considered to be the
basic form for semi-empirical BRDF models, to simulate the BRDF parameters:
r(q
s, q
v, f) = K
0+ K
1f1(q
s, q
v, f) + K
2f2(q
s, q
v, f) (1)
f1(q
s, q
v, f) = [(p
_f)cosq + sinf]
×tanq
stanq
v_[ tanq
s+ tanq
v(2)
+ tan
2q
s+ tan
2q
v+ 2tanq
stanq
vcosf ]
f2
(q
s, q
v, f) =
× [( _x ) cosx + sinx ]_ (3)
(3)
cosx = cosq
scosq
v+ sinq
ssinq
vcosf (4)
where r denotes the reflectance in a given spectral channel. The f
1and f
2are two angular kernels that depend on the solar zenith angle q
s, the viewing satellite zenith angle q
v, and the relative azimuth angle f between the sun and view directions. The term k0 stands for the Lambertian coefficient of the model isotropic component. The two other terms K
1and K
2are coefficients indicative of the relative contributions of f
1and f
2, which represent, respectively, the geometric and the volume scattering effects. The three coefficients are retrieved for each channel on a pixel-per-pixel basis adjusting the model of Eq. (1) against VGT measurements in a less square sense. In practice, it is necessary to select extended
1 3 p
2 1 cosq
s+ cosq
s4
3p
1 p 1
2p
Fig. 2. Flow chart for the overall data processing of the study.
Fig. 3. The schema of method for the retrieval of normalized reflectance by using determined time window with synthetic use SPOT/VGT.
temporal windows around a period during which land properties are stationary in order to get at least four cloud-free scenes. We consider sets of observations comprised within a 30-day period to retrieve the model coefficients. The results are assigned to the date centred on the 30-day period. The process is repeated with sliding periods of 10 days delineating the composite frame in order to enhance the temporal sampling (Fig. 3). The method was proven to be efficient with time series of AVHRR data (Csiszar et
al., 2001; Leroy & Roujean, 1994), which provides asimilar angular resolution to VGT (Duchemin &
Maisongrande, 2002). Note that the surface BRDF correction is not achieved under turbid conditions for sky illumination.
2) Sample pixel using unsupervised classification
This study set cropland and forest area, through unsupervised classification of S10 NDVI data. It may be detailed method as follows. In order to generate classified a multi-temporal image products generated using each of these image fusion techniques, an unsupervised classification procedure using the K- means clustering algorithm was widely used. The techniques aforementioned in the previous section are using an unsupervised procedure based on the K- means clustering algorithm (Hartigan and Wong, 1979). The examination carries on the clusters generated from the spectral characteristics of the normalized imagery (Jensen, 1995). In this way, each cluster is statistically separable. This method uses minimum distance criteria and resembles the k-
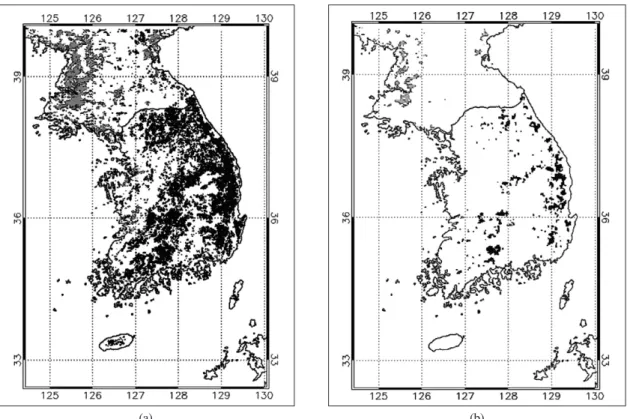
Fig. 4. Result of filtering black clored points are selected pixel on forest and grey clored points are selected pixel on cropland; (a) unsupervised classification over the study area; (b) Sample pixel over the study area.
(a) (b)
nearest-neighbour rule method. The requirement for clusters classification by distance functions is that the pattern classes tend to have clustering properties. The k-means algorithm is based on the minimization of a performance index, which is defined as the sum of the squared distances from all points in a cluster domain to the cluster center, a Euclidian distance. K- means clustering allocates each pixel to one of k groups or clusters to minimize the within-cluster sum of square. In this case, the total sums of squares, within each cluster is computed as the sum of the centered sum of squares over all non-missing values of each of the variable. Then, the labeling of cluster was carried out considering prior knowledge and the confusion matrix with MODIS global land cover database. First step distributed 17 clusters considering a number of classes of MODIS Global Land Cover.
Fig. 4 is cropland and forest of correspond class. This study in order to adjust temporal or spatial inconsistency of S1 and S10 data extracted sample pixel of correspond area, if all 5×5 pixel would satisfy 25 pixel when is cropland or forest (Fig. 4(b)).
We solved temporal or spatial inconsistency over the study area.
4. Results and analysis
1) BRDF model analysis
K
0is isotropic component as normalized reflectance on semi-empirical BRDF model of Eq.1.
Also, the surface reflectance may then be view as a combination of two different components representative of these two different bidirectional signatures (Roujean et al., 1992). First is component of diffuse reflection by material surface, of reflectance geometric (K
1·f
1) term, which takes into account the geometrical structure of opaque reflectors
and showing effects. Second is a components of volume scattering, of reflectance volumetric term (K
2·f
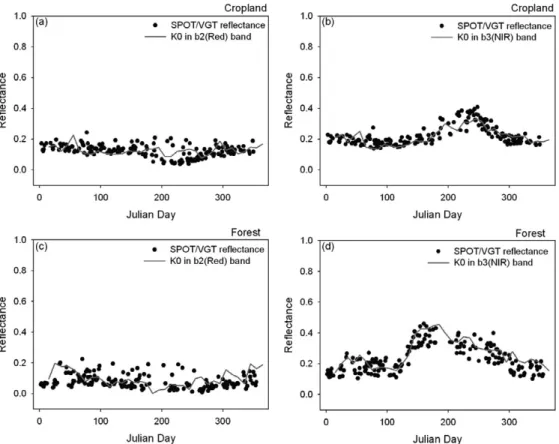
2), where the medium is modeled as a collection of randomly located facets absorbing and scattering radiation. Fig. 5 shows a scatter plot of measured and modeled reflectance from 1 January to 31 December 2006 over study area. The red line represents isotropic component (K
0) from the semi- empirical model, whereas the scattered dots show individual values of observed reflectance from the SPOT/VGT visible (red) and NIR channel data.
When BRD effects are not eliminated, reflectance is scattered randomly over the year. It is difficult to determine the representative temporal variation without consulting other information and it is difficult to classify reflectance characteristic of surface changing according to the season. Because the values of geometric (K
1·f
1) and volumetric term (K
2·f
2) are not so great the influence of K
0, K
0represents with the isotropic reflectance value of Lambertian surface. Especially when is cropland, measured reflectance value and isotropic component value by model did correspond to tendency (Fig. 5(a),(b)), and fig. 5 (c),(d) had a generally similar tendency. The geometric (K
1·f
1) and volumetric term (K
2·f
2) occupied a part of the isotropic component value (K
0). Also, it known effect of geometric (K
1·f
1) and volumetric term (K
2·f
2) to be greater when is forest than cropland. However, measured reflectance value and isotropic component value was known to be quantitatively match.
2) Sensitivity analysis for solar zenith angle
As mentioned earlier, wide-swath satellite needs multiple observation values, in order to obtain K
0, K
1, K
2, corresponding same point during the short period.
In this study, normalized reflectance during a 30-day
window at 10-day composite frame was calculated by
Fig. 5. The scatter plot of time series of measured reflectance from 1 January to 31 December 2006; line is K0
reflectance by SPOT/VGT from determined BRDF model; (a) b2 band in cropland; (b) b3 band in cropland; (c) b2 band in forest; (d) b3 band in forest.
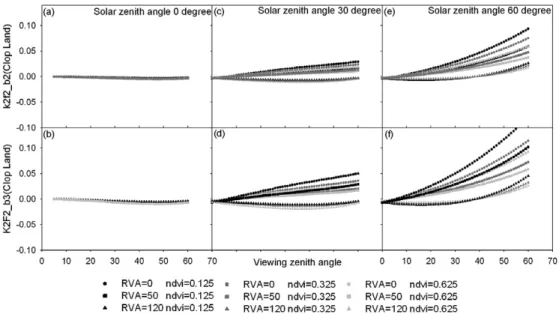
Fig. 6. The viewing zenith angle and geometric term (k1·f1) analysis according to the NDVI for (a)-(b) fixed solar zenith angle 0˚, (c)-(d) fixed solar zenith angle 30˚ and (e)-(f) fixed solar zenith angle 60˚ in cropland: (a), (c), (e) b2 band of the geometric term (k1·f1); (b), (d), (f) b3 band of the geometric term (k1·f1).
each of channel, we produced 36 data. The f
1, f
2kernels calculated using the Eq. 2 and Eq. 3. Finally, we estimated geometric (K
1·f
1) and volumetric term (K
2·f
2). Fig. 6 analyzed sensitivity of solar zenith angle according to geometric term (K
1·f
1).
Solar zenith angle fixed 3 angles (0˚, 30˚, 60˚) and NDVI value (0.125, 0.325, 0.625) and relative azimuth angle (0, 50, 120) set up the fixed values.
This study analyzed about B2 and B3 band in cropland. Fig. 6 should not relatively have too much effect about relative azimuth angle. Especially, Fig.
6(a)-(b) in solar zenith angle 0˚ was not at all impact for relative azimuth angle. But relative azimuth angle effects, as solar zenith angle increase, have an effect on geometric term (K
1·f
1). As NDVI increase, slope of geometric term (K
1·f
1) shows an increasing tendency. Such as Fig. 6, Fig. 7 analyzed sensitivity of solar zenith angle according to volumetric term (K
2·f
2). It is divided by fixed 3 Solar zenith angles, we analyzed B2 and B3 band according to the NDVI value. Fig. 7 was not affected about the relative
azimuth. As solar zenith angle increase than Fig. 6, the effect of relative azimuth angle and NDVI values was relatively low. To difference distribution according to the sample angles, because the geometric scattering kernels (f
1) are governed by the emergence and disappearance of shadows in a discrete opaque canopy, with reflectance decreasing as the sensor direction moves away from the solar direction. The volume scattering kernels (f
2), on the other hand, are governed by the phase or scattering angle and the homogeneous medium composed of randomly distributed scattering plane facets, leading to increased reflectance as the zenith angle increases (Roujean et al., 1992; Wanner et al., 1995). As shown in Fig. 6 and Fig. 7, whereas enhancement of f
1depends on the azimuth angle, f
2is less dependent on the azimuth angle.
3) Sensitivity analysis for viewing zenith angle
Solar zenith angle distributes the range of 0˚~5˚
Fig. 7. The viewing zenith angle and volumetric term (k2·f2) analysis according to the NDVI for (a)-(b) fixed solar zenith angle 0˚, (c)-(d) fixed solar zenith angle 30˚ and (e)-(f) fixed solar zenith angle 60˚ in cropland: (a), (c), (e) b2 band of the volumetric term (k2·f2); (b), (d), (f) b3 band of the volumetric term (k2·f2).
because high resolution satellite is difficult to obtain sufficient angular sampling in short time as time series. To apply future this study such as Fig. 6 and Fig. 7, we performed analysis that is solar zenith angle, geometric (K
1·f
1) and volumetric term (K·
f
1) when observed nadir on the static part according to the NDVI change. In addition, it was not considered effect about relative azimuth angle. Fig. 8 and Fig. 9 using the fixed viewing zenith angle (VZA=0˚) appeared geometric (K
1· f
1) and volumetric term (K
2·f
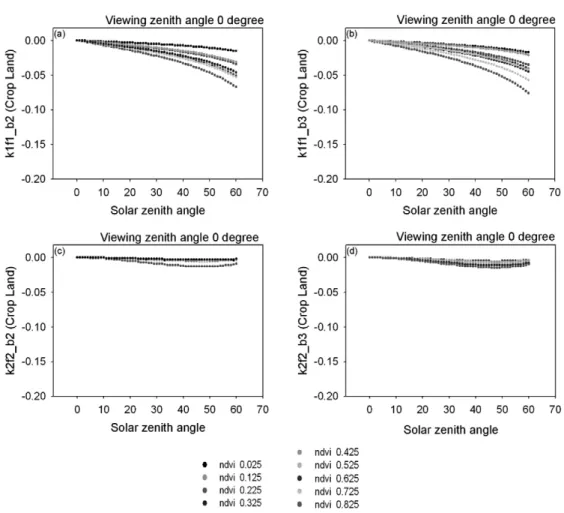
2) changes about solar zenith angle, NDVI changes. Fig. 8(a)-(b) shows decreasing tendency about solar zenith angle and geometric term
(K
1·f
1) according to the NDVI increase, slope was increased. The difference of bands did not show a clear tendency. Volumetric term (K
2·f
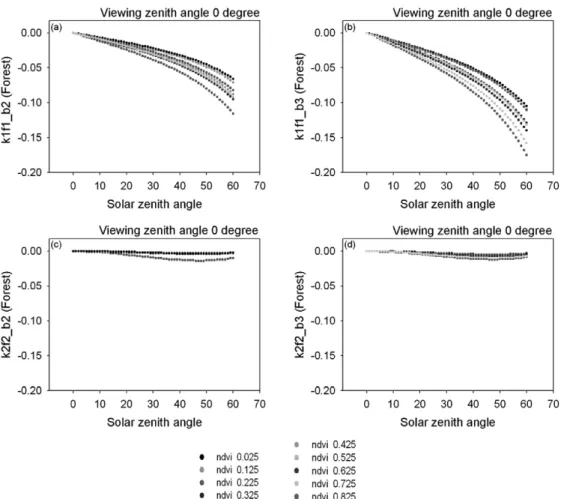
2) was constantly decreased until 50˚(solar zenith angle) in Fig. 8(c)-(d) after it showed increasing tendency. B3 band (Fig. 8(d)) appeared a more variety of value distribution than B2 band (Fig. 8(c)). The forest showed the wider distribution of value than cropland (Fig. 9). It was similar overall tendency. When was carried out comparison by land type, forest showed relatively larger value of geometric term (K
1·f
1) than cropland (Fig. 9). In other words, it was shown close relation about angle and NDVI value. Fig. 10
Fig. 8. Kernel analysis for fixed viewing zenith angle 0˚ in cropland: (a) b2 band of the geometric term (k1·f1); (b) b3 band of the geometric term (k1·f1); (c) b2 band of the volumetric term (k2·f2); (d) b3 band of the volumetric term (k2·f2).
Fig. 9. Kernel analysis for fixed viewing zenith angle 0˚ in forest: (a) b2 band of the geometric term (k1·f1); (b) b3 band of the geometric term (k1·f1); (c) b2 band of the volumetric term (k2·f2); (d) b3 band of the volumetric term (k2·f2).
Fig. 10. NDVI based on geometric scattering value (k1), volumetric scattering value (k2) of the Band (B2, B3) by the coefficient of reflection: (a) Cropland area; (b) Forest area.