Estimating Leaf Area Index of Paddy Rice from RapidEye Imagery to Assess Evapotranspiration in Korean Paddy Fields
Sang‐Il Na, Suk Young Hong*, Yi‐Hyun Kim, Kyoung‐Do Lee, and So‐Young Jang Soil and Fertilizer Management Division, NAAS, RDA, Suwon, 441‐707, South Korea
(Received: August 7 2013, Accepted: August 16 2013)
Leaf area index (LAI) is important in explaining the ability of crops to intercept solar energy for biomass production, amount of plant transpiration, and in understanding the impact of crop management practices on crop growth. This paper describes a procedure for estimating LAI as a function of image‐derived vegetation indices from temporal series of RapidEye imagery obtained from 2010 to 2012 using empirical models in a rice plain in Seosan, Chungcheongnam‐do. Rice plants were sampled every two weeks to investigate LAI, fresh and dry biomass from late May to early October. RapidEye images were taken from June to September every year and corrected geometrically and atmospherically to calculate normalized difference vegetation index (NDVI). Linear, exponential, and expolinear models were developed to relate temporal satellite NDVIs to measured LAI. The expolinear model provided more accurate results to predict LAI than linear or exponential models based on root mean square error. The LAI distribution was in strong agreement with the field measurements in terms of geographical variation and relative numerical values when RapidEye imagery was applied to expolinear model. The spatial trend of LAI corresponded with the variation in the vegetation growth condition.
Key words: Rice growth, LAI, RapidEye, NDVI, Seosan
LAI estimation models using RapidEye NDVI values.
Model Type Equation R2 RMSE
Linear LAI=6.978×NDVI-0.734 0.824 0.721
Exponential LAI=0.156×Exp(4.695×NDVI) 0.754 0.947
Expolinear LAI=(0.108×NDVI-0.009)×(1+38.859×Exp(0.667×NDVI)) 0.837 0.692
1)
*Corresponding author : Phone: +82312900344, Fax: +85312900208, E-mail: [email protected]
§Acknowledgement: This work was supported by National Academy of Agricultural Science, Rural Development Administration (PJ009367022013) in Republic of Korea.
Fig. 1. Location of research sites in Seosan, Chungcheon- gnam-do, South Korea.
Introduction
Many methods have been used to estimate evapotrans- piration (ET) while it is still challenge to assess. Evapotrans- piration in regions with complicated topographies and variable land use (Shin et al. 2006). The ET from ground surface is a process affected by a number of factors including vegetation, radiation, air temperature, humidity, wind, soil moisture and so on. Vegetation is regarded as a crucial factor to determine ET because over 80% of terrestrial ET occurs in vegetated areas. Vegetation condition does not only influence transpiration but also affect evapor- ation through a variety of processes such as light interce- ption by canopy. Indices of plant growth, therefore, have been often used to estimate ET.
Leaf area index (LAI) is a well‐known indicator of plant growth. LAI was introduced by Watson (1947) for the first time and defined as the ratio of leaf area to a given unit of land area. The ratio is functionally correlated to spectral reflec- tance (Kim et al. 2012). LAI is an important structural parameter of vegetation canopies, which is crucial for modeling canopy interception, ET, and net photosynthesis. In addition, LAI is a key biophysical parameter in most land‐
surface models, governing partitioning of energy, carbon, and water fluxes between the soil and canopy components of the land‐surface system (Gower et al. 1999). Therefore, ET and surface behavior can be highly sensitive to LAI inputs, necessitating development of accurate methods for high‐
quality LAI retrieval. The measurement of LAI on the ground, however, requires a great amount of time and efforts (Lee et al. 2006).
Remote sensing provides the most feasible alternative for the estimation or monitoring of LAI at regional scales (Stenberg et al., 2004). Vegetation canopy is composed of leaves, which is a direct source of the energy-matter interactions that can be observed by earth‐observing remote sensing system. Therefore, LAI has been a very attractive variable of interest in vegetative remote sensing. In recent years, there has been considerable interest in developing algorithms for retrieving LAI from remotely sensed observ- ations (Qin et al., 2008). Many efforts have been made to assess LAI with its statistical relationship with spectral vegetation indices (VIs), physical model inversion or other nonparametric methods. The technique of optical remote sensing provides a simple, precise and non‐destructive way to retrieve LAI from regional to global scales; however, results of the inversion models always have large uncertainties (Na et al., 2010). There are primarily two approaches to estimate vegetation parameters such as LAI. One approach is to establish an empirical relationship between VIs and LAI. The other one is to use bidirectional reflectance distribution function (BRDF) models. It inverts a BRDF model with
radiometric measurements to estimate LAI using an optimi- zation procedure (Qi et al., 2007). Though both approaches have their own advantages and limitations, the former are widely used compared to the latter one as the former one gives a benefit of simple computation (Price and Bausch, 1995).
Models developed for application to remotely sensed optical data rely on physically based relationships between LAI and canopy spectral reflectance, typically expressed in the form of spectral vegetation indices, such as the norma- lized difference vegetation index (NDVI). The NDVI is one of the most widely used vegetation indices for retrieval of vegetation canopy biophysical properties and its utility in satellite assessment and monitoring of global vegetation cover has been well demonstrated over the past two decades (Huete and Liu, 1994; Leprieur et al., 2000). But it was criticized for the following reasons: 1) differences between the ‘true’ NDVI, as would be measured at the surface, and that actually determined from space are sensitive to atten- uation by the atmosphere and by aerosols, 2) the sensitivity of NDVI to LAI becomes increasingly weak with increasing LAI beyond a threshold, which is typically between 2 and 3, and 3) variations in soil brightness may produce large variations in NDVI from an image to the next. Thus, many researchers commit themselves to solving the problems (Na et al., 2010). The objective of this study is to estimate LAI as a function of image‐derived NDVI from temporal series of RapidEye satellite data using empirical models and field data from Korean paddy fields.
Materials and Methods
Monitoring sites and LAI field measurements The three monitoring sites were located in Seosan (126°28'15"E, 36°57'45"N) in Chungcheongnam‐do, South Korea: f1767,
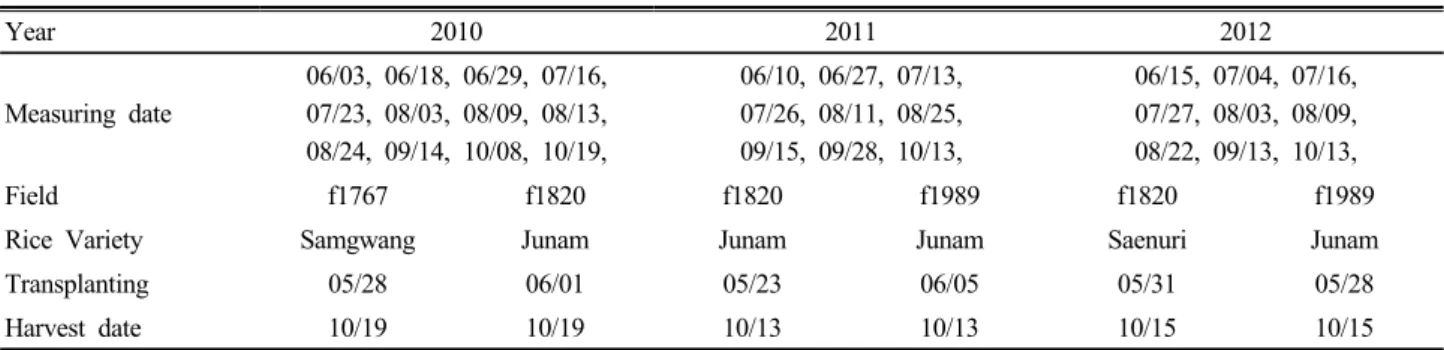
Table 1. Measuring dates of leaf area index in fields and basic information of research sites.
Year 2010 2011 2012
Measuring date
06/03, 06/18, 06/29, 07/16, 07/23, 08/03, 08/09, 08/13, 08/24, 09/14, 10/08, 10/19,
06/10, 06/27, 07/13, 07/26, 08/11, 08/25, 09/15, 09/28, 10/13,
06/15, 07/04, 07/16, 07/27, 08/03, 08/09, 08/22, 09/13, 10/13,
Field f1767 f1820 f1820 f1989 f1820 f1989
Rice Variety Samgwang Junam Junam Junam Saenuri Junam
Transplanting 05/28 06/01 05/23 06/05 05/31 05/28
Harvest date 10/19 10/19 10/13 10/13 10/15 10/15
Table 2. Data‐collecting dates of RapidEye image data from 2010 to 2012.
Year 2010 2011 2012
Date 06/01, 06/23, 07/27,
08/08, 09/18
07/04, 08/31, 09/06, 09/23, 09/25
06/14, 06/21, 08/05, 08/06, 09/24, 10/02
f1820, and f1989(Fig. 1). The sites were located within 1 km diameter of each other. Seosan has four distinct seasons. In spring, mild temperatures are accompanied with strong winds bearing yellow dusts from the Chinese mainland. In summer, the monsoon lasts for about three weeks and is typified by heavy rainfall and typhoons strike Seosan almost every year.
August is the hottest month and is humid. Fall begins in mid September and temperatures fall away quickly by November.
The first winter snows usually appear in early December. The average annual temperature is 11.8 degrees Celsius (Korea Meteorological Administration, 2012).
The sites hold a major potential for paddy rice, due to abundant water resources from the Daeho seawall. Rice samples for LAI measurement were collected at approximately 10-day intervals during growing seasons from 2010 to 2012 (Table 1). Rice seedlings were transplanted on May 28 in 2010 and 2012 and on June 5 in 2011 and harvested on October 13 in 2011 or October 19 in 2010.
LAI was measured with LI-3100C Area Meter (Li-Cor Inc.), where the projected image of a leaf sample traveling under a fluorescent light source is reflected by a system of mirrors to a solid‐state scanning camera. Hatfield et al. (1976) reported that measurement error with this type of area meter is generally less than 2%.
Satellite data and image processing The high resolution satellite used in this study was the RapidEye with a multispectral sensor. The RapidEye mission is a commercial undertaking by the German company, RapidEye AG, which intends to offer a land information service to a variety of customers. Five satellites have been launched carrying identical payload facilities. With the constellation, a global revisit time of 1 day has been achieved. The major features differentiating the RapidEye system from other multi‐spectral sensors is that there is the additional band in the red‐edge
region of the spectrum that allows a better analysis of vegetation. The multispectral imager is a pushbroom style imager, which images the Earth in five spectral bands ranging from 400 to 850 nm over an 80 km swath at 6.5 m resolution at nadir (Tyc et al. 2005).
Multi‐sensor optical data from RapidEye satellite were acquired for f1767, f1820 and f1989 on multiple dates from 2010 to 2012 during the cropping season (Table 2). The product level was 3A, a geocorrected and nonatmospheric- corrected image. Standard correction for atmospheric influences was performed on the RapidEye data set utilizing the ATCOR2 algorithm (Richter 1996; S. Gebhardt et al.
2012). Standard parameters for midlat_summer _rural land surfaces were used. The sun and sensor geometries were set up according to recorded conditions as extracted from the scene metadata. Atmospheric correction produced calibrated surface reflectance measures for the individual image bands.
Areas for extracting NDVI from the images were selected to be coincident with the hand‐harvested areas for estimating LAI.
NDVI calculation The NDVI is based on the following theory: the reflexes rates are different between near infrared (NIR) and red wavelength and, the differences in the reflexes rates produce an index which can represent the conditions of green plant. This equation is denoted as following Eq. (1):
(1)
where, NIR (850 nm) and Red (650 nm) are the near- infrared and visible reflectance of the paddy field, respe- ctively.
RapidEye surface reflectance for the visible red and NIR
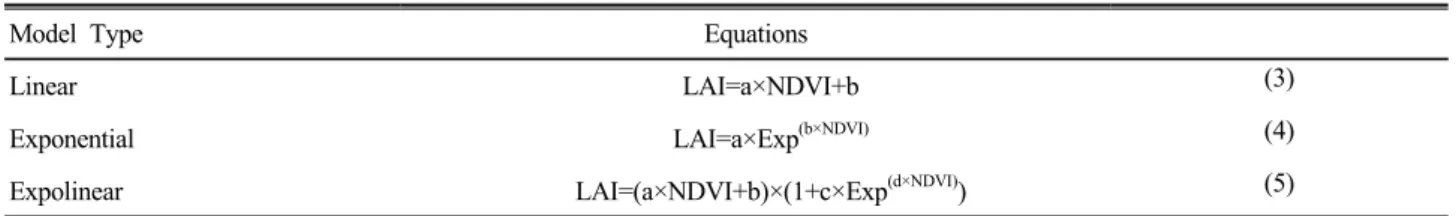
Table 3. Models used for estimating leaf area index (LAI) from satellite normalized difference vegetation index (NDVI) values.
Model Type Equations
Linear LAI=a×NDVI+b (3)
Exponential LAI=a×Exp(b×NDVI) (4)
Expolinear LAI=(a×NDVI+b)×(1+c×Exp(d×NDVI)) (5)
wavelengths were corrected for atmospheric effects and adjusted for anisotropy using ATCOR2 algorithm. The NDVI operation was commonly done using Landsat TM, AVHRR, and ASTER imagery (Na and Park, 2008). The NDVI operation for RapidEye uses bands with the following spectral characteristics of Band 3 (630 - 685 nm) and Band 5 (760 - 850 nm).
(2)
where, NDVIRapidEye is the NDVI using RapidEye image.
The formula is based on the fact that chlorophyll absorbs Red whereas the mesophyll leaf structure scatters NIR. The NDVI, thus, ranges from ‐1 to +1, where negative values correspond to an absence of vegetation.
LAI estimation Linear, exponential, and expolinear models (Anderson et al., 2004) as shown in Table 3 were used to develop regression equations for image‐based LAI. The linear model is simple to apply while, performance of the linear model is sometimes not satisfied at the period with maximum LAI (Wang et al., 2005). On the other hand, the exponential and expolinear model may give benefits to describe the relationships between LAI and NDVI at the maximum LAI though the models are relatively complicated.
The linear model is a statistical model and it may be written as Eq. (3) where, ‘a’ is containing parameters that are usually to be estimated and ‘b’ is containing errors or noise. The residual of linear model is usually assumed to follow a multivariate normal distribution. If the residual is not a multivariate normal distribution, generalized linear models may be used to relax assumptions about LAI and b. In many quantitative problems, key variables are related in patterns that are described well by linear models. But there are many other important situations in which variables are related by nonlinear patterns.
Exponential models have several key properties that make them useful for describing and reasoning about common patterns of change. While linear models match patterns of change at a constant additive rate shown as straight lines in graphs, exponential models match patterns of change at a
constant multiplicative rate shown as curves in graphs.
Among the most important nonlinear patterns of change are those that can be modeled well by rules of Eq. (4).
Goudriaan and Monteith (1990) developed a simple process based description of crop growth would be useful to summarise and interpret experimental results in terms of the basic principles of crop physiology. The underlying concept is that growth rate of a crop is proportional to intercepted radiation. The mathematical function, relating dry weight to time is called the expolinear equation and is given by Eq. (5).
This model implies that initially the LAI has linear relations with a relative NDVI. Later, when the maximum crop growth, LAI has an exponential relation with a NDVI. The expolinear model, which combined both linear and exponential functions, describes these two phases and the transition from one to the other. And the expolinear model was used for modeling crop growth and provided consistency between retrieved biophysical properties (Lee et al., 2003; Anderson et al., 2004). For the comparison of three models, coefficient of determination (R2) and root mean square error (RMSE) were used (Kim et al. 2012).
Results and Discussion
Seasonal changes in LAI and NDVI NDVI calculated from RapidEye at the monitoring sites increased to about 0.81 until early September and then decreased (Fig. 2). In other words, the time‐series NDVI showed an increase that corresponded with a start of rice growth, leading to a high NDVI peak, reaching a plateau which corresponds to a period of high photosynthetic activity, and then finally decreased, corresponding to beginning of paddy rice senescence. It was not easy to estimate the time of peak NDVI using RapidEye imagery because only 5~6 images were obtained during growing season. Although timely acquisition of satellite imagery was known as one of limitations of remote sensing, RapidEye can be obtained more frequently because of shorter revisiting time.
Fig. 3 represented the change of LAI measured in the paddy fields. LAI change was analogous to seasonal trend of NDVI change in paddy rice, suggesting that LAI change was sensitive to progression of vegetative cover and hence can be a promising parameter in estimating rice growth. The LAI of rice from all monitoring sites increased to about 4~6 until mid
Fig. 2. Seasonal changes in normalized difference vegetation index (NDVI) at research sites in Seosan, Chungcheongnam- do, South Korea.
Fig. 3. Seasonal changes in leaf area index (LAI) at research sites in Seosan, Chungcheongnam‐do, South Korea.
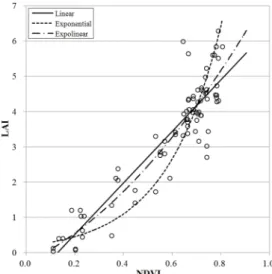
Fig. 4. Regression equations for leaf area index (LAI) with normalized difference vegetation index (NDVI).
Fig. 5. Comparison between measured and estimated leaf area index (LAI) with linear, exponential, and expolinear equations.
Table 4. Leaf area index (LAI) estimation models using normalized difference vegetation index (NDVI) evaluated with RapidEye images.
Model Type Equation R2 RMSE
Linear LAI=6.978×NDVI-0.734 0.824 0.721
Exponential LAI=0.156×Exp(4.695×NDVI) 0.754 0.947
Expolinear LAI=(0.108×NDVI-0.009) ×(1+38.859×Exp(0.667×NDVI)) 0.837 0.692
‐August and then decreased.
The time‐sequential changes of NDVI were caused by the crop growth and environmental effects inducing significant changes in rice structure and morphology during crop growth (Justice et. al. 1985; Price et. al. 1992). Similarly, analysis results suggest that growing seasonal change of NDVI or LAI is not only subject to the influence of vegetation properties, but also to soil, moisture, climate, and other factors. These values strongly correlated with land coverage materials where biomass and vegetation cover rates are usually associated with farm planning. This allows comparison among the behaviors of the different vegetation phenology in relation to the vegetation cover. Because the vegetation index correlates directly with vegetation productivity, there are numerous possible applications of this index for agricultural moni-
toring. Also, the NDVI has already been successfully applied to researches of temporal and spatial trends and variation in vegetation distribution, productivity and dynamics (Park and Na, 2007).
LAI estimation Linear, exponential, and expolinear models were applied to estimate LAI using NDVI values from RapidEye images (Table 4 and Fig. 4). The expolinear
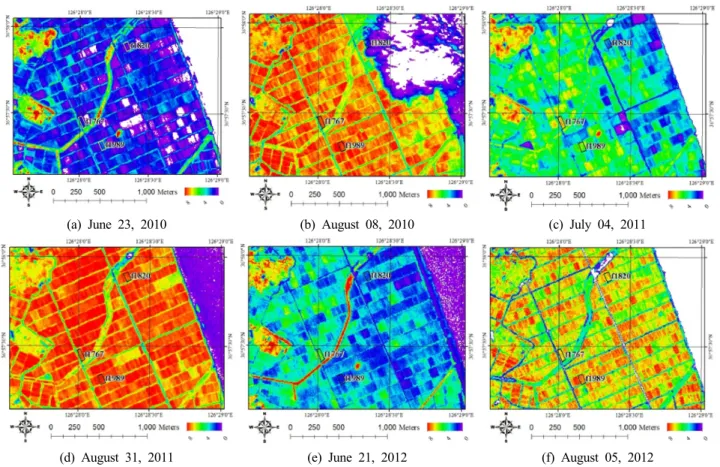
(a) June 23, 2010 (b) August 08, 2010 (c) July 04, 2011
(d) August 31, 2011 (e) June 21, 2012 (f) August 05, 2012
Fig. 6. Spatial distribution of leaf area index (LAI) in paddy fields in Seosan, Chungcheongnam‐do, South Korea.
model interprets 83.7 % of LAI variables in the paddy field and showed higher R2 than linear and exponential models for LAI estimation. It implies that the expolinear model is more effective on assessing LAI with NDVI than the linear or exponential model. It also means that the expolinear model may have an advantage to provide information about vegetation condition. Anderson et al. (2004) indicated “One functional advantage to the expolinear regression form is that the linear section (at low VI) extrapolates to bare soil conditions at reasonable values of VI”.
The relation between field‐measured LAI and estimated LAI was well fitted, the difference did exist, in which the expolinear model was the best fitted regression equation with RMSE of 0.692 (Fig. 5). Linear and exponential models followed the next place, with RMSE of 0.721 and 0.947, respectively. Also, the expolinear model generally provided better results, as shown by higher R2 values than those in linear or exponential models (Table 4). The reason that the NDVI‐based expolinear model performed better for LAI estimation than linear or exponential models can be explained that expolinear model is closer to crop growth pattern, which combines linear and exponential curves at the same time during the growing period (Anderson et al., 2004; Lee et al., 2003; Kim et al. 2012).
Mapping of LAI distribution The values of NDVI were used to map the LAI on RapidEye imagery. Fig. 6 shows a
thematic map of LAI level and its spatial distribution of surrounded by other paddy fields. LAI distribution from RapidEye imagery is in strong agreement with the field measurements in terms of both geographical variation and relative numerical values. The spatial trend of LAI corres- ponds with the variation in the vegetation growth condition. It is noted that LAI distribution provides the estimation or monitoring of ET with parameter at regional scales.
For example, LAI from all monitoring sites increased to about 4~6 until mid-August and formed a peak in those seasons such as heading stage. Particularly in f1989, LAI reached its maximum value, followed by farm planning sequentially. Also, f1989 displays the highest LAI due to near only paddy, not affected moisture in channel. Contrarily, LAI in the f1820 is lower than other field due to cloud at Aug. 08, 2010.
The result is significant for achieving the routine moni- toring of ET parameters by future resource satellite, RapidEye imagery. Although field based studies have produced some primary results in applying expolinear model for LAI, there are difficulties in applying the technique to the remotely sensed data. RapidEye image are contaminated with atmos- pheric noises such as haze, cloud and Rayleigh scattering.
Conclusions
In this study, field‐measured LAI was modeled as a function of RapidEye‐derived NDVI values using linear, exponential, and expolinear regression models. The expolinear model, based on R2 and RMSE was superior to the linear or exponential model in estimating LAI with NDVI. It was to be noted that the expolinear model is similar to crop growth pattern. Therefore, we suggest that remote sensing estimates of LAI using an expolinear function could be good crop growth models as a model input parameter for explaining yield or ET activity. Generally, ET is influenced by several factors including vegetation, air temperature, humidity, wind, radiation, and soil moisture. However, an additional effort to enhance the interpretation of satellite image is highly required if the accuracy is a key issue. The spatial resolution of 6.5 m in the RapidEye imagery may be coarse for accurate analyses. On the other hand, a temporal match of satellite imagery and field‐measured data is also important for gaining accurate analysis. Future research should emphasize the use of higher resolution and near real time remote sensing data to assess the LAI precisely and timely.
References
Anderson, M. C., C. M. U. Neale, F. Li, J. M. Norman, W. P.
Kustas, H. Jayanthi, and J. Chavez. 2004. Upscaling ground observations of vegetation water content, canopy height, and leaf area index during SMEX02 using aircraft and Landsat imagery. Remote Sensing of Environment, 92: 447-464.
Gebhardt, S., J. Huth, L. D. Nguyen, A. Roth, and C. Kuenzer.
2012. A comparison of Terra SAR‐X Quadpol backscattering with RapidEye multispectral vegetation indices over rice fields in the Mekong Delta, Vietnam. International Journal of Remote Sensing, 33(24): 7644-7661.
Goudriaan, J. and J.L. Monteith. 1990. A mathematical function for crop growth based on light interception and leaf area expansion. Annals of Botany, 66: 695-701
Gower, S., C. Kucharik, and J. Norman. 1999. Direct and indirect estimation of leaf area index, fAPAR, and net primary production of terrestrial ecosystems. Remote Sensing of Environment, 70: 29-51.
Hatfield, J. L., C. D. Stanley, and R. E. Carlson. 1976. Evaluation of an electronic foliometer to measure leaf area in corn and soybean. Agronomy Journal, 68: 434-436.
Huete, A., and H. Liu. 1994. An error and sensitivity analysis of the atmospheric‐ and soil‐ correcting variants of the NDVI for the MODIS‐EOS. IEEE Transactions on Geoscience and Remote Sensing, 32: 897-905.
Justice, C. O. et al. 1985. Analysis of the phenology of global vegetation using meteorological satellite data. International
Journal of Remote Sensing, 6: 1271-1318.
Kim, S. H., S. Y. Hong, A. S. Kenneth, Y. H. Kim, and K. D. Lee.
2012. Comparing LAI estimates of corn and soybean from vegetation indices of multi‐resolution satellite images. Korean Journal of Remote Sensing, 28(6): 597-609.
Korea Meteorological Administration Homepage, http://www.
kma.go.kr/. Accessed 17 June 2012.
Lee, J. H., J. Goudriaan, and H. Challa. 2003. Using the expolinear growth equation for modelling crop growth in year‐
round cut chrysanthemum. Annals of Botany, 92: 697-708.
Lee, K. S., S. H. Kim, J. H. Park, T. G. Kim, Y. I. Park, and C. S.
Woo. 2006. Estimation of forest LAI in close canopy situation using optical remote sensing data. Korean Journal of Remote Sensing, 22(5): 305-311.
Leprieur, C., Y. H. Kerr, S. Mastorchio, and J. C. Meunier. 2000.
Monitoring vegetation cover across semi‐arid regions : comparison of remote observations from various scales.
International Journal of Remote Sensing, 21: 281-300.
Na, S. I., and J. H. Park. 2008. Regional scale evapotranspiration mapping using Landsat 7 ETM+ land surface temperature and NDVI Space. Journal of the Korean Society of Agricultural Engineers, 50(3): 115-123.
Na, S. I., J. H. Park, K. H. Lee, S. J. Kim, and J. W. Lee. 2010.
Estimating leaf area index for vegetation indices and its application in paddy. International Symposium on Remote Sensing 2010. Jeju, Korea, October 26-29, 2010
Park, J. H., and S. I. Na. 2007. MODIS and Landsat TM data image fusion based on improved resolution method: Assessing the quality of resulting NDVI images. Proceeding of SPIE The International Society for Optical Engineering 6742, art. No.
67420S.
Price, J. C. 1992. Estimating vegetation amount from visible and near infrared reflectances. Remote Sensing of Environment, 41: 29-34.
Price, J. C., and W. C. Bausch. 1995. Leaf area index estimation from visible and near‐infrared reflectance data, Remote Sensing Environ, 52: 55-65.
Qi, J., Y. H. Kerr, M. S. Moran, A. R. Huete, S. Sorooshian, and R. Bryant. 2007. Leaf area index estimates using remotely sensed data and BRDF models in a semiarid region. Remote Sensing Environ, 73: 18-30.
Qin, J., S. Liang, X. Li. 2008. Development of the adjoint model of a canopy radiative transfer model for sensitivity study and inversion of leaf area index. IEEE Trans Geosci Remote Sens, 46: 2028‐2037.
Richter, R. 1996. Atmospheric correction of DAIS hyperspectral image data. Computers & Geosciences, 22: 785-793.
Shin, S. C., M. H. Hwang, I. H. Ko, and S. J. Lee. 2006.
Suggestion of simple method to estimate evapotranspiration using vegetation and temperature information. Journal of Korea Water Resources Association, 39(4): 363-372.
Stenberg, P., M. Rautiainen, T. Manninen, P. Voipio, and H.
Smolander. 2004. Reduced simple ratio better than NDVI for estimating LAI in Finnish pine and spruce stands. Silva Fennica, 38(1): 3-14.
Tyc, G., J. Tulip, D. Schulten, M. Krischke, and M. Oxfort. 2005.
The RapidEye mission design. Acta Astronautica, 56: 213219.
Wang, Q., S. Adiku, J. Tenhunen, and A. Granier. 2005. On the
relationship of NDVI with leaf area index in a deciduous forest site. Remote Sensing of Environment, 94: 244-255.
Watson, D. J. 1947. Comparative physiological studies on the growth of field crops: I. Variation in net assimilation rate and leaf area between species and varieties, and with and between years. Annual. Botany, (N.S.), 11: 41-76.