www.earticle.net
전자코를 이용한 한우육의 부위별 가열에 따른 향기 패턴
김주용1)․김용선2)․강선문․이성기*
강원대학교 축산식품과학과, 매일유업주식회사1), 강원대학교 동물자원공동연구소2)
Aroma Patterns According to Cooking and Muscle Parts of Hanwoo Beef by Using an Electronic Nose
*
Ju-Yong Kim1), Yong Sun Kim2), Sun-Moon Kang and Sung Ki Lee*
Department of Food Science and Technology in Animal Resources, Kangwon National University Maeil Dairy Industry Co., Ltd1), Institute of Animal Resources, Kangwon National University2)
ABSTRACT
This study was carried out to investigate aroma patterns of Hanwoo (Korean cattle) beef by using an Electronic nose. The M. longissimus muscle and Semimembranosus muscle after 24 hours postmortem was obtained, and half muscles cooked in water batch until internal temperature arrived at 70℃ or microwave for 30 sec. The raw and cooked beef samples stored at 1℃ for 11 days. Sensitivity values (dR/RO) among electronic nose data were changed differently by muscle parts, heat treatments and storage days. The dR/RO values from SY/LG, T30/1, P10/1, P10/2 were decreased at 11th storage compared with those at 1th storage. Mapping these data by using PCA (principal component analysis) showed that raw and cooked beef data were presented on the right and left side of board, respectively. The data of 1st storage were presented on the right side, and flock together. Otherwise, the data of 11th storage were spreaded out more widely on the left side. Consequently, the dR/RO value and PCA mapping by Electronic nose data showed difference by sample treatments and storage days. Therefore it will be possible to able to detect separated aroma patterns of Hanwoo beef by using an Electronic nose.
Key words : electronic nose, hanwoo beef, aroma
* Corresponding author: Sung Ki Lee, Tel: 82-33-250-8646, Fax: 82-33-242-4540, E-mail: skilee@kangwon.ac.kr
Ⅰ. 서 론
쇠고기의 숙성기간중에 향기는 내인성 효소에 의해 저급 분자량의 함질소화합물의 생성으로 발생하게 된다. 소비자 들이 좋아하는 쇠고기의 기호도는 조직감, 다즙성, 색깔 등 이 있지만 그중에서도 육향기는 쇠고기를 선택하게 하는 중 요한 품질요인이기도 하다. 저장기간에 따라 육향기를 객관 적으로 측정하기위해 관능검사와 GC/MS 방법이 이용되고 있지만, 시간이 많이 소요되거나 반복에 따른 정확성이 떨어 지거나 산출비용과 시간이 많이 소요되는 장점이 있다 (Masila 등, 1999; Vincent, 1999). 이런 단점을 극복하기 위 하여 사람의 후각체계를 모방한 기계에 대한 접근이 시도되 었고, sensor 기술과 패턴인식 시스템의 발전으로 인하여 전
자코 시스템이 탄생하게 되었다(David 등, 1998). 전자코 (Electronic nose) 시스템이란 multi-sensor array 기술을 이 용하여 특정 향기 또는 냄새성분이 각각의 센서에서 전기 화 학적 반응을 일으켜 전기적인 신호로 변환되며, 이것을 S/W 상에서 처리하여 분석하는 장치를 말한다(인성(주), 2001).
전자코 시스템에 의한 분석은 쇠고기의 향기성분이나 함량 을 검출하는 것이 아니고, 전자코에서 도출한 데이터가 GC/MS로 동정한 향기성분의 강도와 어떤 상관성도 가지고 있지 않다(Harper, 2000). 따라서 전자코로 식육의 향기성분 의 변화나 차이를 식별하는 것이 주 목적이라고 할 수 있다. Grigioni 등(2000)은 목초와 곡류를 급여하여 사육한 소를 도축하여 냉장저장중 육향기를 전자코(AromaScan A32/
[Provider:earticle] Download by IP 118.70.52.165 at Monday, December 20, 2021 8:20 PM
www.earticle.net
50S. Osmetech UK)로 측정한 결과 판별할 수 있었다고 하였 다. 전자코를 이용한 육류식품 에 대하여 식육검사(Hall, 1997), 진공포장육의 변질(Blixt and Borch, 1999), 닭고기 변 질(Arnold and Seenter, 1999), 어육의 품질이나 신선도 (Neuman et al., 1999) 등에 일부 연구가 시도되었을 뿐 아직 초기단계에 있다.
본 연구는 전자코(Alpha MOS, Fox 3000, 12개 Metal Oxide Sensor)를 이용하여 냉장저장중에 한우 등심육과 우 둔육의 가열여부에 따른 기본 향기패턴을 객관적으로 판별 해 보고자 실시하였다.
Ⅱ. 재료 및 방법
1. 시료의 처리
도축 후 24 시간이 경과된 한우(거세우 5두, 24 개월령)의 등심(M. Longissimus)과 우둔(Semimembranosus) 부위를 사용하여 각각 1.0 cm 두께로 절단하였다. 가열용 73℃의 열 수에서 육내부온도가 70℃에 도달한 후 10분간 가열한 후 방 냉시켰다. 생육과 가열육을 polyethylene wrap film(oxygen transmission rate 35,273 cc/m2․24 hr․atm, thickness 0.01 mm, 3M Co., Korea)으로 포장을 한 후 항온항습기(Climatic test chamber, VC2057, Vötsch Industrietechnik, Germany)
에서 11일간 저장(1±1℃, 90% RH)하였다. 분석용 시료를 지 름 1 mm의 plate의 만육기(meat grinder)를 이용하여 분쇄 한 후 실험에 사용하였다. 그중 시료 1 g을 120 mL vial에 담 은 후 전자코 측정용 시료로 사용하였다.
2. 전자코를 이용한 향기패턴 분석
Alpha MOS社의 Fox 3,000(12개 metal oxide sensor, France)을 이용하여 한우육의 향기를 측정하였으며(Table 1), 분석조건은 Table 2와 같다. 데이터는 센서에 발생한 전기저 항의 변화와 전위차를 두 개 이상의 독립변수로 하며 다변량 통계분석(multivariate statistics analysis) 프로그램(Alpha MOS SA에서 제공)을 이용하여 센서의 감응도(sensors sensitivity, dR/R0), 주성분 분석법(principal component analysis, PCA)과 판별분석법(discriminant factor analysis, DFA)으로 도식화하였다.
(1) 센서의 감응도(dR/R0)
센서의 감응도는 아래와 같은 공식으로 산출되었다. dR/R0 : Value of the sensors in relative resistance change.
dR/R0 = R0 - RR0 .
R0 : resistance at t = 0 (baseline resistance).
R : resistance at selected time.
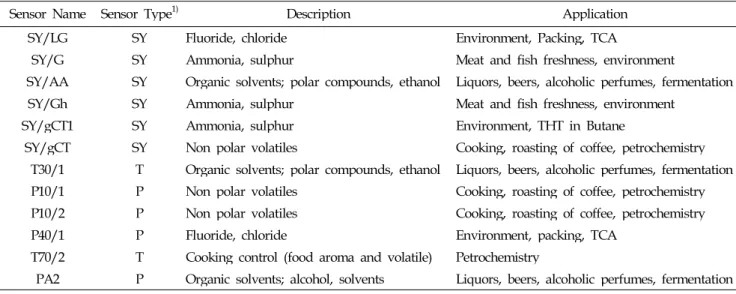
Table 1. Metal oxide sensors of electronic nose (Anonymous, 2001)
Sensor Name Sensor Type1) Description Application
SY/LG SY Fluoride, chloride Environment, Packing, TCA
SY/G SY Ammonia, sulphur Meat and fish freshness, environment
SY/AA SY Organic solvents; polar compounds, ethanol Liquors, beers, alcoholic perfumes, fermentation
SY/Gh SY Ammonia, sulphur Meat and fish freshness, environment
SY/gCT1 SY Ammonia, sulphur Environment, THT in Butane
SY/gCT SY Non polar volatiles Cooking, roasting of coffee, petrochemistry T30/1 T Organic solvents; polar compounds, ethanol Liquors, beers, alcoholic perfumes, fermentation P10/1 P Non polar volatiles Cooking, roasting of coffee, petrochemistry P10/2 P Non polar volatiles Cooking, roasting of coffee, petrochemistry
P40/1 P Fluoride, chloride Environment, packing, TCA
T70/2 T Cooking control (food aroma and volatile) Petrochemistry
PA2 P Organic solvents; alcohol, solvents Liquors, beers, alcoholic perfumes, fermentation
1) T, a conventional sensor using a high quality alumina tube gold printed electrodes connecting gold alloy wires and reliable iron chrome alloy heater; P, a plane type of sensors using thick film technology on a small and thin alumina substrate; SY, a sensor which incorporates a thick film material deposited on interdigitated electrodes on a alumina substrate with the platinum alloy thick heater.
[Provider:earticle] Download by IP 118.70.52.165 at Monday, December 20, 2021 8:20 PM
www.earticle.net
Table 2. Electronic nose operating conditions
Items Condition
Sample 1g
Sampling chamber 40℃
Acquisition time 150 sec Acquisition period 0.5 sec
Delay time 600 sec
Start injection time 15
Injection time 60 sec
(2) 주성분 분석법(PCA)
짧은 시간내에 센서 어레이로 부터 발생된 많은 데이터를 2차 혹은 3차원의 데이터로 축약하여 고유치가 가장 큰 벡터 에 내적한 주성분의 값들을 제 1주성분(first principal component), 그 다음으로 큰 고유 벡터에 대한 주성분의 값 들을 제 2 주성분(second principal component), 총 ... M 주성분까지 계산하였다. 각 고유 벡터의 방향은 데이터 행렬 의 M 차원 공간상에서 변이를 각각 직교화된 방향으로 분산 하여 표시하였다.
Var i(%) = λi
∑M
j= 1
×100
Var i : Variance which is described by the ith eigen vector λi : The ith eigen value
센서 어레이에서 발생하는 신호 변이의 대부분을 제 1, 2 주성분으로 설명할 수 있기 때문에 그 주성분 공간상에 각 센서 어레이의 신호를 표현할 수 있으며, 데이터 처리에서의 직관적인 분석을 실시하였다.
3. 통계분석
통계분석은 SAS(Statistics analytics system, USA) program을 이용하여 유의성 검증을 위해 분산분석을 한 후 Duncan 검정법(평균간 다중검정법)을 이용하였다.
Ⅲ. 결과 및 고찰
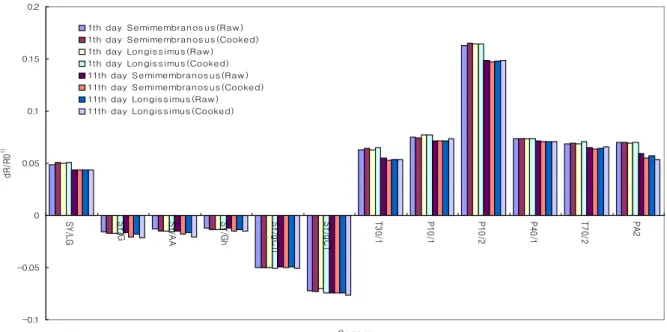
Fig. 1은 한우 우둔과 등심부위의 생육과 가열육으로 나누 어 1℃에서 1일과 11일간 저장하면서 전자코 센서의 감응도 (dR/R0) 변화를 나타낸 것이다. SY/LG, T30/1, P10/1, P10/2. P40/1, T70/2, PA2 센서의 감응도는 양의 값을, SY/G, SY/AA, SY/Gh, SY/gCT1, SY/gCT 센서의 감응도 는 음의 값을 나타내었다. 각 시료의 감응도 값을 보면 부위 와 가열여부보다는 저장 1일에 비하여 11일에 감응도가 낮아 지는 경향을 보였다. 특히 SY/LG, T30/1, P10/1, P10/2의 센서 값에서 현저한 차이를 보였다(p<0.05).
-0.1 -0.05 0 0.05 0.1 0.15 0.2
SY/LG SY/G SY/AA SY/Gh SY/gCTl SY/gCT T30/1 P10/1 P10/2 P40/1 T70/2 PA2
S ens or
dR/R01)
1th day S emimembranos us (Raw ) 1th day S emimembranos us (Cooked) 1th day Longis s imus (Raw ) 1th day Longis s imus (Cooked) 11th day S emimembranos us (Raw ) 11th day S emimembranos us (Cooked) 11th day Longis s imus (Raw ) 11th day Longis s imus (Cooked)
Fig. 1. Changes of sensitivity (dR/R0) during storage at 5℃. dR/R0: Value of the sensors in relative resistance change. dR/R0
= R0 - RR0 . R0 : resistance at t = 0 (baseline resistance). R : resistance at selected time.
[Provider:earticle] Download by IP 118.70.52.165 at Monday, December 20, 2021 8:20 PM
www.earticle.net
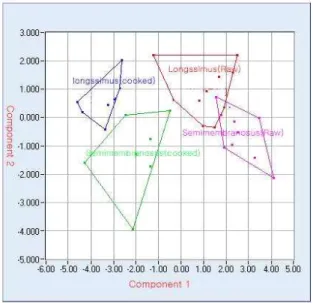
Fig. 2는 한우의 우둔과 등심의 가열여부에 따라 처리하여 얻은 전자코 데이터를 주성분 분석법(principal component analysis; PCA)으로 도식화하였다. 생시료는 오른쪽에 군락 이 형성되었고, micowave로 가열시킨 한우육은 왼쪽에 군락 이 형성되었다. 가열여부와 상관없이 등심은 위쪽에, 우둔은 아래쪽에 군락이 형성되었다. 군락형성 분포를 보면 일부 등
Fig. 2. Comparison of aroma patterns raw and cooked Hanwoo beef by using principal component analysis(PCA). In case of cooked beef, the samples were heated in the microwave oven for 10 sec.
Fig. 3. Comparison of aroma patterns of Hanwoo beef by using principal component analysis (PCA) method.
The beef was stored for 1 day and 11days, respectively, at 1℃. Long-R: Muscle. Longissimus (Raw). Long-C: Muscle. Longissimus(Cooked). Semi- R: Muscle. Semimembranosus (Raw). Semi-C:
Muscle. semimembranosus(Cooked).
심과 우둔의 생육의 감응도에서 중복되었지만, 전체적으로 군락별 분포가 퍼져 있음을 알 수 있으며 가열여부에 따른 향기의 차이는 확연히 구별할 수 있었다.
Fig. 3은 등심과 우둔육의 생육상태와 가열육 상태로 저온 (1±1℃) 저장시키면서 전자코에 의한 향기의 감응도 분포를 나타낸 것이다. 저장 1일은 우측에, 저장 11일은 좌측에 군 락이 위아래로 형성되어 저장 기간에 따른 차이를 식별할 수 있었다. 생육 시료의 감응도는 위쪽에, 가열한 시료의 감응도 는 아랫쪽에 군락이 형성되었다. 그러나 저장 11일째는 처리 구별 군락분포가 넓게 형성되어 확실하게 식별이 가능하였 지만, 저장 1일에서는 처리구별 군락이 밀집되어 있어 중첩 되는 부분이 있었다.
Ⅳ. 적 요
본 연구는 전자코 시스템을 이용하여 센서의 감응도, 주성 분 분석을 통해 한우육의 부위(우둔과 등심)와 가열여부에 따른 기본 향기패턴을 알아보기 위하여 실시하였다. 시료는 도축 후 24시간이 경과한 쇠고기의 등심을 1℃에서 11일간 저장하면서 실험에 사용하였다. 저장 1일에 비하여 11일에 감응도가 SY/LG, T30/1, P10/1, P10/2의 센서 값에서 낮아 지는 경향을 보였다(p<0.05). 가열여부의 시험에서 생시료는 오른쪽에 군락이 형성되었고, 가열육은 왼쪽에 군락이 형성 되었다. 저장시험에서는 저장 1일은 오른쪽측에, 저장 11일 은 왼쪽에 군락이 위아래로 형성되어 저장 기간에 따른 차이 를 식별할 수 있었다. 그러므로 전자코를 이용하여 기본 향 기를 판별하는데 있어서 가열여부와 저장에 따른 차이식별 이 가능하였다.
감사의 글
본 연구는 2001년도 한국학술진흥재단의 대학부설연구소 연구과제(KRF-01-005 -G20006)로 수행된 연구결과의 일부이 며, 강원대학교 동물자원공동연구소의 지원하에 실험기계를 활용하여 수행되었습니다. 이에 감사드립니다.
Ⅴ. 인 용 문 헌
1. Anonymous. 2001. Semi-conduct Sensors. Alpha MOS
[Provider:earticle] Download by IP 118.70.52.165 at Monday, December 20, 2021 8:20 PM
www.earticle.net
Co. France.
2. Arnold, J. W. and S. D. Senter. 1998. Use of digital aroma technology and SPME GC-MS to compare volatile compounds produced by bacteria isolated from processed poultry. J. Sci. Food & Agric. 78:343-348.
3. Blixt, Y. and E. Borch. 1999. Using an electric nose for determining the spoilage of vacuum-packaged beef.
International J. Food microbiol. 46:123-134.
4. David, C. L., A. B. Don, and A. B. Graham. 1998.
Electronic noses. In: Prospects for applications in Australian industry. Jain, L. C. and Jain, R. K.(eds), Proceeding of the Second International Conference on Knowledge-Based Intelligent Electronic Systems, 21-23 April 1998. p126.
5. Grigioni, G. M., C. A. Margaria, and N. A. Pensel. 2000.
Aroma of fresh and processed meat assessed by an electronic nose. Proceed. 46th Int. Cong. Meat Sci.
Technol., Buenos Aires, Argentina, Vol. 2, p591.
6. Hall, M. 1997. Assistance of electric noses at meat inspection. Svensk-Veterinartidning 49(8/9), 375-378.
7. Harper, W .J. 2000. Newer methods in sensory analysis.
Proceed. 46th Int. Cong. Meat Sci. Technol., Buenos Aires, Argentina, Vol. 2, p582-589.
8. Masila M, M. Breimer and O. A. Sadik. 1999. Strategies for improving the analysis organic compounds using GC-Based electronic nose. In: Electronic nose and sensor array based systems. Hurst, W. J. (ed), Proceedings of 5th International Symposium on Olfaction and Electronic Nose, pp. 27.
9. Neuman, D. J., D. A. Luzuriage, and M. O. Balaban.
1999. Odor and microbiological evaluation of raw tuna.
In: Electronic nosed and sense array based systems-Design and application. Technomic Publishing Company, Lancaster, Basal, p170-176.
10. Shinhuber, R. O. and T. C. Yu. 1977. The 2-thiobarbituric acid reaction, and objective measure of the oxidative deterioration occurring in fats and oils. J.
Jap. Soc. Fish. Sci. 26:259-267.
11. Storey, R. M., H. K. Davis, D. Owen and L. Moore.
1984. Rapid approximate estimation of volatile amines in fish. J. Food Technol. 19:1-10.
12. Vincent, D. 1999. Electronic nose: principal and application. Nature 402:351-352.
13. 인성(주). (2001) 전자코/전자혀 system의 원리와 응용.
Workshop 자료. 서울.
[Provider:earticle] Download by IP 118.70.52.165 at Monday, December 20, 2021 8:20 PM