Copyright ⓒ Korean Academy of Dental Technology
This is an Open Access article distributed under the terms of the Creative Commons Attribution Non-Commercial License (http://creativecommons.org/licenses/by-nc/4.0) which permits unrestricted non-commercial use, distribution, and reproduction in any medium, provided the original work is properly cited.
INTRODUCTION
In recent years, due to the development of medical technol- ogy, Korea is growing aging population in conjunction with in- crease in overall population. The increase in the elderly popu- lation is causing social problems deriving out of their health and welfare [1,2]. In order to maintain the optimal health of
the elderly, the most basic thing is to consume proper nutri- tion, and for this, it is essential to secure oral function for masticatory movement. The most common oral problem in the elderly is caused by loss of large number of teeth. Dentures or dental implants are used to restore restoration of masticatory function by replacing the function. At the same time, they are helpful for enhancing pronunciations and aesthetics, which are Purpose: This study aimed to investigate the perception of dental implant insurance supply and demand for the elderly living in Hongseong-gun and Chungcheongnam-do, as well as the selection criteria regarding dental clinics for dental implant treatment to collect basic data for improving the oral health of the elderly population.
Methods: Participants living in Hongseong-gun, Chungcheongnam-do who were at least 55 years old from November 2020 to March 2021 were included in this study. The chi-square test was performed to examine the age-specific perception of insurance-covered dental im- plants (p<0.05).
Results: The age group that was the most interested in implants was the 70s age group, and the difference between this age group and the other age groups was statistically signifi- cant. Those in their 70’s, 80’s, and 90’s or older paid about 600,000 won including dental implants covered by insurance, and there was a significant difference (p<0.05). Those in their 60s, 70s, and 80s estimated the highest value of implants covered by insurance as two and showed a significant difference (p<0.05). The awareness of the dental implant in- surance by age showed that all age groups, except for the ≥90 years age group, considered the insurance to be mediocre mostly due to the large co-payment (p<0.05).
Conclusion: There were differences by age in the awareness of dental implant insurance, co-payments, number of applications, and insurance coverage. The perceptions on dental implant insurance by age showed that all age groups except for those over 90 years and older, they considered the insurance was just mediocre the most.
Key Words: Awareness, Dental implants, Elderly age, Insurance recipiency, Oral health Article Info
Received August 10, 2021 Revised August 30, 2021 Accepted September 6, 2021
Corresponding Author Min Soo Han
Department of Dental Laboratory Technol- ogy, Hyejeon College, 19 Daehak 1-gil, Hong- seong-eup, Hongseong-gun 32244, Korea E-mail: [email protected]
https://orcid.org/0000-0003-4501-2913
*This paper was supported by grant from Hyejeon College, 2020.
https://doi.org/10.14347/jtd.2021.43.3.124 pISSN: 1229-3954 eISSN: 2288-5218
J Tech Dent 2021;43(3):124-131 Original Article
충청남도 홍성군관내 노인환자의 치과 임플란트 보험수급 인식도와 치과진료기관 선정 요건에 관한 분석
한민수, 권은자, 최에스더
혜전대학교 치기공과
An analysis of the perceptions of dental implant plans in the Korean national health insurance and the dental clinic selection criteria among elderly patients in Hongseong-gun, Chungcheongnam-do
Min Soo Han, Eun Ja Kwon, Esther Choi
Department of Dental Laboratory Technology, Hyejeon College, Hongseong, Korea
JOURNAL OF TECHNOLOGIC DENTISTRY
J TD
Min Soo Han, et al: Awareness of dental implant insurance recipiency of elderly patients
related to interpersonal relationships. Therefore, oral health is not just a health issue, but has a great impact on the qual- ity of life. Accordingly, there is a continuous need for efforts to improve oral health of the elderly [3]. According to the 2012 National Health and Nutrition Examination Survey, 29.35% of the elderly aged 65 years and older had no dental treatment, and 49.15% of those aged 70 years or older complained of mastication discomfort. That is, 1 out of 2 individuals com- plains of discomfort in mastication [4]. In Korea, as interest in dental health increases, various efforts are being made for its advancement. In 2014, for the first time in the world, dental implant coverage by national health insurance was started with 50% of the co-payment for those over 75 years of age. In 2015, the target was expanded to those aged 70 and over, and in 2016, again extended to those aged 65 and over [5].
Accordingly, proportion of the patients with the insurance dentures to those with the insurance implants is expected to increase significantly. As the number of insurance dentures and implants increase, many studies have been reported on the application different types of dental prosthetics and their sat- isfaction degrees. The studies prevailed that when comparing the quality of life of the elderly with dentures and those with implants, the patients with dental implants showed greater sat- isfaction in masticating ability and quality of life [6-8]. There have been many studies in Korea evaluating oral health sta- tus of the elderly and determining extent of its impact on the quality of life.
Yet, analysis on the elder’s acknowledgement on dental im- plants as treatment is insufficient, and as well analysis on the senior group’s criteria to select dental treatment institutions.
Accordingly, this study investigate demands of the elderly living in Hongseong-gun, Chungcheongnam-do on insurance dental implants, and also their selection criteria for dental hospitals and clinics for the dental implant treatment to provide basic data for improving oral health of the elderly.
MATERIALS AND METHODS
1. Research subject
This study surveyed the elderly aged 55 years or older liv- ing in Hongseong-gun, Chungcheongnam-do from November 2020 to March 2021. The subjects of the study were the sub- jects who agreed to after being explained the purpose of the
study, and answered the simple-answer and interview type questionnaire. The total number of subjects responded to 121, and 118 copies were finally analyzed, excluding 3 insincere questionnaires.
2. Research methods
The survey contents consisted of 3 questions on general characteristics, 3 questions on the awareness of dental im- plants, and 6 questions on the conditions for selecting dental hospitals and clinics for dental implant surgery. Preliminary questionnaires were developed with reference to the research papers. As the preliminary and interview questionnaire was conducted targeting 15 people over 55 years of age, and the questions were revised and improved in consideration of the significance of the research contents.
3. Data analysis
With the collected data, the categorical data of the study subjects were analyzed by the chi-square test, and the statisti- cal significance level was α=0.05. Fisher’s exact test was per- formed as a post hoc test.
RESULTS
1. General characteristics of the study subjects
The general characteristics of the study subjects were that they were composed of 34.75% man and 65.25% woman, and in terms of age, 4.24% of group was under 60s, 17.8% was over 60s, 34.75% was in 70s, 37.29% in 80s, 5.93% was in 90s. When it came to occupations, 65.25% was in agriculture, 26.27% was in others, 5.93% was professionals and 2.54% preferred not to answer (Table 1).
2. Comparison of awareness of insurance dental implants
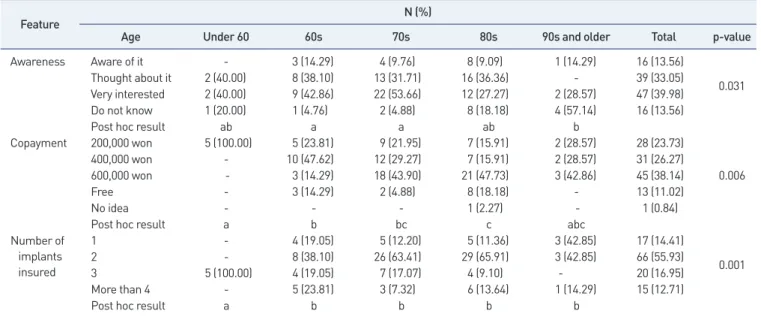
In the comparison of the age-specific insurance dental im- plant awareness, those under 60s who thought about whether they were aware of dental implants, or were interested, were both 40.0% respectively. The age group in 60s showed 38.10%
and 42.86% correspondingly. The age group in 70s showed
the most with 31.71% saying they have thought about it, and
53.66% saying they are very interested. 36.36% of the age
group in 80s displayed that they have thought about it, mean-
JOURNAL OF TECHNOLOGIC DENTISTRY
J TD
while 27.27% answered they have a lot of interest. Accordingly, there was a significant difference by age in awareness about implants (p<0.05). For the questionnaire whether the subjects were aware of how much the co-payment was, 100% of those under the age of 60 answered that copayment was 200,000 won. 47.62% of those in 60s, the highest percentage of the group, answered the copayment 400,000 won. For those in 70s, 80s, and 90s and over answered the copayment 600,000 won at 43.9%, 47.73%, and 42.86%, respectively. There was a significant difference by age for the co-payment of insurance implants (p<0.05). 100% of the age group under 60s supposed the national health insurance could cover 3 dental implants, whereas the age group in 60s, 70s, and 80s, thought the insur-
ance could cover up to 2 dental implants at the percentage of 38.1%, 63.41%, and 65.91%, respectively. There was a signifi- cant difference by age for the answer to the number of insur- ance dental implants covered (p<0.05; Table 2).
3. Comparison of attitudes toward the dental implant and its surgery
When the age-specific perceptions on insurance dental implant surgery of the study subjects were compared, for the experience of dental implant surgery, 80.0% of the age group under 60 had no experience with the dental implant surgery, and 57.14% of the group in 60s had no experience with im- plant surgery. Those in their 70s and those in their 80s had the highest rate of 68.3% and 87.18%, respectively, for the an- swer that they had no experience with implant surgery. 100%
of the age group in 90s answered they had no experience of dental implant surgery. When it came to the reasons why they are receiving the dental implant surgery, healthy food intake was the most common answer for all age groups, on the other hand, the most common reason for not having dental implant surgery was due to living conditions at all age groups. And for the question asking who should be the decision maker for in- surance dental implant surgery, the surgery recipient himself displayed the biggest parts in all age groups (Table 3).
Table 1.
Table 1. General characteristics of the study subjects by age (N =118)
Characteristics N (%)
Gender
Woman 77 (65.25)
Man 41 (34.75)
Age
Under 60 5 (4.24)
60s 21 (17.80)
70s 41(34.75)
80s 44 (37.29)
90s and older 7 (5.93)
Occupation
Agriculture 77 (65.25)
Other 31 (26.27)
Professional 7 (5.93)
Prefer not to answer 3 (2.54)
Table 2.
Table 2. Comparison of awareness of insurance dental implants by age (N=118)
Feature N (%)
Age Under 60 60s 70s 80s 90s and older Total p-value
Awareness Aware of it - 3 (14.29) 4 (9.76) 8 (9.09) 1 (14.29) 16 (13.56)
0.031
Thought about it 2 (40.00) 8 (38.10) 13 (31.71) 16 (36.36) - 39 (33.05)
Very interested 2 (40.00) 9 (42.86) 22 (53.66) 12 (27.27) 2 (28.57) 47 (39.98)
Do not know 1 (20.00) 1 (4.76) 2 (4.88) 8 (18.18) 4 (57.14) 16 (13.56)
Post hoc result ab a a ab b
Copayment 200,000 won 5 (100.00) 5 (23.81) 9 (21.95) 7 (15.91) 2 (28.57) 28 (23.73)
0.006
400,000 won - 10 (47.62) 12 (29.27) 7 (15.91) 2 (28.57) 31 (26.27)
600,000 won - 3 (14.29) 18 (43.90) 21 (47.73) 3 (42.86) 45 (38.14)
Free - 3 (14.29) 2 (4.88) 8 (18.18) - 13 (11.02)
No idea - - - 1 (2.27) - 1 (0.84)
Post hoc result a b bc c abc
Number of implants insured
1 - 4 (19.05) 5 (12.20) 5 (11.36) 3 (42.85) 17 (14.41)
0.001
2 - 8 (38.10) 26 (63.41) 29 (65.91) 3 (42.85) 66 (55.93)
3 5 (100.00) 4 (19.05) 7 (17.07) 4 (9.10) - 20 (16.95)
More than 4 - 5 (23.81) 3 (7.32) 6 (13.64) 1 (14.29) 15 (12.71)
Post hoc result a b b b b
Min Soo Han, et al: Awareness of dental implant insurance recipiency of elderly patients
4. Comparison on awareness of dental implant insurance recipiency
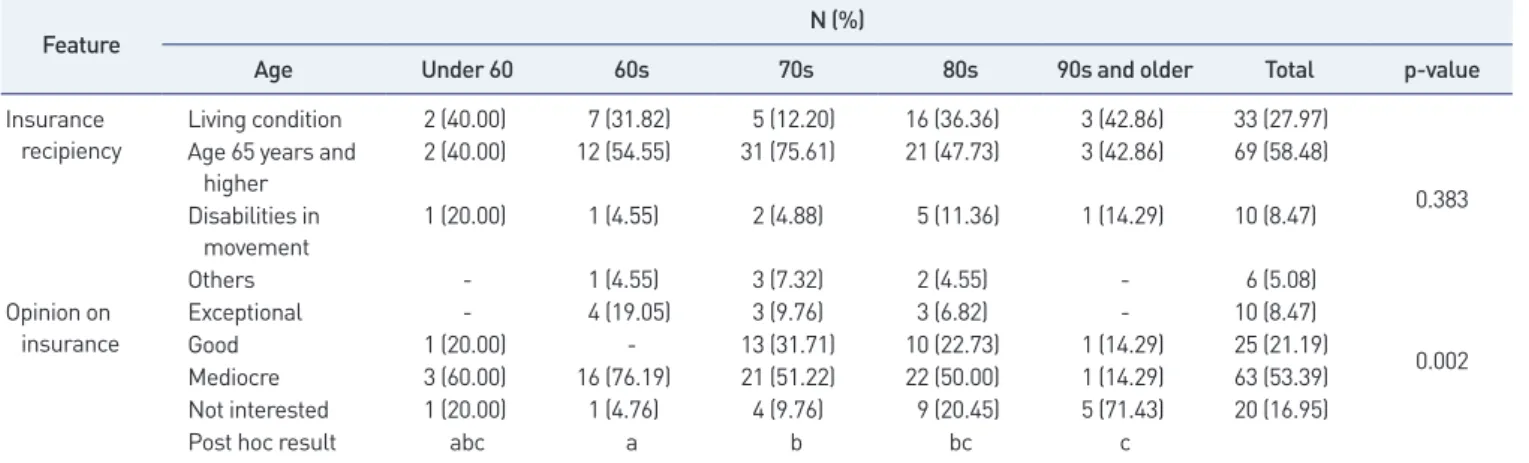
In a comparison of the age-specific awareness on qualifica- tion of the insurance-covered dental implants among the study subjects, all groups replied that the age 65 years or older were the age that was most likely to receive dental implant insur- ance. For opinion on receiving insurance for dental implants, the most in all age groups answered that it was mediocre ex- cept those over 90. The age group in 90s answered 71.43% that they were not interested in the matter. There was a significant difference in opinions on the supply and demand of insurance implants by age (p<0.05; Table 4).
5. Selection of dental hospitals and clinics by age In the comparison of selection criteria for dental hospitals and clinics by age of the study subjects, the age group in 70s, 80s, and 90s showed preference of dental hospitals and clin- ics located near Hongseong-gun was 46.34% and 45.45%, and 85.71% respectively. Regarding the criteria for determining the location of hospitals and clinics, those in 60s, 80s, and over 90s showed the near residence with 61.9%, 59.1%, and 71.43%, respectively, 46.34% of the group in 70s showed that the rec- ommendation of acquaintance appeared as the most impor- tant determining factor for the location. Regarding the local conditions around a hospital or clinic, it was found that all
Table 3.
Table 3. Comparison of attitudes toward the dental implant and its surgery by age (N=118)
Feature N (%)
Age Under 60 60s 70s 80s 90s and older Total p-value
Experience Yes 1 (20.00) 9 (42.86) 13 (31.70) 5 (12.82) - 28 (23.73)
0.020
No 4 (80.00) 12 (57.14) 28 (68.30) 39 (87.18) 7 (100.00) 90 (76.27)
Reason for implant surgery
Healthy food intake 4 (80.00) 21 (100.00) 34 (82.93) 41 (93.18) 6 (85.71) 106 (89.83)
0.758
Family suggestion - - 2 (4.88) 1 (2.27) - 3 (2.54)
Economic factor 1 (20.00) - 4 (9.76) 2 (4.45) 1 (14.29) 8 (6.78)
Other - - 1 (2.44) - - 1 (0.84)
Reasons for no implant surgery
Living condition 2 (40.00) 10 (47.62) 21 (51.22) 16 (36.36) 5 (71.43) 54 (45.76)
0.780 Opinions from
surrounding
1 (20.00) 4 (19.05) 11 (26.83) 9 (20.45) - 25 (21.19)
Dental treatment issue
1 (20.00) 3 (14.39) 3 (7.32) 6 (13.35) 1 (14.29) 14 (11.86)
Other 1 (20.00) 4 (19.05) 6 (14.63) 13 (29.55) 1 (14.29) 25 (21.19)
Decision maker
Recipient-self 5 (100.00) 18 (85.71) 34 (82.93) 31 (70.45) 3 (42.86) 91 (77.12)
0.320 Guardian not living
together - 1 (4.76) 4 (9.76) 7 (15.91) 2 (28.58) 14 (11.86)
Guardian living
together - 2 (9.52) 3 (7.32) 6 (13.64) 2 (28.58) 13 (11.40)
Table 4.
Table 4. Comparison on awareness of dental implant insurance recipiency by the age group (N=118)
Feature N (%)
Age Under 60 60s 70s 80s 90s and older Total p-value
Insurance
recipiency Living condition 2 (40.00) 7 (31.82) 5 (12.20) 16 (36.36) 3 (42.86) 33 (27.97)
0.383 Age 65 years and
higher
2 (40.00) 12 (54.55) 31 (75.61) 21 (47.73) 3 (42.86) 69 (58.48) Disabilities in
movement
1 (20.00) 1 (4.55) 2 (4.88) 5 (11.36) 1 (14.29) 10 (8.47)
Others - 1 (4.55) 3 (7.32) 2 (4.55) - 6 (5.08)
Opinion on insurance
Exceptional - 4 (19.05) 3 (9.76) 3 (6.82) - 10 (8.47)
0.002
Good 1 (20.00) - 13 (31.71) 10 (22.73) 1 (14.29) 25 (21.19)
Mediocre 3 (60.00) 16 (76.19) 21 (51.22) 22 (50.00) 1 (14.29) 63 (53.39) Not interested 1 (20.00) 1 (4.76) 4 (9.76) 9 (20.45) 5 (71.43) 20 (16.95)
Post hoc result abc a b bc c
JOURNAL OF TECHNOLOGIC DENTISTRY
J TD
age groups, except for those in the age 90 years old and older, considered the accessibility of public transportation as the most important facet. For those over the age of 90, approach- ability with their guardian was the most at 57.14%. For the questionnaire asking what is important in the selection criteria of dental hospitals and clinics, all age group answered the skill of dentists as the most important factor.
The most suitable distance for dental hospitals and clinics was within 1 hour for those under 60 and those in 60s, with 80.0% and 52.38%, respectively, and within 30 minutes for those in 70s, in 80s, and over 90, respectively, 46.34%, 45.45%
and 71.43%.
In terms of building conditions for dental hospitals and clin- ics, those under the age of 60 and older than 90 preferred the dental hospitals and clinics located on the first floor, with 60.0% and 85.71%, respectively, showing the most preference, whereas those in 60s, 70s, and 80s, the most common answer was that it did not matter as long as there is an elevator with the percentages of 76.19%, 58.54%, and 77.27%, respectively.
There was a significant difference in the preference by age in the building conditions of dental hospitals and clinics (p<0.05;
Table 5).
DISCUSSION
One of the most common oral health problems for the el- derly is tooth loss, which not only reduces chewing ability, but also has a major impact on overall health, as it can lead to a decrease in the quality of life, so it is important to restore the function of teeth [8,9]. Implants or dentures are mainly per- formed on the elderly to restore the function of their teeth. The preference for implants is continuously growing over dentures, and from the case of the elderly with implants, the mastication ability was higher than that of the elderly with dentures, and the satisfaction relates to quality of life related to oral health was high [1,8]. Therefore, in order to improve the accessibility of dental care for the elderly, the government expands the in- surance coverage on denture benefits and introduces implants for the elderly. Despite these efforts, there are still elderly peo- ple from the vulnerable class who do not receive the benefits of the expanding insurance coverage policy due to high co- payments and narrow service spectrum [2].
Table 5.
Table 5. Selection of hospitals and clinics by age (N=118)
Feature N (%)
Age Under 60 60s 70s 80s 90s and older Total p-value
Preferred location
Vicinity of Hongseong-gun
2 (40.00) 6 (28.57) 19 (46.34) 20 (45.45) 6 (85.71) 53 (44.92)
0.218 Cities other
than Hongseong-gun
2 (40.00) 6 (28.57) 6 (14.63) 6 (13.64) 1 (14.29) 21 (17.80)
Doesn't matter 1 (20.00) 9 (42.86) 16 (39.02) 18 (40.91) - 44 (37.29)
Location requirements
Recommended by acquaintances
1 (20.00) 5 (23.81) 19 (46.34) 15 (34.10) 1 (14.29) 46 (38.98)
0.094 Near residence 2 (40.00) 13 (61.90) 13 (31.71) 26 (59.10) 5 (71.43) 59 (50.00)
Avoiding poor surgeon 2 (40.00) 3 (14.29) 9 (21.95) 3 (6.82) 1 (14.29) 18 (15.25) Surrounding
requirements Accessibility of
public transport 4 (80.00) 17 (80.95) 28 (68.29) 30 (68.18) 3 (42.86) 82 (69.49)
0.533 Proximity to guardian 1 (20.00) 4 (19.05) 12 (29.27) 11 (25.00) 4 (57.14) 32 (27.19)
Other - - 1 (2.44) 3 (6.81) - 4 (3.39)
Selection requirements
Dentist's skills 3 (60.00) 15 (71.43) 32 (78.05) 30 (68.18) 4 (57.14) 84 (71.19)
0.885 Treatment cost 2 (40.00) 6 (28.57) 9 (21.95) 13 (29.55) 3 (42.86) 33 (27.97)
Other - - - 1 (2.27) - 1 (0.84)
Proper distance Within 30 minutes 1 (20.00) 5 (23.81) 19 (46.34) 20 (45.45) 5 (71.43) 50 (42.37)
0.277 Within 1 hour 4 (80.00) 11 (52.38) 16 (39.02) 16 (36.36) 2 (28.57) 49 (41.53)
Doesn't matter - 5 (23.81) 6 (14.63) 8 (18.18) - 19 (16.10)
Building
requirements First floor 3 (60.00) 4 (19.05) 16 (39.02) 10 (22.73) 6 (85.71) 39 (33.05)
0.002
Second floor 1 (20.00) 1 (5.76) 1 (2.44) - - 3 (2.54)
Doesn't matter if there is an elevator
1 (20.00) 16 (76.19) 24 (58.54) 34 (77.27) 1 (14.29) 76 (64.41)
Post hoc result ab ac abc c d
Min Soo Han, et al: Awareness of dental implant insurance recipiency of elderly patients
Thus, this study was designed to study the elderly living in Hongseong-gun, Chungcheongnam-do, South Korea where there is a large elderly population to understand their percep- tion of dental implant insurance supply and demand, to inves- tigate their criteria for selecting dental hospitals and clinics for the dental implant treatment, and from those data, to improve oral health of elderly patients by providing great medical ser- vices. In the age-specific insurance dental implant percep- tions, the age group in 70s was interested in or thought about implants appeared the most, and this was due to the implant insurance coverage began the recipient age of 75 years or old- er in 2014 and later limited to those over the age of 65 years and older. In the case of dental implants, unlike dentures, sur- gical operation is necessary. But there are some adversities for the recipients when majority of the elderly experiences vari- ous diseases, and their alveolar bone condition is also in poor;
and when it is difficult to access a dentist who can perform an implant procedure [10]. However, if the dental implant cover- age extends by lowering the age group, various problems may arise in elderly oral care as they may prefer implants rather than maintaining teeth and using dental prosthetics [1]. In this regard, a more in-depth discussion is needed to decide the recipient age for the dental implant coverage, to establish a guideline to manage dental hospitals and clinics and a qual- ity control plan to provide appropriate dental implants and a quality management plan has been established for the patient [11].
In this study, as for insurance dental implant surgery, the majority of those aged 60 years or older had experience with surgery, and those who were 70 years or older had no expe- rience with implant surgery. Dental implants in Korea have grown rapidly since the late 2000s and are in the spotlight as a treatment with a very high success rate, but implant failures are also being reported steadily due to various factors [12,13].
The most common reason for the all groups of subjects’ dental implant surgery was to eat healthy food.
The mastication ability is one of the important factors of good oral health, and it has great influence on preserving overall health due to it helps nutritional intake, and thus im- prove the quality of life. Therefore, it is not possible to main- tain health and stamina when there is discomfort in mastica- tion, which can lead a person to narrow-down one’s choice of food intake and lower the amount of food intake and quality,
directly affects the quality of life by depriving a person’s hap- piness [14,15]. As one gets older, one’s overall health weakens, and is more likely to be easily exposed to various diseases [16].
In general, the disease incidence rate of the elderly is two to three times higher than that of the non-elderly, and they suf- fer from chronic diseases, and the resulting medical costs are relatively high [17]. However, the study by Ryu and Jeon [18]
points out that the overall utilization rate is not high due to the still high 30% health insurance out-of-pocket expenses, and the contribution to the expansion of dental health insurance coverage is not clear. Despite the expansion of dental implant health insurance coverage, the overall usage rate is not high, and in some cases, the cost per user is high, which puts a fi- nancial burden on the National Health Insurance Corporation, raising concerns about cost effectiveness [18]. Consequently, it is necessary to discuss about cost-effectiveness of the plan.
The criteria for selecting a dental hospital or clinic for an implant surgery was preferred when located in the vicinity of Hongseong-gun, was accessible by public transportation, and near one’s residence was the most common. It is consistent with studies that the physically vulnerable group has a high dependence on public transportation when using medical services, and the elderly group will have higher housing utility when one’s place is well-established with transportation ser- vice due to physical agedness [19].
In order to promote the oral health of the elderly, the Na-
tional Health Insurance Service has been making an effort to
improve accessibility of dental care for the elderly by covering
dentures and implant for the elderly as insurance. However,
in the case of oral disease, the health insurance coverage rate
is lower than that of non-oral diseases, and the proportion of
items that are not covered during dental treatment is high, the
financial burden on the patient surges for medical expenses
[20]. In addition, there are many institutional limitations in
restoring and maintaining lost teeth. When a large number of
teeth are lost, there is a burden to use dental procedures at
high cost, and there is also a lot of inequality in regards to oral
health within the social classes with various degrees of the
economic stability. Consequently, efforts to overcome these
issues and to raise awareness on oral health issues in Korea
should be continued.
JOURNAL OF TECHNOLOGIC DENTISTRY