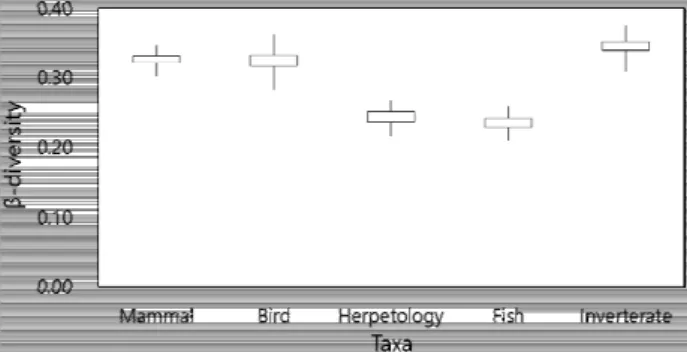
Fauna Diversity at the Deukjin River, Hapcheon-gun, Korea
5
0
0
전체 글
(2)
(3)
(4)
(5)
수치

관련 문서
Moving from Traditional Payment Rails to Payment Networks 73 Fiat Currency Stablecoins Create More Interoperability between Ecosystems 74 Cryptocurrency and
The lava field of the Hantangang River extends over Yeoncheon-gun, Gyeonggi-do, Pocheon-si and Cheorwon-gun, Gangwon-do, and extends about 110 kilometers, in the central part
This study suggested diversity in the configuration of expression through expression of abstract images, the style of modern painting, which are expressed
Purpose: This study was aimed to compare the functional outcomes of the continuous and discontinuous fractures, retrospectively, in multiple thoracolumbar
Further, in this course, students will learn all the capabilities necessary for the modeling of the practical fluid phenomena in the river and for the analysis
In the present study, 10 study stations were established, and seasonal changes for various ecological aspects of the community such as species composition, number of
For the discharge described in Example 5.5 2, calculate the equilibrium partial pressure of the chemical above the river at the discharge point Is volatilization from the
This is the research that studies conflicts over differences in learning patterns at work and school, which leads confusion and maladaptation to work place
