1. Introduction
Nowadays, the structural health monitoring (SHM) have been used to assess a real behavior of structures using different kinds of sensors to measure the full behaviors of structures. Sohn et al. (2002); You-Liang et al. (2015); Breuer et al, (2015); Seo et al, (2016) and Chen et al, (2014). The accelerometer and strain sensors are used to measure the acceleration and stress of structures members, respectively. The sampling frequency of the sensors is the main factor for the accuracy measurements of the structures performances. Therefore, in this study a 200 Hz sampling frequency used to assess a truss steel structure.
The time and frequency domains should be evaluated to assess the full behavior of structures under performance changes on the time. It is known that the main bridges over the Han river, in Korea, were constructed in the last century based on a different live loads that applied today. However, the monitoring system used to study the performance of those bridges under heavy loads. Koh et al. (2005) presented the SHM of bridges in Korea and
how the bridge health monitoring is developed.
Kaloop et al. (2016) used a short time SHM system to evaluate a high speed railway bridge.
Kim et al. (2014) evaluated high way bridge, steel box-girder, using SHM system and finite element models. Chang et al. (2009) utilized the SHM to evaluate a long span bridge and study the online monitoring system and how it can be used to evaluate the behavior of Namhae, Jindo and Dolsan Bridges. The Seong-Su bridge is evaluated in this study.
In order to evaluate the performance of the bridge in time, the wavelet and statistical analyses are used. The applications of evaluation of structures using these methods are presented in Taha et al. (2006); Arsava et al. (2013) and Mitchell et al. (2012). From these studies, it can be concluded that the wavelet and statistical analyses can be used to assess the performances of structures in time and frequency domains. In addition, the wavelet surpassed other methods into filtration high-noises data. The wavelet analysis can be used to classify the signals into short and long period components; therefore, the two components can be assessed and evaluated in
* Associate Professor, Public Works Engineering Dept, Mansoura University, Egypt, Corresponding author([email protected])
** M.Sc Course, Department of Civil and Environmental Engineering, Incheon National university, 22012, Republic of Korea.
*** Associate Professor, Department of Civil and Environmental Engineering, Incheon National university, 22012, Republic of Korea.
Performance Analysis of Bridge using Structural Health
Monitoring: Seong-Su Bridge Case-study
time and frequency domains. El-Sayed et al.
(2017) applied the wavelet analysis to estimate the performance of a railway bridge under high-speed trains. In the other hand, the statistical which included time series analyses is utilized to observe the structures changes along monitoring time. Ramadian et al. (2017) applied time series analyses to evaluate a continuous measurements data. Kaloop et al. (2016) and Van and Nishio (2015) are used the time series analyses to study the performance of long and short spans bridges, and they found that this method is a good to check the bridges
behaviors.
2. Bridge and SHM Descriptions Figure 1 show the Seong-Su bridge view and SHM system and case of bridge load. 41 sensors, displacement, stain and accelerometer, are used to monitor the performance of bridge span than presented in Figure 1 (a). Three sections are assessed and evaluated. The current study assesses the section A-A, as presented in Figure 1 (b). The truss s members are evaluated using SHM ʼ and static and dynamic loads affects. Figures 1
(a)
(b)
(c)
(d) (e)
Figure 1. (a) Total bridge view, (b) tested section, (c, d and e) section A-A monitoring system (D is displacement, S is strain, ACC is accelerometer)
(c), (d) and (e) show the SHM of section A-A.
Static and six s cases of static loads and truck s ʼ ʼ speeds from 20 to 60 Km/h are evaluated.
SHM system of the bridge is composed (Figure 2). Sensors are connected to a data acquisition device by wire. Measured data are digitized in AD converter and delivered through Bluetooth module and Access Point (AP) by wireless. The collected data are stored in SD memory and PC. A data acquisition device used in this research has one channel; each device was time synchronized by signal sender from PC each time. PC stores data in real time and controls the sensor nodes(data acquisition devices).
Figure 2. Structural Health Monitoring system composition
In the static case, six s cases are used as ʼ presented in Table 1. In this case, the truck is moved with 10 Km/h to measure the maximum response of bridge. Furthermore, the velocities 10 to 60 Km/h are used in the direction A2 to A1 in lane 2 to check the response of bridge in dynamic case.
Table 1. Static load cases
3. Results and Discussions
Figure 3 represents the static measurements of strain and displacement sensors of section A-A for case load LC3. In addition, Figure 4 illustrates the conclusion of strain and displacement performances of bridge points for static cases.
From Figure 3, it can be seen that the girder 5 (G5) has a maximum strain and displacement during two trucks are passed on the bridge. The maximum displacement is 3 mm and maximum strain is 35 µ s. in addition, the maximum responses that presented in figures 4 (a) and (b) for the strain and displacement, respectively, show that the maximum strain response is occurred with two cases, LC3 and LC6, at points S13 and S9, respectively.
(a)
(b)
Figure 3. Performance of bridge points of section A-A for the LC3 case, (a) strain, (b) displacement
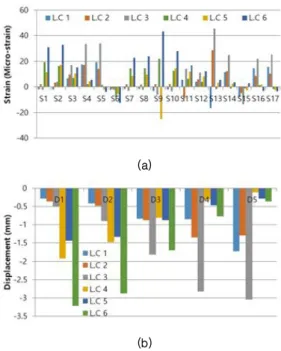
(a)
(b)
Figure 4. Static responses of bridge points for (a) strain and (b) displacement
The maximum strain was observed at strain point 13 is 45 s. in the other hand, the µ maximum displacement of five points of girders are exhibited in Figure 4.b; from this figure, it can be seen that the maximum displacement is shown at point D1 with case of load LC6, maximum displacement is 33 mm. from these results and previous monitoring results of this bridge, it can be concluded that the bridge is safe under static load effects.
For the dynamic evaluation, the dynamic factor is calculated using displacement measurements. The dynamic factor is a factor of dynamic response to static response of bridge deck. The wavelet is used to filter the data and Fast Fourier transformation (FFT) is used to estimate the frequency content of the acceleration measurements under dynamic loads affecting. Figure 5 represents the dynamic factor of five cases of dynamic loads, LC1(20 Km/h), LC2 (30 Km/h), LC3 (40 Km/h), LC4 (50 Km/h) and LC5 (60 Km/h), in addition, the acceleration measurements and frequency content for the section A-A under 20 Km/h are presented in Figure 6. Table 2 exhibits the observed frequencies for the five load cases of dynamic case.
From Figure 5, it can be shown that the maximum dynamic is occurred with load case 3 at points D1, 2 and 3; while at points 4 and 5 the maximum response of the dynamic is happened at cases 4 and 1, respectively. This reveals that the case 3 is more effective than other cases of loads. Here, it should be mentioned that the maximum dynamic factor is 0.084, while the design dynamic factor is 0.094; it meant that the bridge is safe under dynamic loads.
Figure 5. Dynamic factor of dynamic test
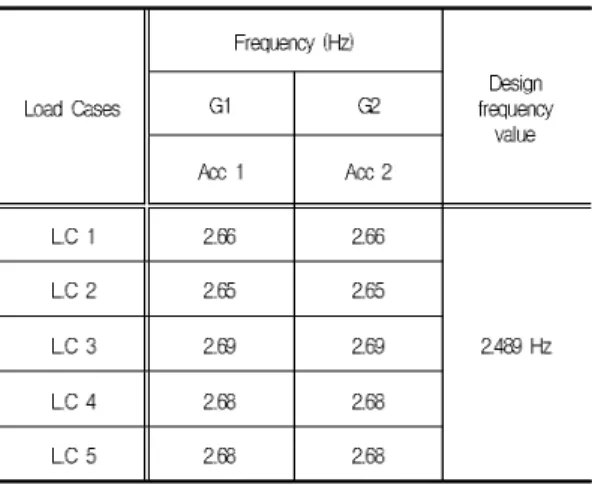
The frequency calculation shows that acceleration measurements are improved after wavelet denoises, also, the frequencies contents are more clear. The calculation frequency exhibits that the dominant frequency of bridge is about 2.68 Hz. The values of frequencies are very close and this indicates the bridge performance is safe and the durability of bridge is high. In addition, the observed frequency is seen higher than the design frequency of the bridge, it meant that the bridge is very safe under dynamic loads affecting.
(a)
(b)
Figure 6. Acceleration and FFT of bridge dynamic response for (a) G1 and (b) G2
Table 2. the frequencies contents of the bridge performance under dynamic loads effects