• 검색 결과가 없습니다.

Eco-efficiency of Energy Symbiosis for the Energy Network of Surplus Heat

N/A
N/A
Protected

Academic year: 2021

Share "Eco-efficiency of Energy Symbiosis for the Energy Network of Surplus Heat"

Copied!
9
0
0

로드 중.... (전체 텍스트 보기)

전체 글

(1)

Eco-efficiency of Energy Symbiosis for the Energy Network of Surplus Heat

Choon-Hwan Shin, Ji-Won Kim

1)*

Department of Energy & Environment, Dongseo University, Busan 607-716, Korea

1)

Institute for Environmental Technology and Industry, Pusan National University, Busan 609-735, Korea (Manuscript received 21 December, 2011; revised 2 February, 2012; accepted 22 March, 2012)

Abstract

Eco-efficiency considers both environmental impacts and economic values. It is a useful tool for communicating with stakeholders for business decision making. This study evaluated the eco-efficiency factor (EEF) for the energy network of a dyeing company that supplies surplus heat to a neighboring apartment during the night. This symbiosis network is one of the eco-industrial park (EIP) projects in Korea and aims to benefit local residents and the industrial complex by utilizing 
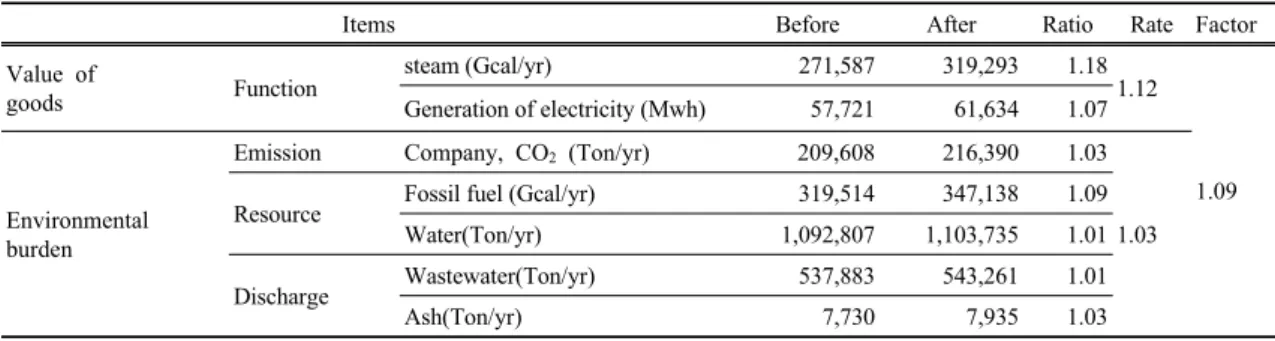
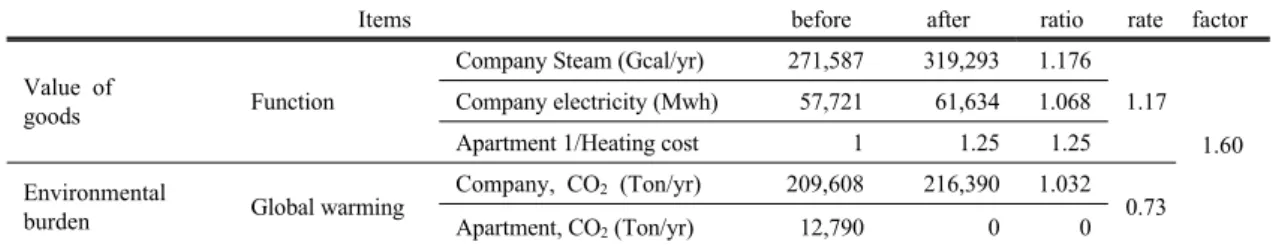
surplus heat. In this study, two categories were annualized. The first quantified environmental burden based on CO2

emissions and quantified product value in terms of steam sales. The second used a variety of environmental factors, such as fossil fuel, water and waste, to quantify environmental burden and used steam sales to quantify value. The EEF of the 
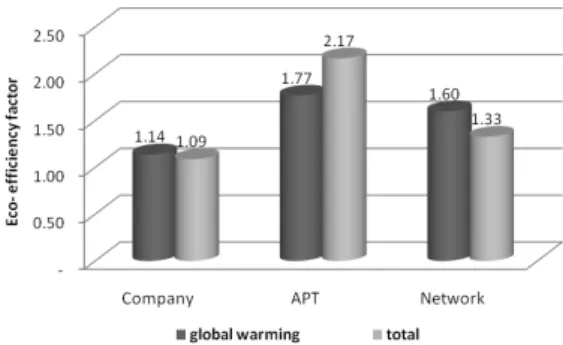
symbiosis network was 1.6, using the global warming impact, and determined using the multiple variable, was 1.33. This study shows that the EEF depends on variable details of environmental burden but the values of this project were very high contrast to other business or EIP project.

Key Words : Eco-efficiency, Industrial symbiosis, Eco-industrial park, District heating, Multiple variables

1)

1. Introduction

The lifestyle we enjoy in the twentieth century, thanks to mass production, mass consumption and mass disposal, has placed a heavy impact on the environment, which has resulted in a variety of critically dangerous circumstances, such as global warming, waste problems, water quality deterioration and the presence of harmful chemical substances. We should be considerate of not only economic benefits but also of environmental impacts of sustainable development. To evaluate the effect of production and environmental burden, the term eco-efficiency, the synthetic word of eco (ecology and economy) and

*Corresponding author : Ji-Won Kim, Institute for Environ- mental Technology and Industry, Busan 609-735, Korea Phone: +82-51-510-2496

E- mail: envjjang@nate.com

efficiency, was officially adopted at the earth summit in Rio de Janeiro, Brazil in 1992. Most commonly, eco-efficiency is defined as the ratio between the value added by and the environmental impact of a company’s operational processes (Schaltegger and Sturm, 1992; Helminen, 2000). It is defined as a combination of economic and environmental (ecological) efficiencies expressed by the ratio:

(1)

The eco-efficiency indicator is used by companies as a decision tool to measure the increasing performance of a product and the decreasing environmental impact.

It is a useful tool for monitoring sustainable

development; for example, if the environmental

(2)

impact is reduced by 50% and the economic production increases by a factor of 2, then the eco-efficiency becomes 4 times greater. In general, increasing the capacity or value added of production causes more environmental pollution. Therefore, strategies for sustainability need to be investigated. In the agricultural sector, the EE has been applied to evaluate several different environmental business strategies (Reith, 2001; Charles, 2003). To maximize EE, we should maximize the economic value (i.e., output variables) and minimize the environmental impact (i.e., input variables). Generally, interviews (Charles, 2003) or surveys (Charles, 2003) are used to help select the input and output variables. Then these variables can be qualitatively ranked and/or combined into overall eco-efficiency metrics (Charles, 2003).

Studies on power plants included input variables, such as capacity, labor, total costs, and GHG emissions, as well as output variables, such as sales revenue, generation, trading, and sales (Korhonen and Luptacik, 2004; Kim and Jo, 2000; Shim, 2010).

Most EEF values presented in those studies were less than 1. However, in the Yeosu industrial park, the industrial ecology indicator (IEI) for 2006 was 0.954, which was worse than the 2004 IEI, but the IEI is expected to be 1.153 by 2015 (a 15% improvement) if the current eco-industrial park (EIP) project is successfully performed (Kim et al., 2010). In another study, the global warming EE and the eutrophication EE were used as input variables, and a life cycle assessment (LCA) tool was applied (Kim et al., 2008). Often, eco-efficiency indicators are expressed in two different and recommended ways (WBCSD, 2000; Muller and Sturm, 2001). The WBCSD proposes net sales and quantity of production, whereas Muller and Sturm only acknowledge value added and net value added, as developed in their manual (Sturm et al., 2002). For the eco-efficiency concept to be effective, standardized cross-cutting indicators, such

as eco-efficiency, are needed (Erkko et al., 2005).

Some of the GRI Guidelines include eco-efficiency as a cross-cutting indicator (sustainability, 2002)

In this research, an eco-efficiency evaluation tool was applied to assess the sustainability of an eco- industrial park. To evaluate the overall eco-efficiency of the EIP, various methods were studied. For controlling enterprise access to an EIP, the reasonability and validity of indicators and the effectiveness of the established method of evaluation merit further study (Li Zhu, 2010). In addition, two indices, eco- connectance and the byproduct and waste recycling rate of selected EIPs, were analyzed with the aid of biological theories, and corresponding measures are put forward for planning EIPs in the future (Dai Tiejun, 2010). Another method links economic and ecological systems together, depicts the methodology of emergy analysis at the industrial park level and provides a contribution of ecological products and services as well as the load carrying capacity of economic and industrial development (Yong Geng, 2010).

In this industrial symbiosis, a single eco-efficiency environmental impact variable was chosen, GWP.

We also evaluated multiple variables, such as air, water and land emissions and resource depletion. The eco-industrial park focused on industrial symbiosis, such as exchange of waste and byproducts. It aims to reduce carbon by resource circulation. The Korean government has also initiated EIP projects that were based on a pilot project to model Korean industrial sites (Oh et al., 2005; Park et al., 2008). There are several drivers of the development of EIP, including financial considerations, geographical factors, government policies and legislation (Tudor et al., 2007). The economic and environmental feasibility of a multi- site utility network was studied for the construction of an EIP (Kim et al., 2010).

A combined heat & power (CHP) plant usually

acts as the anchor of a local EIP; elements of a local

(3)

industrial ecosystem are designed around it. The systematic evaluation of a CHP plant EIP has been analyzed by emergy (Lingmei, 2006). In this study, we investigate the EEF of a district heating business that supplies surplus heat from a dyeing industry CHP plant to an apartment building during the night.

This is one of the eco-industrial park projects in Busan, Korea. If this project succeeds, then the apartment will no longer use fossil fuel. In addition, the CHP plant will gain benefits from the use of surplus steam during the night and during the day.

The resulting eco-efficiency was expected to be greater than 1 when we compared each side’s EE and the EE of the combined network. We also calculated how many environmental impact variables affected the product values, such as the sales of steam and the generation of electricity.

2. Methodology

2.1. Eco-efficiency factor

The eco-efficiency indicator evaluates the overall environment behavior and economics of a product and was developed to be implemented with many different inputs and output variables according to different product characteristics. This tool can be utilized as an indicator of the green growth policy to minimize the environmental impact based on efficiency and intensity of resource utilization. If the process for making a product has multiple inputs and outputs, then the calculation of aggregate input and output, by applying weighting factors, is needed. The equation of EE is expressed by the following ratio (Kim et al., 2010):

(2)

where EE: eco-efficiency

x: input variables (environmental impacts)

y: output variables (economic values or function of goods)

A vector value should be calculated because multiple variables for economic value and environmental impact should be considered. Economic performance is sometimes based on the notion of opportunity costs (Tobias, 2010), but in this case, we considered energy (calories) and, product sales. The economic value can also be based on a functioning vector of goods (company) that is combined using functioning rates and weighting factors. Likewise, the environmental impact vector includes the environmental impact rate and weight factor. In this case, the functioning and environmental rates are the ratio of the comparison value at the point of each basis and the variable that was applied equally without the weighting factor.

(3)

(4)

2.2. Industrial symbioses

A community of companies can generate significant sustainable development benefits (Lowe and Geng, 2003). The Busan Fashion Color Industry Cooperative (BFCIC) supplied steam to the Busan Fashion Color Industrial Park (BFCIP), which consists of 50 companies related to the dyeing and fiber industries.

BFCIC operates a CHP plant and a wastewater

treatment plant to provide efficient energy and

wastewater treatment for reducing the cost of the

companies in the BFCIP. The capacity of the CHP is

308 ton/hr of coal fluidized bed combustion (CFBC)

and the 19,000 kwh of electricity. The capacity of the

wastewater treatment plant is 30,000m

3

/day. The

(4)

BFCIC makes every effort to save energy cost, such as developing refuse plastic fuel (RPF) for mixed fuel burning with coal and receiving steam from a nearby incineration company; a partnership that resulted from the first EIP feasibility study funded by the government in 2006. However, as the domestic dyeing industry is declining and moving to China, the operation rate in the nighttime was reduced.

Therefore, a lot of steam was vented from the stack into the air at night.

A CHP using coal has a baseline load that reduces the startup loading demand. In the daytime, the steam users (i.e., dyeing and fiber companies) consume most of the steam produced, approximately 120 ton/hr but during the night, only 20 ton/hr were required despite the baseline load of 50 ton/hr.

Therefore, about 39,600 Gcal of steam energy was wasted every year. However, a residential apartment building has higher energy needs during the night.

There is an apartment building with 4,726 households, 1.5km away from the CHP plant, that needed about 59,663 Gcal/yr of heating energy.

Therefore, this industrial symbiosis, surplus steam going from the CHP to the apartment during the night, was adopted in the Busan eco-industrial park project in 2011.

2.3. The heat balance between households and the CHP plant

The households use LNG and most of their energy during the winter (Fig.1). The surplus steam in the BFCIC can supply a minimum of 33% of the apartment energy needs during the winter by supplying steam to the existing, central heating system (Fig. 1). Switching to a new heating system using district heat reduced energy losses in the existing central heating system, due to the low efficiency of the old boiler, by about 30%. This improvement was mainly because the new district heating system did not need to boil whenever the

heating system was started. The CHP plant can always provide hot water directly. The new district heating system using waste heat experiences pipeline losses of about 5~10% to the outdoors. Therefore, the real heating energy needs of the new system will be decreased by about 20% of the current energy demand. The heat balance at night, supposing the heating ratio of day and night is 2:8 in the apartment and supposing that surplus steam is provided from the CHP plant to the residence only during the night is shown in Fig. 2. The minimum ratio of the steam supply is about 50% during the winter and the annual steam supply to apartment during the night is about 63%.

Fig. 1. The total energy balance before this project.

Fig. 2. The energy balance during the night through this

project.

2.4. Additional energy supply for the complete network

During winter nights, the deficient steam to the

households will be supplied by coal and RPF

combustion at the CHP plant. The LNG boiler will be

operated year-round during the day because the

(5)

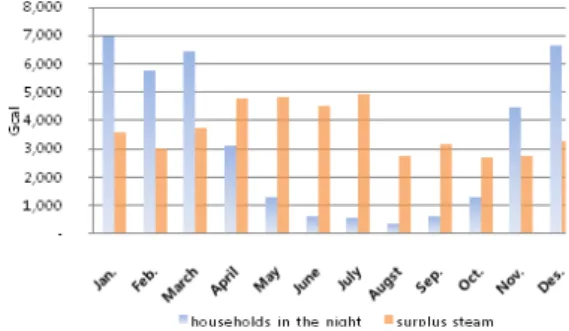
surplus steam is not transferred to the apartment during the day (Fig.3). Therefore, carbon dioxide emissions are increased with these fossil fuels for in the district heating configuration, even if it is lower than before this EIP project began (Fig.4).

Fig. 3. The additive use of the fossil fuel.

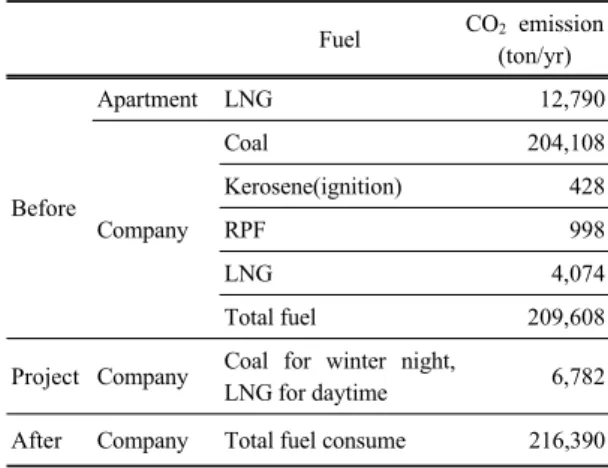
Fig. 4. The comparison of CO

2 emission.

3. Results and Discussion

3.1. The global warming eco-efficiency factor This EIP network promotes additional steam sales (to the apartment building as well as to the dyeing companies), which has an economic benefit for the company. However, the EIP also creates an additional environmental burden in terms of CO

2

(Tables 1-2).

The efficiency considerations play an important role in evaluating corporate carbon performance (Hoffmann and Busch, 2008). To calculate CO

2

emissions, various fossil fuels that are used in the CHP plant, such as coal, kerosene, RPF and LNG, were considered as input variables before the project. Coal for the winter nights and LNG for year round daytime

use were considered as input variables after the project. To obtain the EE of the CHP plant, the economic benefit (based on calories) was as selected steam sales, and CO

2

was used to assess the environmental burden.

Table 1. Steam sales from the CHP plant before and after

the EIP project

Items Steam sales

(Gcal/yr) Before Sales for dyeing company 271,587

Project

Surplus steam in the night 24,226 Additive supply in the night (winter) 13,939

Additive supply in the daytime

(all year) 9,541

Total sales for apartment 47,706

After Total steam sales 319,293

Table 2. CO

2 from various fossil fuels before and after the EIP project

Fuel CO

2

emission (ton/yr)

Before

Apartment LNG 12,790

Company

Coal 204,108

Kerosene(ignition) 428

RPF 998

LNG 4,074

Total fuel 209,608

Project Company Coal for winter night,

LNG for daytime 6,782

After Company Total fuel consume 216,390

The eco-efficiency factors of the company and the apartment building were 1.14 and 1.77, respectively, as shown in Table 3. These values are very high;

therefore, this project can be considered to be

sustainable development. In the case of the

(6)

Company Apartment

Items Before After Ratio Items Before After Ratio

Economic value

Steam sales

(Gcal / yr) 271,587 319,293 1.18

Energy consumption (Gcal / yr)

59,633 47,706 0.8

Environmental Impact

CO

2

emission

(Ton/yr) 209,608 216,390 1.03 CO

2

emission

(Ton/yr) 12,790 0 0

Eco-efficiency Factor 1.14 1.77

Table 3. Eco-efficiency factors for global warming

Items Before After Ratio Rate Factor

Value of

goods Function steam (Gcal/yr) 271,587 319,293 1.18

1.12

1.09 Generation of electricity (Mwh) 57,721 61,634 1.07

Environmental burden

Emission Company, CO

2

(Ton/yr) 209,608 216,390 1.03

Resource Fossil fuel (Gcal/yr) 319,514 347,138 1.09 1.03

Water(Ton/yr) 1,092,807 1,103,735 1.01

Discharge Wastewater(Ton/yr) 537,883 543,261 1.01

Ash(Ton/yr) 7,730 7,935 1.03

Table 4. The eco-efficiency factor based on applying multiple variables for the company apartments, the heating cost reduction is an economic

benefit. It is fixed to the denominator, meaning that it represents energy savings through the efficient heating system. Therefore, the apartment building has no CO

2

emissions when using steam directly instead of LNG; this reduces fossil fuel burning in additional to saving energy.

]

3.2. The eco-efficiency factor using multiple variables

This industrial symbiosis is related not only to fossil fuels but also to other resources, polluted emissions and economic values. Therefore, the economic electricity benefit as well as the CHP steam can be considered and the environmental burden can be evaluated using industrial water for the steam,

wastewater and waste treatment. Table 4-5 show the calculation applied multiple variables. The output variables or economic benefits considered the additive generation of electricity (110kw per ton of steam produced). Industrial water (151% of the quantity of steam), waste water for pure water production (49% of the industrial water), ash from coal combustion, and CO

2

were considered as environmental burdens. In the case of the apartments, the item of the fossil fuel consumption as environmental burden was additive besides CO

2

emission but the value was decreased to zero after

project, therefore the EEF was increased to 2.17. And

the EEF for the company, considering multiple

variables, was 1.09, which is less than that of the

single variable, 1.14. This is because only electricity

was considered to be an additional benefit, but many

more environmental influences, such as fossil fuel,

water and waste, were included.

(7)

Items before after ratio factor Value of

goods Function Heating Cost

(Billion won) 4.59 3.66 0.8

Environmental 2.17 burden

Emission CO

2

(Ton/yr) 12,790 0 0

Resource Fossil fuel(Gcal/yr) 59,633 0 0

Table 5. The eco-efficiency factor based on applying multiple variables for the apartment

Items before after ratio rate factor

Value of

goods Function

Company Steam (Gcal/yr) 271,587 319,293 1.176 1.17

1.60 Company electricity (Mwh) 57,721 61,634 1.068

Apartment 1/Heating cost 1 1.25 1.25

Environmental

burden Global warming Company, CO

2

(Ton/yr) 209,608 216,390 1.032 Apartment, CO

2

(Ton/yr) 12,790 0 0 0.73 Table 6. The eco-efficiency factor of global warming for the industrial symbiosis network

Items before after ratio rate factor

Value of

goods Function

Company Steam (Gcal/yr) 271,587 319,293 1.18 1.17

1.33 Company electricity (Mwh) 57,721 61,634 1.07

Apartment 1/Heating cost 1 1.25 1.25

Environmental burden

Emission Company, CO

2

(Ton/yr) 209,608 216,390 1.03

0.88

Apartment, CO

2

(Ton/yr) 12,790 0 0

Resource

Company Water (Ton/yr) 1,092,807 1,103,735 1.01 Company Fossil fuel (Gcal/yr) 319,514 347,138 1.09 Apartment Fossil fuel(Gcal/yr) 59,633 0 0

Discharge Wastewater (Ton/yr) 184,975 193,869 1.5

Ash (Ton/yr) 7,730 7,935 1.03

Table 7. The eco-efficiency factor for the industrial symbiosis network 3.3. The eco-efficiency factor industrial symbiosis

network

Generally, the EEF is used by companies to assess sustainable development. In this case, it was used to calculate for the impact of the total industrial symbiosis network to assess the sustainability of this project. Therefore, input and output variables for the company and the apartment building were considered at the same time. As a result, the CO

2

emissions and the energy consumption of the apartment were transferred to the company but the quantity was decreased. The total value of the environmental

burden, which was decreased by 0.73, and the economic benefit was increased at the both side, company and apartment. Therefore, the EEF of the symbiosis network was increased by 1.6(Table 6).

And the EEF including multiple variables was

1.33(Table 7). These values are also very high

compared to general power plant developments

(Shim, 2010) and another eco-industrial park project

in Korea (Kim et al., 2010).

(8)

Fig. 5. Eco-efficiency factor according to the variable details.

4. Conclusion

This study applied the eco-efficiency tool to better understand the environmental factors associated with the industrial symbiosis between a CHP plant and a neighboring residential complex. The global warming EEF, considering only CO

2

emission as environmental impact, in the CHP plant and the apartment buildings were 1.14 and 1.77, respectively. This high EEF value is due to substantial fossil fuel savings for the apartment building heating system by utilizing surplus heat from the CHP during the night.

However, when multiple input and output variables were considered, the EEF value of company was reduced to 1.09 and the value of apartment building was increased to 2.17. The beneficiary (the apartment building) had no additional environmental burden variables, but the company (the steam supplier) produced more environmental impacts and used more resources, such as fossil fuel and industrial water, for the complete network. Additionally, the EEF of the symbiosis network, considering both sides, was 1.6 for single variable, global warming, and 1.33 for multiple variables, respectively. This study shows that the global warming EEF is probably overestimated given the result for the analysis including multiple variables. Therefore, the value of the EEF depends on the details of the evaluation of the environmental impact. But, this EIP project has

very high potential of the sustainable development.

Subsequent research will use life cycle assessment tools to assess the environmental burden and the weighting factors of the environmental impact variables.

Acknowledgments

This research was supported by the Eco Industrial Park (EIP) development program, which is supported by the Korea Industrial Complex Corporation (KICOX) and the Ministry of Knowledge Economy (MKE) and also supported by the 2011 research fund of Dongseo University.

References

A guide to reporting company performance, 2004, Geneva, WBCSD.

Charles, C., Reith, M., Guidry, J., 2003, Eco- efficiency analysis of an agricultural research complex, Journal of Environmental Management, 68, 219-229.

Dai, T., 2010, Two quantitative indices for the planning and evaluation of eco-industrial parks, Resources, Conservation and Recycling, 54, 442-448.

Helminen, R. -R., 2000, Developing tangible measures for eco-efficiency: the case of the Finnish and Swedish pulp and paper industry, Business Strategy and the Environment, 9(3), 196-210.

Hoffmann, V. H., Busch, T., 2008, Corporate carbon performance indicators, Journal of Industrial Ecology, 12(4), 505-520.

Shim, H. S., 2010, An Eco-Efficiency Evaluation in terms of Green House Gas Emission for the Korean Fossil Fuel-fired Power Generation Industry, Master's Thesis, Ajou University, Korea.

Kim, J. I., Yun, C. H., Yoon, H. S., 2010, Development of Eco- efficiency Indicators for Yeosu Industrial Park, Clean Technology, 16(3), 229-237.

Korhonen, L., 2004, Eco-efficiency analysis of power

plants: An extension of data envelopment analysis,

European Journal of Operational Research, 154,

(9)

437-446.

Korhonen, L., European, J., 2004, Operational Research, 154, 437-446.

Wang, L., Li, W., Li, Z., 2006, Emergy evaluation of combined heat and power plant eco-industrial park (CHP plant EIP), Resources, Conservation and Recycling, 48, 56-70.

Li, Z., Jianren, Z., Cui, Z., Lei, L., 2010, A method for controlling enterprises access to an eco-industrial park, Science of the Total Environment, 408, 4817-4825.

Lowe, E., Geng, Y., 2003, Industrial ecology and eco-industrial park. Beijing, Chemical Industrial Press.

Muller, K., Sturm, A., 2001, Standardized eco-efficiency indicators report 1, concept paper, Rev. 1.05/Jan.

Oh, D. S., Kim, K. B., Jeong, S. Y., 2005, Eco-industrial park design: a daedeok technovalley case study, Habitat International, 29, 269-284.

Park, H., Rene, E. R., 2008, Strategies for sustainable development of industrial park in Ulsan, South Korea - from spontaneous evolution to systematic expansion of industrial symbiosis, Journal of Environmental Management, 87, 1-13.

Reith, C. C., 2001, Application of environmental business models to the agricultural sector: the model sustainable agricultural complex Corporate Environmental Strategy, 8 (1).

Kim, S. H., Yoon, S. G., Chae, S. H., Park, S. W., 2010, Economic and environmental optimization of a multi-site utility network for an industrial complex,

Journal of Environmental Management, 91, 690-705.

Schaltegger, S., Sturm, A., 1992, Ökologieorientierte Entscheidungen in Unternehmen: ökologisches Rechnungswesen statt Ökobilanzierung: Notwendigkeit, Kriterien, Konzepte, Haupt, Bern.

Erkko, S., Melanen, M., Mickwitz, P., 2005, Journal of Cleaner Production, 13, 799-813.

Kim, S. G., Kim, Y. J., Choi, J. H., Kim, I., Chung, T.

H., 2008, Proposal and Application of Eco- efficiency Indicator in Wastewater Treatment System, Korean society of water and wastewater conference in autumn.

Sturm, A., Muller, K., Upasena, S., 2001, a manual for preparers and users, Release 1.1/November.

Prepared for UNCTAD / Inter-governmental Working Group of Experts on ISAR.

Sustainability reporting guidelines, 2002, Boston:

Global Reporting Initiative.

Kim, T. U., Jo, S. H., 2000, Measuring Efficiency of Global Electricity Companies Using Data Envelopment Analysis Model, Environmental and Resource economics review, 9 (2) 2, 349-371.

Hahn,T., Figge, F., Liesen, A., Ralf, B., 2010, Opportunity cost based analysis of corporate eco-efficiency: A methodology and its application to the CO

2

-efficiency of German companies, Journal of Environmental Management, 91.

Geng, Y., Zhang, P., Ulgiati, S., Sarkis, J., 2010,

Emergy analysis of an industrial park: The case of

Dalian, China, Science of the Total Environment,

408, 5273-5283.

수치

Fig. 2. The energy balance during the night through this  project.
Table 2. CO 2  from various fossil fuels before and after the  EIP project Fuel CO 2  emission  (ton/yr) Before Apartment LNG  12,790 Company Coal 204,108Kerosene(ignition)   428RPF   998 LNG   4,074 Total fuel 209,608
Table  4. The eco-efficiency factor based on applying multiple variables for the companyapartments, the heating cost reduction is an economic
Table 7. The eco-efficiency factor for the industrial symbiosis network3.3. The eco-efficiency factor industrial symbiosis
+2

참조

관련 문서

The key issue is whether HTS can be defined as the 6th generation of violent extremism. That is, whether it will first safely settle as a locally embedded group

1 John Owen, Justification by Faith Alone, in The Works of John Owen, ed. John Bolt, trans. Scott Clark, "Do This and Live: Christ's Active Obedience as the

The world is facing environmental problems such as global warming due to the excessive use of fossil energy and energy issues, expanding the use and de-

Five days later, on 15 January 1975, the Portuguese government signed an agreement with the MPLA, FNLA and UNITA providing for Angola to receive its independence on 11

웹 표준을 지원하는 플랫폼에서 큰 수정없이 실행 가능함 패키징을 통해 다양한 기기를 위한 앱을 작성할 수 있음 네이티브 앱과

_____ culture appears to be attractive (도시의) to the

If the volume of the system is increased at constant temperature, there should be no change in internal energy: since temperature remains constant, the kinetic

The internal energy can be changed even when no energy is transferred by heat, but just