Determination of Focal Laws for Ultrasonic Phased Array Testing of Dissimilar Metal Welds
Ye Jing*✝, Hak-Joon Kim*, Sung-Jin Song*, Myung-Ho Song**, Suk-Chull Kang**, Sung-Sik Kang**
and Kyungcho Kim**
Abstract Inspection of dissimilar metal welds using phased array ultrasound is not easy at all, because crystalline structure of dissimilar metal welds cause deviation and splitting of the ultrasonic beams. Thus, in order to have focusing and/or steering phased array beams in dissimilar metal welds, proper time delays should be determined by ray tracing. In this paper, we proposed an effective approach to solve this difficult problem.
Specifically, we modify the Oglivy’s model parameters to describe the crystalline structure of real dissimilar metal welds in a fabricated specimen. And then, we calculate the proper time delay and incident angle of linear phased array transducer in the anisotropic and inhomogeneous material for focusing and/or steering phased array ultrasonic beams on the desired position.
Keywords: Dissimilar Metal Welds, Crystalline Structure, Phased Array, Focal Law, Time Delay
Received: May 2, 2008, Revised: August 1, 2008, Accepted: August 8, 2008 * School of Mechanical Engineering, Sungkyun- kwan University, 300 Chunchun-dong, Jangan-gu 440-746, Korea, ** Korea Institute of Nuclear Safety, Daejeon 305-338, Korea, ✝ Corresponding Author: (E-mail: [email protected])
[논 문] - 비 파괴검 사학회 지 Journal of the Korean Society for Nondestructive Testing Vol. 28, No. 5 (2008. 10)
1. Introduction
Dissimilar metal welds are used throughout nuclear power plants wherever a ferritic material is joined to an austenitic material such as reactor vessel safe end welds, control rod drive mechanism (CRDM) joint welds and etc.
Dissimilar metal welds typically consists of a stainless steel filler material, such as a high temperature Ni‐Cr butter layer applied to the carbon steel interface, surrounded by carbon steel and stainless steel base materials. Dissimilar metal welds have long been identified as a difficult component to test using ultrasonic techniques, due primarily to the anisotropic nature of the weldments and large grain size (Oglivy, 1985). Especially, attenuation of high frequency ultrasound, backscattering noise
associated with grain boundary reflections and beam redirection in weld materials and solidification boundaries are major causes of difficulties in the ultrasonic testing. In order to address such a difficulty in ultrasonic inspection of dissimilar metal welds, many research works have been carried out for describing the solidification structures and its effects on propagation of ultrasonic waves (Anderson et al., 2004, Oglivy, 1985, Spies, 2000).
Recently, ultrasonic phased array testing are increasingly adopted for inspection of dissimilar metal welds, since it can improve probability of detections (PODs) and sensitivity in defects locating in attenuative media and specimens with complex curvatures (Buttram, 2007). However, to apply phased array ultrasonic testing for inspection of austenitic weldments, proper time
Fig. 1 Macro‐photo of dissimilar metal welds (an austenitic steel weldment)
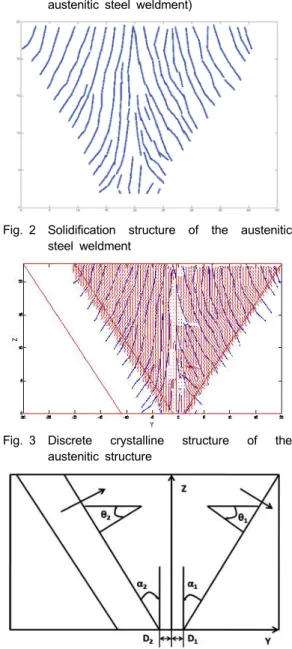
Fig. 2 Solidification structure of the austenitic steel weldment
Fig. 3 Discrete crystalline structure of the austenitic structure
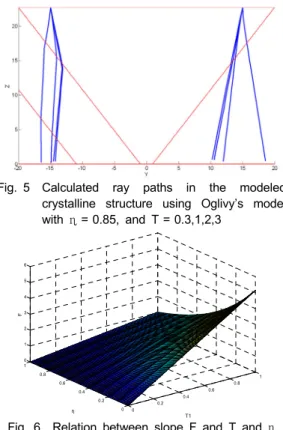
Fig. 4 Definition of parameters used to describe the grain structure within a V‐butt weld in Oglivy’s model
delays for focusing and/or steering ultrasonic beams on a desired position through anisotropic and inhomogeneous medium are needed.
So, in this study, to determine proper time delays for focusing and/or steering ultrasonic beams, we apply ray tracing method (Oglivy, 1985, Oglivy, 1990) for phased array ultrasonic testing in austenitic steel weldments, which is one type of dissimilar metal welds using a model for describing crystalline structures of austenitic weld structures by modification of the Ogilvy model (Oglivy, 1985) based on the real crystalline structures of austenitic weldments.
Here, performance of the proposed crystalline structure model is validated by comparison of ray tracing results based on the real structures.
And, optimal time delays for focusing and/or steering ultrasonic beams in the specimen are calculated.
2. Crystalline Structure Modeling
Fig. 1 shows a macro‐photo of a cross‐
section of dissimilar metal welds in a specimen fabricated for this study. The dissimilar metal welds investigated here consist of four parts: a carbon steel part, a buttering layer, an austenitic steel weld part, and a stainless steel part. To get the information of real structure of weldments as shown in Fig. 1, we applied the following procedures:1) draw the crystalline orientation in every grid based on the macro‐photo and 2) apply edge detection, dilating, filling and skeleton methods to get rough crystalline structure of the specimens and 3) link the edge pixel to straight line, then 4) interpolate between the two dots of one line given the information of location and 5) calculate the slope as well.
And finally 6) fill the every grid with the value of slope to get crystalline structure of the specimen in detail. Fig. 2 and Fig. 3 show the solidification structure and discrete crystalline structure obtained from the macro‐photo, respectively.
Fig. 5 Calculated ray paths in the modeled crystalline structure using Oglivy’s model with η = 0.85, and T = 0.3,1,2,3
0 0.2
0.4 0.6
0.8 1
0 0.2 0.4 0.6 0.8 1 0 1 2 3 4 5 6
η T1
F
Fig. 6 Relation between slope F and T and η To model the crystalline structure of the
austenitic weldments, several models were proposed by previous researchers (Chassignole et al., 2000, Becache et al., 2000, Apfel et al., 2004). Among the models, a mathematical function defined in eqn.(1) proposed by Ogilvy has been widely used for modeling the crystalline structure of austenitic weldments (Oglivy, 1985). Fig. 4 shows the definition of parameters used to describe the crystalline structure within a V‐butt weld in the Oglivy’s model. In the Oglivy’s model, T and η play an important role in determining the slope angle, which will affect the ray paths. This model, which is symmetric with respect to center line of the weldments, was proposed with parameters:
T1= ‐T2= ‐0.3, η = 0.85, and later a better modeling is obtained with T1= ‐T2= ‐2 and η
= 0.9 (Apfel, et al., 2004).
+ <
= + >
=
=
| 0
|
| ) tan (
tan |
) 0 tan tan (
) , (
2 2
2 2
1 1
1 1
y y z D T
y y z D T z
y F
η η
θ α θ α
(1)
To check the validation of the model, we compared the ray tracing results using Oglivy’s model with T1= ‐T2= ‐2, and η = 0.9 to the real structure obtained from Fig. 1. Fig. 5 and Fig. 7 show comparison of ray tracing results with different incident positions and angles using modeled crystalline structure and the one obtained from the macro‐photo.
Fig. 5 shows calculated ray paths in a modeled weld structure by Oglivy with different parameters. As shown in Fig. 5, the ray paths separate from each other significantly with the variation of T from 0.3 to 3, although their incident positions are same : x1= (‐20, 22.7) and x2= (20, 22.7), respectively and the same normal incident angle. The details in calculation of ray path are given in the next section. However, there is no obvious trend or rule of the ray path skewing with the increase of parameter T (T = |T1| = |T2|). So, choosing the right parameters for modeling crystalline structure of
austenitic weldments plays a very important role in ray tracing for determination of optimal inspection setups, especially in the calculation of ultrasonic beam coverage map at a given inspection setup. Thus, it is necessary to find out the effect of T and η on modeling the crystalline structure.
To find the relation between slope F of crystalline structures and T, η, we calculated the variation of slope F of crystalline structures by changing T andη from 0 to 1 and the step size is 0.01. At a point (5,5), increasing T with a fixed η makes crystalline orientation more vertical and the increasing η with a fixed T shows the reverse effect. But, we find that both T and η exert a strong influence on the structure as shown in Fig. 6. Therefore, to find the optimal combination of T and η is needed.
As shown in Fig. 7, the discrepancy of ray paths in between the real structure and Oglivy’s model with η = 0.9, T = 2 is acceptable when the incident point is x1= (‐18, 22.7), while there is a big discrepancy in ray paths in the case of
Fig. 7 Comparison of ray paths in the modeled crystalline structure using Oglivy’s model with η=0.9, T=2 and real structure, respectively
+ <
= + >
=
=
| 0
|
| ) tan (
tan |
) 0 tan tan (
) , (
2 1
2 2
2 2
1 1
1 1
y y z D T
y y z D T z
y F
η η
θ α θ α
(2)
Fig. 8 Calculated crystalline structure using modified model with the optimal parameters incident point, x2= (18, 22.7). This phenomenon
occurs due to the non‐symmetrical nature of the austenitic weldments. So a model that can take account of the non‐symmetrical nature of crystalline structures of the austenitic weldments is needed. In this study, we have modified the Oglivy’s model by splitting η into η1 and η2.
Since Oglivy’s model is based on a piecewise‐defined function, we can separate the whole crystallized structure into a left part and a right part. Different values to T1 and T2 can be assigned and splitting η into η1 and η2 where the parameter T1 and T2 are proportional to the tangents of the grain axes at the sloping edges;
the parameter η varies between 0 and 1, and η1
stands for the right part of measure of how fast the crystallized structure falls with an increase in y, while η2 represents for the left part. Eqn.(2) is the modified model for calculating crystallized structure of austenitic steel weldments.
To model crystalline structure of the real austenitic weldments, optimized parameters for T1, T2, η1 and η2 are necessary. So, in this study, we have adopted nonlinear regression method to find the optimal parameters T1, T2, η1
and η2.
In the nonlinear regression, observational data (yi,zi,Fi), for i=1,2…,m are modeled by eqn.(2) which is a nonlinear combination of the model parameters T1, η1, T2, and η2 for two piecewise‐
defined function. So the model function can be written as Fj=f(yi,zi,Tj,ηj), where j=1,2. It is desired to find parameters Tj, ηj such that the best curve fits of the given data in the least squares method, that is, the sum of squares is minimized, where the residuals ri are given by
) , , , ( i i j j
i
i F f y z T
r = − η , for i=1,2,…,m, and j=1,2.
The minimum value of S occurs when the gradient is zero, where
∑
∂∂ =∂ =
∂
i j
i i j
r r
S 2 0
η
η ,∂∂ =
∑
∂∂ =i j
i i
j T
r r T
S 2 0 (3)
Then the calculated optimal parameters for modeling crystalline structure of the specimen are T1=‐0.38, η1=0.283, T2=0.3782 and η=0.4782.
Here, η2 is bigger than η1, so the crystalline line in this specimen falls faster in the right part than that in the left part, which can been seen in Fig. 8. Furthermore, the ray tracing result will be presented in the next section to show the performance of the modified model with optimal parameters.
3. Ultrasonic Ray Tracing in Dissimilar Metal Welds
Ray theory is often used for calculating propagation of ultrasonic waves in the dissimilar metal welds (Oglivy, 1985, Oglivy, 1990). Ray
Fig. 9 3D slowness surface of austenitic steel
Fig. 10 3D group velocity surface of austenitic steel
properties such as direction and phase are described by the eikonal equation for the system and amplitudes of rays are determined by the transport equations. Most of ray tracing methods were developed to predict ultrasonic ray paths in anisotropic homogeneous materials. However, austenitic weldments materials are anisotropic inhomogeneous. So, to take care of the inhomogeneity, we applied layered model for ray tracing (Oglivy, 1990). In this model, an inhomogeneous material is assumed as layered medium and each layer is considered as homogeneous (but anisotropic) and the material properties of adjacent layers differs slightly.
For each homogeneous and anisotropic layer, the elastic property can be described as transversely isotropic. To have a ray trace in every layer, the group velocity which represents for the energy flaw should be determined. To determine the group velocity, we need to have equations of motion and constitutive equation:
i j
ji u
x ρ0&&
σ =
∂
∂ (4)
where is time dependent stresses, and is displacement, is the density of the solid. And combining it with the generalized Hooke’s law:
kl ijkl
ij C ε
σ = (5)
where is stiffness constants and
) 2(
1
l k k
l
kl x
u x u
∂ +∂
∂
= ∂
ε is the strain tensor, we have
i j k
l
ijkl u
x x
C u 0 &&
2 =ρ
∂
∂
∂ (6)
To find a solution to Navier’s equations in terms of monochromatic plane waves, we substitute
) (kx t i i
i Ade ii
u = −ω into eqn.(6), then 0
)
(Cijklsjsk −ρδil dl = (7)
where l. l is the propagation direction.
The slowness depends on the propagation
direction l. Once we solve eqn.(7) for a given propagation direction, that direction will then be varied to map out a complete slowness surface.
Using the calculated slowness curves, group velocity can be obtained by eqn.(8) (Henneke, 1972, Rokhlin et al., 1982).
1
j ijkl k l i
g C s d d
=ρ (8)
Fig. 9 and Fig. 10 show slowness surface and its group velocity surface of austenitic steel in three dimensions.
In the process of group velocity determination, the orientation of layers plays a key role. In Oglivy’s paper (Oglivy, 1990), It is pointed that those layers should be chosen to be parallel to the local lines of constant ray
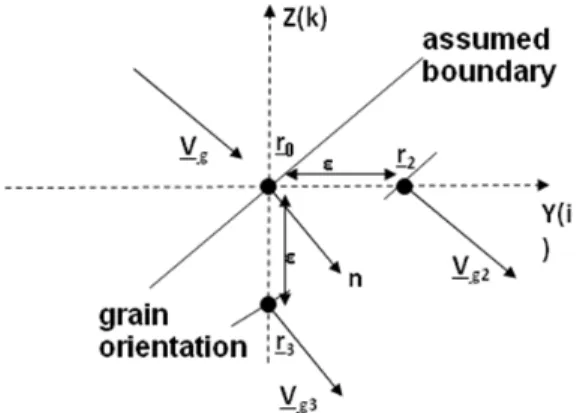
Fig. 11 Determination of the local variation in ray group velocity and assumed boundary in inhomogeneous media
Fig. 12 Determination of transmitted group velocity
Fig. 13 Calculated ray paths of qP wave for the austenitic steel weldments using Oglivy’s model (dashed line), modified crystalline structure model with optimal parameters (dotted line) and the real structure based on the macro‐photo (solid line)
velocity. If the slowness and group velocity of the incident wave and the layer orientation is provided, the reflected wave in the next layer can be found according to the Snell’s law and through eqn.(4) to eqn.(8).
We choose the layer to be parallel to lines of constant ray group velocity for the analytical solution to be reproduced by the discrete ray tracing technique (Ogilvy, 1990). Fig. 11 shows the two dimensional construction used to determine the local variation in ray group velocity, from which we can find the lines of constant ray group velocity and define the normal n to the assumed boundary between homogeneous layers. Fig. 12 shows the determination of the transmitted group velocity.
And the algorithm used in this study can be summarized as follows:
1) Find the current ray position r0 and obtain the local crystal orientation at this point.
2) Find the slowness and the group velocity of the new position and
3) Find the direction of constant group velocity magnitude to determine the assumed grain boundary. The normal to the assumed boundary between homogeneous layers is ,
∆ ∆ ,
∆ , where i=2,3 (Fig. 11)
4) Find the x1 (slowness projected to the assumed boundary) and the refracted x3
(slowness projected to the normal to the assumed boundary) of qP wave and the corresponding group velocity (Fig. 12).
5) Find out the incident angle.
6) Take a step forward along the direction of group velocity and back to step1 until a region change is detected.
In anisotropic materials, the group velocity of a ray depends on the ray propagation direction.
Since this velocity is used to determine the choice of layer orientation, it is possible for the layers within an anisotropic inhomogeneous material to depend on the ray mode and
propagation direction. In practice, this effect is small for materials with smoothly varying properties, and the layers are determined by the material variation. Thus, the crystalline structure is very important in ray tracing. Thereinafter, we will use the ray model described above to calculate the ray paths in the austenitic weldments radiated from a planar transducer placed on a Lucite wedge for three cases;1) in
Oglivy’s model with published parameters, 2) modified model with optimal parameters and 3) the real structure based on the macro‐photo.
Fig. 13 presents predicted ray paths of qP wave using the three different types of crystalline structures. Position of transducer and angle of incident for left side and right side are x1 = (‐31 mm, 22.7 mm), θ1 = 25 degree and x2
= (28 mm, 22.7 mm), θ2 = ‐26 degree, respectively. As shown in Fig. 13, the ray paths for the three crystalline structures are similar when ultrasonic beam propagating from the right part to left part. However, rays from the left part to right part shows discrepancy between each other. From Fig. 13, the ray path using the modified model is similar to the ray path calculated using the structure based on the macro
‐photo, while the ray path using Oglivy’s model with published parameters shows big discrepancy with other two results, due mainly to the non‐
symmetric character of the austenitic weldments.
4. Time Delay for Focusing Ultrasonic Phased Array Beams
In the last section, a single ray path is obtained. The ray can propagate through a desired point if a proper incident angle is given.
Here, we applied bisection method to find the proper incident angle (Xinyu Zhao et al., 2007).
The detailed procedures are described below:
Firstly, let the desired focal point be (yf, zf), incident point be (y0, z0) and the initial assumed incident angle θr is arctan( 0 )
0 f f
x x
y y
−
−
, then calculating the assumed initial incident angle θi
by applying transmission equation. Secondly, using θi, we perform ray tracing in the weldments, find the shortest distance from the focal point to the ray and judge whether the supposed incident angle is too big or too small, if it’s too big, treat this θi as the maximum value of incident angle θmax, and decrease θi
until θi becomes small enough that the ray goes
to other side of the focal point then set θi as the minimum value of incident angle θmin. Finally, applying the bisection method on the interval [θ
min θmax] to find the optimal incident angle whose ray passes through the focal position.
For the phased array in inhomogeneous anisotropic material, the same procedure is applied to all the elements, proper incident angle for all the rays propagate through one desired point are obtained.
Using the determined optimal incident angles of every element of phased array, we have calculated time delay for focusing and/or steering ultrasonic beams through the desired point. In the austenitic steel weldments, time delays are not proportional to ray path lengths because of the continuous changing in group velocity in inhomogeneous anisotropic material. So, in this study, time delay was calculated by summing all the time of flight of all the layers based on ray path of each propagated ray and their the group velocities, as shown in eqn. (9).
∑
== m
i ji
j T t
T
1
max- (9)
where Tj is the time delay of jth element of a phased array transducer, i represents the layer number, where m is the total number of layers, Tmax is the maximum time of flight among all the elements of phased array at a given setup.
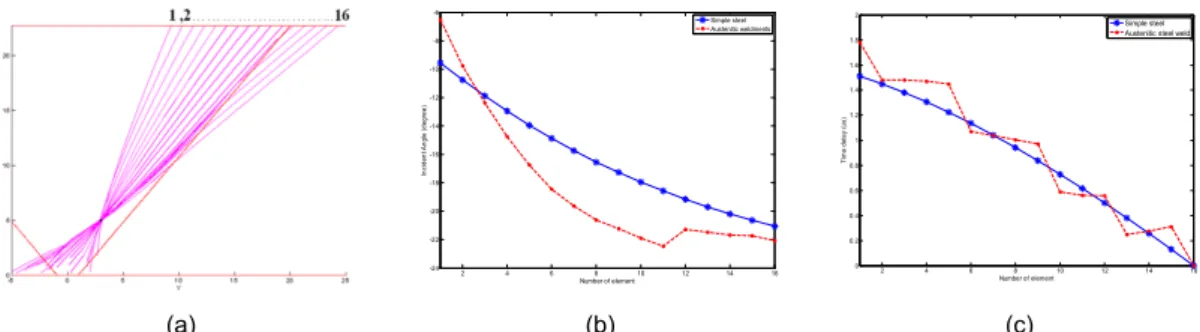
Fig. 14(a) and Fig. 15(a) show the ray tracing results for focusing on a point (3 mm, 5 mm) and a point (‐2 mm, 6 mm), respectively.
And Fig. 14 (b) and Fig. 15(b) show the calculated incident angle of all the 16 elements to focusing ultrasonic beams through the desired points based on the ray tracing results for austenitic steel weldments (dash lines with dots) and assumed as ordinary mild steel (solid line with stars). From the ray tracing results, time delay for focusing ultrasonic beam on the desired points are calculated. As shown in Fig.
14(c) and Fig. 15(c), we can find that there are big discrepancies in time delays in austenitic
2 4 6 8 10 12 14 16 -24
-22 -20 -18 -16 -14 -12 -10 -8 -6
Number of element
Incident Angle (degree)
Simple steel Austenitic weldments
2 4 6 8 10 12 14 16
0 0.2 0.4 0.6 0.8 1 1.2 1.4 1.6 1.8 2
Number of element
Time delay (us)
Simple steel Austenitic steel weld
(a) (b) (c)
Fig. 14 Calculated (a) ray paths, (b) incident angle, (c) time delay for a linear phased array transducer, where the focusing point is (3 mm, 5 mm)
2 4 6 8 10 12 14 16
13 14 15 16 17 18 19 20 21 22 23
Number of element
Incident Angle (degree)
Simple steel Austenitic weldments
2 4 6 8 10 12 14 16
0 0.2 0.4 0.6 0.8 1 1.2 1.4 1.6 1.8 2
Number of element
Time delay (us)
Simple steel Austenitic weldments
(a) (b) (c)
Fig. 15 Calculated (a) ray paths, (b) incident angle, (c) time delay for a linear phased array transducer, where the focusing point is (2 mm, 6 mm)
weldments and in ordinary mild steel. This result insists that time delay for focusing ultrasonic beam strongly depends on its crystalline structure.
5. Conclusions and Future Work
In this study, we proposed a method for determination of focal laws for ultrasonic phased array testing in dissimilar metal welds by ray tracing.
To find optimal time delay for phased array ultrasonic testing in dissimilar metal welds, we modified the Oglivy’s model to a non‐symmetric one and find the optimal parameters based on the real structure obtained from the macro‐photo and regarded the inhomogeneous anisotropic material as multiple layered homogeneous anisotropic materials. Then ray tracing method with the modified crystalline structure model was applied to calculate ray paths in the dissimilar metal welds. The ray tracing results of the real structure based on the macro‐photo and modified
crystalline structures model agrees very well.
Using the ray model, optimal time delays for focusing and/or steering ultrasonic beams through a desired position in the austenitic weldments were calculated. Thus, it can be a useful tool for determination of focal laws for ultrasonic phased array testing in dissimilar metal welds.
We will apply the focal law to the simulation of emitting and receiving signals in dissimilar metal welds and compare the results with and without focal law. Furthermore, correlative experiments on focal laws for ultrasonic phased array testing of dissimilar metal welds in order to verify the proposed method will be conducted.
6. Acknowledgement
This work was supported by the Korea Science and Engineering Foundation (KOSEF) grant funded by the Korea government (MOST) (No. 2006‐01653).
References
Anderson, M., Cumblidge, S. and Doctor, S.
(2004) Through Weld Testing of Wrought Stainless Steel Piping Using Phased Array Ultrasonic Probes, 16th World Conference on NDT, CD‐ROM, Montreal, Canada
Apfel, A., Moysan, J., Corneloup, G. and Chassignole, B. (2004) Simulations of the Influence of the Grains Orientations on Ultrasounds, 16th World Conference on NDT.
http://www.ndt.net/article/wcndt2004/html/htmltxt/4 14_moysan.htm
Becache, E., Joly, P. and Tsogka, C. (2000) An Analysis of New Mixed Finite Elements for the Approximation of Wave Propagation Problems, SIAM J. Numer. Anal, Vol. 37, pp. 1053‐1084 Buttram, Jonathan D. (2007) Manual Ultrasonic Phased Array Technique for Accurate Through‐
Wall Sizing of Planar Discontinuities in Dissimilar Metal Welds, Materials Evaluation, Vol. 65, No. 3, pp. 62‐66
Chassignole, B., Villard, D., Dubuget, M., Baboux, J. C. and Guerjouma, R. El (2000) Characterization of Austenitic Stainless Steel Welds for Ultrasonic NDT, Review of Progress in QNDE., Vol. 20, pp. 1325‐1332
Henneke, E. G. (1972) Reflection‐Refraction of a Stress Wave at a Plane Boundary between Anisotropic Media, J. Acoust. Soc. Am. Vol. 51,
pp. 210–217
Joly, E. and Tsogka, P. C. (2001) Application of the Fictitious Domain Method to 2D Linear Elastodynamic Problems, J. Comput Acoust., Vol. 9, pp. 1175‐1202
Ogilvy, J. A. (1985) Computerized Ultrasonic Ray Tracing in Austenitic Steel, NDT&E International, Vol. 18, pp. 67‐77
Ogilvy, J. A. (1990) A Layered Media Model for Ray Propagation in Anisotropic, Inhomogeneous Materials, Appl. Math. Mod.
Vol. 14, pp. 237‐247
Rokhlin, S. I.. Bolland, T. K. and Adler, L.
(1986) Reflection and Refraction of Elastic Waves on a Plane Interface between Two Generally Anisotropic Media, J. Acoust. Soc.
Am. Vol. 79, No. 4, pp. 210‐217
Spies, M. (2000) Modeling of Transducer Fields in Inhomogeneous Anisotropic Materials Using Gaussian Beam Superposition, NDT&E International, Vol. 33, pp. 155‐162
Zhao, X‐Y., Song, S‐J., Kim, H‐J., Gang, T., Kang, S‐C., Choi, Y‐H., Kim, K. and Kang, S‐S.
(2007) Determination of Ultrasonic Beam Incident Angle and Position for Flaw Detection in Anisotropic and Inhomogeneous Weldments by Ray Tracing, Journal of the Korean Society for Nondestructive Testing, Vol. 27, No. 3, pp.
231‐238