SPIO-Enhanced MRI Findings of Well-Differentiated Hepatocellular Carcinomas: Correlation with MDCT Findings
Objective: This study was designed to assess superparamagnetic iron oxide (SPIO)-enhanced MRI findings of well-differentiated hepatocellular carcinomas (HCCs) correlated with their multidetector-row CT (MDCT) findings.
Materials and Methods: Seventy-two patients with 84 pathologically proven well-differentiated HCCs underwent triple-phase MDCT and SPIO-enhanced MRI at a magnetic field strength of 1.5 Tesla (n = 49) and 3.0 Tesla (n = 23). Two radi- ologists in consensus retrospectively reviewed the CT and MR images for attenu- ation value and the signal intensity of each tumor. The proportion of hyperintense HCCs as depicted on SPIO-enhanced T2- or T2*-weighted images were com- pared in terms of tumor size (< 1 cm and > 1 cm), five CT attenuation patterns based on arterial and equilibrium phases and magnetic field strength, by the use of univariate and multivariate analyses.
Results: Seventy-eight (93%) and 71 (85%) HCCs were identified by CT and on SPIO-enhanced T2- and T2*-weighted images, respectively. For the CT atten- uation pattern, one (14%) of seven isodense-isodense, four (67%) of six hypo- dense-hypodense, four (80%) of five isodense-hypodense, 14 (88%) of 16 hyper- dense-isodense and 48 (96%) of 50 hyperdense-hypodense HCCs were hyperin- tense (Cochran-Armitage test for trend, p < 0.001). Based on the use of multivari- ate analysis, the CT attenuation pattern was the only factor that affected the pro- portion of hyperintense HCCs as depicted on SPIO-enhanced T2- or T2*-weight- ed images (p < 0.001). Tumor size or magnetic field strength was not a factor that affected the proportion of hyperintense HCCs based on the use of univariate and multivariate analysis (p > 0.05).
Conclusion: Most well-differentiated HCCs show hyperintensity on SPIO- enhanced MRI, although the lesions show various CT attenuation patterns. The CT attenuation pattern is the main factor that affects the proportion of hyperin- tense well-differentiated HCCs as depicted on SPIO-enhanced MRI.
ith the use of advanced imaging technologies and regular follow-up examinations, many hepatic nodules including nonmalignant regenerative and dysplastic nodules or hepatocellular carcinomas (HCCs) are detected during the course of chronic liver disease (1, 2). In clinical practice, it is important to detect HCCs at the early stage (when the tumors are well differentiated) and to distin- guish a well-differentiated HCC from a nonmalignant lesion such as a regenerative and dysplastic nodule. Diagnosis of HCC in the early stage and surgical resection of the tumor or transplantation of the liver substantially increase patient survival (3).
However, there is considerable overlap of computed tomography (CT) (2, 4-10) and magnetic resonance imaging (MRI) (9, 11-21) appearances of prominent regenerative Seong Hyun Kim, MD1
Won Jae Lee, MD1 Hyo K. Lim, MD1 Cheol Keun Park, MD2
Index terms :
Well-differentiated hepatocellular carcinoma
Superparamagnetic iron oxide- enhanced MRI, MDCT DOI:10.3348/kjr.2009.10.2.112
Korean J Radiol 2009;10:112-120 Received September 1, 2008; accepted after revision November 28, 2008.
1Department of Radiology and Center for Imaging Science; 2Department of Pathology, Samsung Medical Center, Sungkyunkwan University School of Medicine, Seoul 135-710, Korea
Address reprint requests to : Seong Hyun Kim, MD, Department of Radiology and Center for Imaging Science, Samsung Medical Center, Sungkyunkwan University School of Medicine, 50, Irwon- dong, Gangnam-gu, Seoul 135-710, Korea.
Tel. (822) 3410-2548 Fax. (822) 3410-2559 e-mail: kshyun@skku.edu
W
nodules, dysplastic nodules and well-differentiated HCCs.
Multiphasic multidetector row CT (MDCT) and superparamagnetic iron oxide (SPIO)-enhanced MRI are clinically useful modalities to diagnose HCCs (9, 14). The malignant tumors usually lack Kupffer cells and appear to be hyperintense against the hypointense background of the surrounding normal hepatic parenchyma (9, 11-21).
However, limitations of the use of SPIO for the detection of well-differentiated HCCs have been reported due to the retained Kupffer cell activity within the tumor (9, 11-21).
To the best of our knowledge, there have been several studies that have evaluated the enhancement pattern and clinical usefulness of MDCT and SPIO-enhanced MRI for well-differentiated HCCs (5, 13-16, 22, 23). However, only a limited number of well-differentiated HCCs have been analyzed with the use of resected specimens as the reference standard. There are also no published studies that have compared imaging obtained at 1.5 Tesla (T) and 3.0 T magnetic field strengths with regard to SPIO- enhanced MRI for the evaluation of a well-differentiated HCC. Therefore, the purpose of this study was to assess SPIO-enhanced MRI findings of well-differentiated HCCs, which were proven by surgical resection, in association with MDCT findings and magnetic field-strength.
MATERIALS AND METHODS
Patients
The institutional review board approved this retrospec- tive study, and the requirement for patient informed consent was waived. Between January 2000 and August 2007, we reviewed the histopathological reports of hepatic resected specimens at our institution. The usual criteria for selecting a patient for partial hepatic resection surgery were the following; the presence of one or more tumors of any size that showed hyperintensity on SPIO-enhanced MRI irrespective of the CT enhancement pattern, or hypervascular masses or prominent nonhypervascular masses > 2 cm in diameter depicted on CT despite SPIO uptake with a limited location to one lobe of the liver; and Child-Pugh class A function in patients suspected of having HCC with an elevated α-fetoprotein level. A total of 122 patients with 154 well-differentiated HCCs were identi- fied. In our institution, for patients suspected of having HCC, SPIO-enhanced MRI was usually performed for the detailed preoperative staging work-up after a multiphasic CT examination or was performed to determine whether prominent hepatic nodules with slow growth that did not show typical CT enhancement of an HCC were or were not malignant. Of the 122 patients, 50 patients were excluded from the study because either a CT examination
or SPIO-enhanced MRI was not performed. Finally, 72 consecutive patients (67 men and five women; age range, 33-81 years; mean age, 59 years) with 84 well-differenti- ated HCCs were enrolled in the study who were examined with both triple-phase MDCT and SPIO-enhanced MRI. Of these 72 patients, six patients had two well-differentiated HCCs and two patients had three and five well-differenti- ated HCCs, respectively, based on histopathology. Hepatic resection surgery was performed within four weeks after the imaging studies.
Histopathological Examination
For the diagnosis of well-differentiated HCCs in our institution, the resected specimens were serially sliced with a 5-mm thickness in the transverse or coronal plane, depending on the location of the tumor. One experienced pathologist analyzed the histological grade of the tumor according to the grading system of Edmondson and Steiner (24). A well-differentiated HCC corresponded to
Edmondson-Steiner grade I. HCCs consisting mostly of Edmondson-Steiner grade I with a minimal-to-small portion of Edmondson-Steiner grade II were also diagnosed as well-differentiated HCCs, based on the predominant histological characteristics (25).
In our study, the tumors ranged from 0.1 to 11 cm in diameter (mean, 2.2 cm). Based on histological evaluations of the background liver in the resected specimens, 39 and 24 patients had liver cirrhosis and chronic hepatitis, respec- tively. Of these patients, 45 patients were infected with hepatitis B, 17 patients were infected with hepatitis C and one patient suffered from alcoholism. Nine patients had a normal liver. The patients with liver cirrhosis showed clinically Child-Pugh class A liver function.
Imaging Methods
Triple-phase helical CT examinations were performed using MDCT scanners with four (LightSpeed QX/I; GE Healthcare, Milwaukee, WI) (n = 27), eight (LightSpeed Ultra 8; GE Healthcare) (n = 15), 16 (LightSpeed 16; GE Healthcare) (n = 18), 40 (Brilliance 40; Philips Medical Systems, Eindhoven, The Netherlands) (n = 7) and 64 detector rows (Aquilion 64; Toshiba Medical, Tokyo, Japan) (n = 5). The scanning parameters were 120 kVp, 175-184 mAs, 5-mm slice thickness, a table speed of 15.0- 53.0 mm/rotation (pitch of 0.75-0.938) and a single breath hold helical acquisition of 5-12 seconds (depending on liver size). Images were obtained in the craniocaudal direction and were reconstructed every 5 mm to provide contiguous sections. Hepatic arterial phase scanning began 30-35 seconds after injection of 120 mL of a nonionic iodinated contrast material (iopamidol, Iopamiro 300;
Bracco, Milan, Italy) at a rate of 3-4 mL/s using a bolus- triggered technique. The contrast material was injected through the antecubital vein using a power injector. The portal and equilibrium phases of scanning began 70 seconds and 180 seconds after injection of the contrast material, respectively.
MRI was performed with a 1.5 T (Signa Horizon; GE Healthcare) (n = 49) and a 3.0 T whole-body MR system (Intera Achieva 3.0 T; Philips Medical Systems) (n = 23) within 15 days after the CT examination. Ferumoxides (Feridex IV; Advanced Magnetics, Cambridge, MA) and Ferucarbotran (Resovist; Schering, Berlin, Germany) were used in 21 and 51 patients, respectively, as SPIO agents.
Ferumoxides solution at a dose of 15 μmol per kilogram of body weight diluted in 100 mL of 5% glucose solution was infused through a 5-μm specific filter for approximately 30 minutes. MRI was initiated 30 minutes after the end of the infusion. The dose of ferucarbotran was 1.4 mL in patients with a body weight of 60 kg or more and a dose of 0.9 mL in patients with a body weight of less than 60 kg (dose range, 8.0-12.0 μmol iron/kg). The contrast agent was manually administered IV through an in-line 5-μm specific filter with a rapid bolus in 1 second, immediately followed by a 10-mL saline solution flush. The entire procedure was performed in approximately 5 seconds. MRI was initiated ten minutes after the injection of the contrast agent.
All images were obtained in the axial plane with a phased-array multicoil for the body, a 6-8 mm section thickness (according to the liver volume) with a 2 mm intersection gap for 1.5 T MR and a 5-7 mm section thickness with a 1-mm to 2-mm intersection gap for 3.0 T MR and a field of view of 32-38 cm. Saturation bands superior and inferior to the imaging volume were applied in all sequences to minimize motion artifacts that arose from vessels.
After the injection of the contrast agent, the MRI protocol included a fat-suppressed respiratory-triggered T2-weighted fast spin-echo sequence (TR/TE, 3,333- 8,571/90-117 msec; an echo train length of 10-18; a 256
×256 matrix; a bandwidth of 120 Hz per pixel) and a T2*- weighted fast multiplanar gradient-recalled echo acquisi- tion in the steady state (TR/TE range, 130/8.4-10.4 msec;
flip angle, 30�; bandwidth of 60 Hz per pixel) for 1.5 T MR. For 3.0 T MR, a fat-suppressed breath hold multi-shot T2-weighted sequence with a reduction factor of two or four (TR/TE, 2,161/70 msec; flip angle, 90�; matrix, 400 × 280; bandwidth of 235.2 Hz per pixel) and a T2*-weighted fast field-echo sequence (TR/TE, 129/9.2 msec; flip angle, 20�; matrix, 224×179; bandwidth of 289.5 Hz per pixel) were acquired.
Image Analysis
All of the CT images were interpreted using a 2,000×
2,000 Picture Archiving and Communication System (PACS; GE Healthcare Integrated Imaging Solutions) monitor. Two abdominal radiologists (with eight and 21 years experience, respectively) retrospectively analyzed the CT and MR images by consensus. The radiologists had knowledge that the patients had HCCs with their segmen- tal location (Couinaud segment), but the radiologists were blinded to the pathological grades and clinical information and to the original imaging reports. The radiologists recorded the size, density on CT images and signal intensity on MR images for the HCCs. The histopathologi- cal results of the resected specimens were correlated with the preoperative imaging findings.
The density on CT images as determined by visual inspection was considered hyperdense when it was higher than the surrounding liver, isodense when it was compara- ble to the surrounding liver and hypodense when it was lower than the surrounding liver on each phase. A tumor was categorized as hypervascular, isovascular and hypovascular based on the pattern of density on contrast- enhanced arterial-phase CT images. When disagreement took place between the radiologists, consensus was achieved by discussion. HCCs were classified into five categories based on the CT density pattern (isodense- isodense, hypodense-hypodense, isodense-hypodense, hyperdense-isodense and hyperdense-hypodense) accord- ing to the pattern of the density as depicted on the arterial and equilibrium phases of CT as based on several reports (26, 27). The typical enhancement pattern of an HCC was defined as a hyperdense-hypodense pattern based on a previous report (14). The portal phase was not considered for the evaluation of CT density pattern, as many HCCs are not conspicuous on this phase. The signal intensity on MR images was considered hyperintense when the signal intensity of an HCC was higher than the surrounding liver, isointense when the signal intensity was comparable to the surrounding liver and hypointense when the signal intensity was lower than the surrounding liver as depicted on SPIO-enhanced T2-weighted and/or T2*-weighted images. When the signal intensity of an HCC was hyperin- tense to the surrounding liver as depicted on SPIO- enhanced T2-weighted and/or T2*-weighted images, the HCC was considered as having an impaired Kupffer cell number or activity for the uptake of SPIO. When the signal intensity of HCC was isointense or hypointense to the surrounding liver as depicted on both SPIO-enhanced T2- weighted and T2*-weighted images, the HCC was consid- ered to have taken up SPIO.
The tumors, which were not identified on contrast-
enhanced CT or SPIO-enhanced T2- and T2*-weighted MR images, were regarded to be isodense or isointense.
We evaluated the proportion of hyperintense HCCs based on tumor size and the five categories of the CT density patterns. In addition, we compared the proportion
of hyperintense HCCs with the use of 1.5 T and 3.0 T MR imaging.
Statistical Analysis
The differences of mean tumor sizes were compared
Fig. 1. 61-year-old woman with 0.5-cm well-differentiated hepatocellular carcinoma in segment VII.
A, B. Contrast-enhanced CT scans obtained at arterial (A) and equilibrium (B) phases show small nodule with hypodense-hypodense pattern (arrows), which mimics nonmalignant nodule such as regenerative or dysplastic nodule. Small hypodense lesion (arrowhead in B) in left liver is part of cyst.
C. Ferucarbotran-enhanced T2*-weighted fast field-echo (TR/TE, 129/9.2 msec; flip angle, 20�) axial image obtained at 3.0 T shows small hyperintense nodule (arrow). Small hyperintense lesion (arrowhead) in left liver is part of cyst.
A B C
Fig. 2. 57-year-old man with 1.9-cm well-differentiated hepatocellular carcinoma in segment V.
A, B. Contrast-enhanced CT scans obtained at arterial (A) and equilibrium (B) phases show small nodule with isodense-hypodense pattern (arrows).
C. Ferucarbotran-enhanced T2*-weighted fast field-echo (TR/TE, 129/9.2 msec; flip angle, 20�) axial image obtained at 3.0 T shows discrete hyperintense nodule (arrow).
A B C
using the Mann-Whitney U test. The differences of the proportion of hyperintense HCCs according to the tumor size (< 1 cm and > 1 cm) and magnetic field-strength were compared using Fisher’s exact test. Statistical analysis for trend for the proportion of hyperintense HCCs on SPIO- enhanced MRI according to the five CT density patterns was assessed using the Cochran-Armitage test. Multivariate analysis with multiple logistic regression analysis was used to analyze factors that affected the proportion of hyperin- tense HCCs on SPIO-enhanced MRI. A p value of less than 0.05 was considered as statistically significant.
RESULTS
Among 84 well-differentiated HCCs, 78 (93%) (Figs. 1- 4) were identified by CT and 71 (85%) were identified as hyperintense as seen on SPIO-enhanced T2- and/or T2*- weighted MR images (Figs. 1, 2).
The proportion of hyperintense HCCs according to the tumor size and five CT density patterns for well-differenti- ated HCCs are shown in Table 1. A total of 13 (15%) of 84 HCCs were not hyperintense as seen on SPIO-enhanced MR images (Figs. 3, 4). The proportion of hyperintense tumors for HCCs < 1 cm was less than for HCCs > 1 cm, but the difference was not statistically significant (p = 0.05). A chance to appear as a hyperintense HCC accord-
Table 1. Frequency and Percentage of Hyperintense Well-differentiated HCCs Characterized by SPIO-enhanced MRI Based on Tumor Size and CT Density Pattern
Size
CT Density Pattern
Total
Iso-Iso Hypo-Hypo Iso-Hypo Hyper-Iso Hyper-Hypo
< 1 cm 0/4 (0)0 1/1 (100) 1/1 (100) 01/20(50) 007/70(100) 10/15 (67)
> 1 cm 1/3 (33) 3/5 (60)0 3/4 (75)0 13/14 (93) 41/43 (95) 61/69 (88)
Total 1/7 (14) 4/6 (67)0 4/5 (80)0 14/16 (88) 48/50 (96) 71/84 (85)
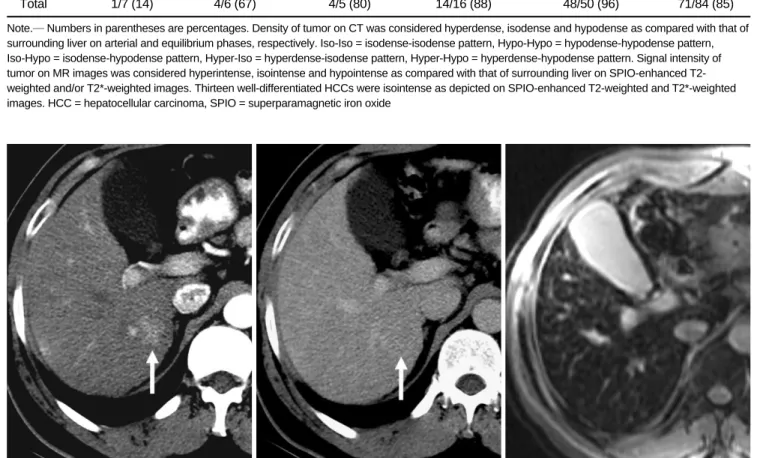
Note.─Numbers in parentheses are percentages. Density of tumor on CT was considered hyperdense, isodense and hypodense as compared with that of surrounding liver on arterial and equilibrium phases, respectively. Iso-Iso = isodense-isodense pattern, Hypo-Hypo = hypodense-hypodense pattern, Iso-Hypo = isodense-hypodense pattern, Hyper-Iso = hyperdense-isodense pattern, Hyper-Hypo = hyperdense-hypodense pattern. Signal intensity of tumor on MR images was considered hyperintense, isointense and hypointense as compared with that of surrounding liver on SPIO-enhanced T2- weighted and/or T2*-weighted images. Thirteen well-differentiated HCCs were isointense as depicted on SPIO-enhanced T2-weighted and T2*-weighted images. HCC = hepatocellular carcinoma, SPIO = superparamagnetic iron oxide
Fig. 3. 48-year-old man with 2.3-cm well-differentiated hepatocellular carcinoma in segment VI.
A, B. Contrast-enhanced CT scans obtained at arterial (A) and equilibrium (B) phases show nodule with hyperdense-isodense pattern (arrows).
C. As seen on ferucarbotran-enhanced T2*-weighted fast multiplanar gradient-recalled echo axial image (TR/TE range, 130/8.4 msec;
flip angle, 30�) obtained at 1.5 T, nodule as seen on CT image does not appear to be hyperintense.
A B C
ing to the five CT density patterns tended to increase from the isodense-isodense pattern to the hyperdense-
hypodense pattern as shown in Table 1 (p < 0.001).
Seventy (91%) of 77 HCCs that did not show the isodense-isodense pattern were hyperintense (Figs. 1, 2).
Sixty-two (94%) of 66 hypervascular HCCs were hyperin- tense. In contrast, nine (50%) of 18 nonhypervascular HCCs were hyperintense. Twenty-three (68%) of 34 HCCs with an atypical enhancement pattern were hyperin- tense as seen on SPIO-enhanced MRI.
Based on the magnetic field strength, the mean tumor size in 49 patients with 58 HCCs examined with 1.5 T MR (range, 0.4-11.0 cm in diameter; mean ± standard deviation [SD], 2.5 ± 2.0 cm) was significantly larger than that (range, 0.1-3.8 cm; mean ± SD, 1.6 ± 0.8 cm) of 23 patients with 26 HCCs examined with 3.0 T MR (p = 0.049). In patients examined with 1.5 T MR, 48 (83%) HCCs were hyperintense, and this result was not signifi- cantly different for 23 HCCs (88%) that were hyperin- tense as examined on 3.0 T MR (p = 0.745).
Based on the use of multiple logistic regression analysis, the CT density pattern was the only factor that affected the proportion of hyperintense HCCs as seen on SPIO- enhanced T2- or T2*-weighted images (p < 0.001). Tumor size (p = 0.391) and magnetic field strength (p = 0.149) were not statistically significant.
DISCUSSION
Based on multistep hepatocarcinogenesis, HCCs are thought to develop from a regenerative nodule to a dysplastic nodule, subsequently into a well-differentiated HCC and ultimately to an advanced tumor such as a moderately and poorly differentiated HCC (28, 29). The biological aggressiveness of a well-differentiated HCC as an early stage of HCC in hepatocarcinogenesis is unclear, but it is considered to have a relatively low malignant potential and rarely invades vessels or metastasizes to other sites (30).
In our study, 15% of well-differentiated HCCs were not hyperintense as depicted on both SPIO-enhanced T2- and T2*-weighted MR images, which was lower than 23-85%
reported in several previous studies (13-16) and was comparable to 17% reported in another previous study (20).
Our study showed that the proportion of hyperintense well-differentiated HCCs tended to be higher in tumors > 1 cm than in tumors < 1 cm and in hypervascular tumors rather than non-hypervascular tumors. This result may suggest that a decrease in the Kupffer cell number and function occurs in parallel with an alteration in tumor size and tumor vascularity in HCCs, as has been reported previously (11, 13).
It is known that sinusoidal capillarization and an increase in the number of unpaired arteries appear to be detectable
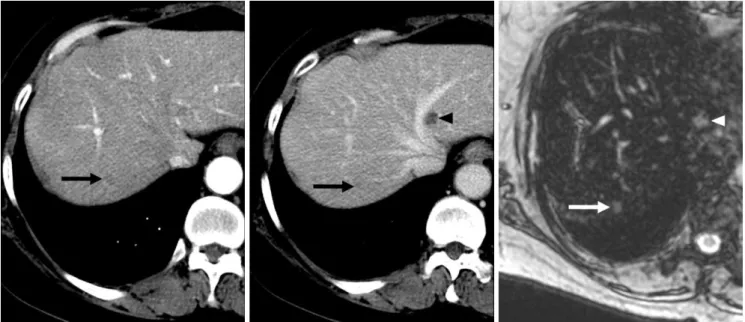
Fig. 4. 64-year-old man with 1.6-cm well-differentiated hepatocellular carcinoma in segment VI.
A, B. Contrast-enhanced CT scans obtained at arterial (A) and equilibrium (B) phases show small nodule with hyperdense-hypodense pattern (arrows).
C. As seen on ferucarbotran-enhanced T2*-weighted fast multiplanar gradient-recalled echo axial image (TR/TE range, 130/8.4 msec;
flip angle, 30�) obtained at 1.5 T, nodule as seen on CT image does not appear to be hyperintense.
A B C
late as “hypervascularity” on imaging (21). With the advantages of MDCT such as a rapid scanning time and thinner section collimation with higher temporal and spatial resolution, as demonstrated in our study, MDCT showed a higher percentage (79%) of hypervascular well- differentiated HCCs as compared with 47% in a previous study with the use of single-detector CT (6). However, 21% of the well-differentiated HCCs in our study
appeared isovascular or hypovascular on the arterial phase probably due to less neoplastic angiogenesis and
incomplete vascularization of the sinusoid-like blood spaces of the tumor (4-6), a finding that overlaps with the imaging findings of nonmalignant nodules such as regener- ative and dysplastic nodules.
It is believed that well-differentiated HCCs with
decreased portal tracts without increased abnormal arteries are hypodense as seen on the arterial phase, and when the increased abnormal arterial supply compensates for a decreased arterial supply through the portal tracts, the HCCs are visualized as isodense on the arterial phase. The isodense or hypodense HCCs on the arterial phase with decreased portal tracts appear to be hypodense on the equilibrium phase. In our study, the chance to appear as a hyperintense HCC according to the five CT density patterns tended to increase from the isodense-isodense pattern to the hyperdense-hypodense pattern. We believe that HCCs with an isodense-isodense pattern might have almost the same arterial and portal supply from portal tracts similar to the surrounding liver, resulting in a preserved Kupffer cell number and function. For lesions with the hyperdense-hypodense pattern, HCCs might have progressed to a more malignant form than HCCs with an isodense-isodense pattern, resulting in an impaired Kupffer cell number and function. Our study showed that 91% of well-differentiated HCCs that did not show the isodense- isodense pattern were hyperintense as seen on SPIO- enhanced MRI, which was comparable to 100% reported in a previous study (14). We think that if well-differenti- ated HCCs appear with the four density patterns other than the isodense-isodense pattern, which may not be recognized on imaging, the HCCs may have a high chance to be detected as a hyperintense nodule due to the impaired Kupffer cell activity on SPIO-enhanced MRI.
A previous study (13) has reported that none of eight non-hypervascular well-differentiated HCCs was hyperin- tense as seen on SPIO-enhanced MRI. In our study, 50%
of non-hypervascular well-differentiated HCCs were hyperintense. The reason for the difference is unclear, but may be due to a different study population and design.
Some investigators have suggested that SPIO-enhanced MRI might reflect functional and histological changes of
tumors that can be present and detectable in advance as compared to arterial hypervascularization (21), which supports our results. However, as 50% of non-hypervascu- lar well-differentiated HCCs were not hyperintense, the differentiation between these tumors and benign nodules such as regenerative and dysplastic nodules remains challenging. Therefore, for these nodules, a biopsy is needed, if possible.
In clinical practice, the diagnosis of an HCC is limited to nodules with a typical enhancement pattern (hypervascular with washout on the portal and/or equilibrium phase) (31).
Although our study showed that the ability of MDCT to identify hypervascular and hypovascular well differenti- ated HCCs is excellent with the use of triple-phase MDCT, as has been reported previously (4-6), CT enhancement patterns of well-differentiated HCCs are diverse and a diagnosis by MDCT alone may be inconclusive. In our study, 68% of well-differentiated HCCs with an atypical enhancement pattern were hyperintense as seen on SPIO- enhanced MRI. Based on the results, we believe that SPIO- enhanced MRI may be utilized as a problem-solving tool with increased diagnostic confidence in cases of suspected well-differentiated HCCs that show atypical CT findings.
One study (32) reported that the diagnostic accuracy for detection of malignant hepatic lesions with the use of 1.5 T and 3.0 T on SPIO-enhanced MRI were equivalent, which supports our results that showed no significant difference for the detection of hyperintense well-differentiated HCCs between the use of these magnetic field strengths on SPIO- enhanced MRI.
We recognize some limitations of this study. First, the enrolled patients were collected for a long period with the use of various imaging parameters and MR contrast agents, which may affect the CT enhancement pattern and signal intensity of well-differentiated HCCs. However, we think that the various CT scanners and MR contrast agents that were utilized minimally influenced the CT enhancement pattern and signal intensity on SPIO-enhanced MRI, as arterial phase CT images using a bolus-triggered technique and recommended accumulation phase MR images after the injection of different MR contrast agents were constantly acquired during the examination. Second, only patients with pathologically proven well-differentiated HCCs obtained exclusively after surgical resection as the standard of reference were enrolled in the study, which may be one possible reason for a higher proportion of hyperintense well-differentiated HCCs as compared with previous studies (13-16). Third, the study population had well-preserved liver function. However, the effect of SPIO to increase the tumor-to-liver contrast-to-noise ratio may not be sufficiently strong in a severely cirrhotic liver,
which may affect the signal intensity of a well-differenti- ated HCC.
In conclusion, most (85%) well-differentiated HCCs showed hyperintensity on SPIO-enhanced MRI, although the well-differentiated HCCs showed various CT density patterns. The CT density pattern was the main factor that affected the proportion of hyperintense well-differentiated HCCs as depicted on SPIO-enhanced MRI.
Acknowledgements
The authors thank Seonwoo Kim and Sook Young Woo at the Biostatistics Unit of Samsung Biomedical Research Institute for their statistical assistance.
References
1. Hussain SM, Zondervan PE, IJzermans JN, Schalm SW, de Man RA, Krestin GP. Benign versus malignant hepatic nodules: MR imaging findings with pathologic correlation. Radiographics 2002;22:1023-1036
2. Lim JH, Kim MJ, Park CK, Kang SS, Lee WJ, Lim HK.
Dysplastic nodules in liver cirrhosis: detection with triple phase helical dynamic CT. Br J Radiol 2004;77:911-916
3. Figueras J, Jaurrieta E, Valls C, Ramos E, Serrano T, Rafecas A, et al. Resection or transplantation for hepatocellular carcinoma in cirrhotic patients: outcomes based on indicated treatment strategy. J Am Coll Surg 2000;190:580-587
4. Lim JH, Choi D, Kim SH, Lee SJ, Lee WJ, Lim HK, et al.
Detection of hepatocellular carcinoma: value of adding delayed phase imaging to dual-phase helical CT. AJR Am J Roentgenol 2002;179:67-73
5. Iannaccone R, Laghi A, Catalano C, Rossi P, Mangiapane F, Murakami T, et al. Hepatocellular carcinoma: role of
unenhanced and delayed phase multi-detector row helical CT in patients with cirrhosis. Radiology 2005;234:460-467
6. Li CS, Chen RC, Tu HY, Shih LS, Zhang TA, Lii JM, et al.
Imaging well-differentiated hepatocellular carcinoma with dynamic triple-phase helical computed tomography. Br J Radiol 2006;79:659-665
7. Amano S, Ebara M, Yajima T, Fukuda H, Yoshikawa M, Sugiura N, et al. Assessment of cancer cell differentiation in small hepatocellular carcinoma by computed tomography and magnetic resonance imaging. J Gastroenterol Hepatol 2003;18:273-279
8. Takayasu K, Muramatsu Y, Mizuguchi Y, Moriyama N, Ojima H. Imaging of early hepatocellular carcinoma and adenomatous hyperplasia (dysplastic nodules) with dynamic CT and a combination of CT and angiography: experience with resected liver specimens. Intervirology 2004;47:199-208
9. Murakami T, Hori M, Kim T, Kawata S, Abe H, Nakamura H.
Multidetector row CT and MR imaging in diagnosing hepatocel- lular carcinoma. Intervirology 2004;47:209-226
10. Sakabe K, Yamamoto T, Kubo S, Hirohashi K, Hamuro M, Nakamura K, et al. Correlation between dynamic computed tomographic and histopathological findings in the diagnosis of small hepatocellular carcinoma. Dig Surg 2004;21:413-420 11. Tanaka M, Nakashima O, Wada Y, Kage M, Kojiro M.
Pathomorphological study of Kupffer cells in hepatocellular carcinoma and hyperplastic nodular lesions in the liver.
Hepatology 1996;24:807-812
12. Ishida T, Murakami T, Kato N, Takahashi M, Miyazawa T, Tsuda K, et al. Superparamagnetic iron oxide enhanced magnetic resonance imaging of rat liver with hepatocellular carcinoma and benign hyperplastic nodule. Invest Radiol 1997;
32:282-287
13. Imai Y, Murakami T, Yoshida S, Nishikawa M, Ohsawa M, Tokunaga K, et al. Superparamagnetic iron oxide-enhanced magnetic resonance images of hepatocellular carcinoma: correla- tion with histologic grading. Hepatology 2000;32:205-212 14. Kim SH, Choi D, Kim SH, Lim JH, Lee WJ, Kim MJ, et al.
Ferucarbotran-enhanced MRI versus triple-phase MDCT for the preoperative detection of hepatocellular carcinoma. AJR Am J Roentgenol 2005;184:1069-1076
15. Kato H, Kanematsu M, Kondo H, Goshima S, Matsuo M, Hoshi H, et al. Ferumoxide-enhanced MR imaging of hepatocellular carcinoma: correlation with histologic tumor grade and tumor vascularity. J Magn Reson Imaging 2004;19:76-81
16. Lim JH, Choi D, Cho SK, Kim SH, Lee WJ, Lim HK, et al.
Conspicuity of hepatocellular nodular lesions in cirrhotic livers at ferumoxides-enhanced MR imaging: importance of Kupffer cell number. Radiology 2001;220:669-676
17. Pauleit D, Textor J, Bachmann R, Conrad R, Flacke S, Layer G, et al. Hepatocellular carcinoma: detection with gadolinium- and ferumoxides-enhanced MR imaging of the liver. Radiology 2002;222:73-80
18. Tang Y, Yamashita Y, Arakawa A, Namimoto T, Mitsuzaki K, Abe Y, et al. Detection of hepatocellular carcinoma arising in cirrhotic livers: comparison of gadolinium- and ferumoxides- enhanced MR imaging. AJR Am J Roentgenol 1999;172:1547- 1554
19. Matsuo M, Kanematsu M, Itoh K, Ito K, Maetani Y, Kondo H, et al. Detection of malignant hepatic tumors: comparison of gadolinium- and ferumoxide-enhanced MR imaging. AJR Am J Roentgenol 2001;177:637-643
20. Nakamura H, Ito N, Kotake F, Mizokami Y, Matsuoka T.
Tumor-detecting capacity and clinical usefulness of SPIO-MRI in patients with hepatocellular carcinoma. J Gastroenterol 2000;35:849-855
21. Bartolozzi C, Crocetti L, Lencioni R, Cioni D, Della Pina C, Campani D. Biliary and reticuloendothelial impairment in hepatocarcinogenesis: the diagnostic role of tissue-specific MR contrast media. Eur Radiol 2007;17:2519-2530
22. Takeshita K, Nagashima I, Frui S, Takada K, Yamauchi T, Harasawa A, et al. Effect of superparamagnetic iron oxide- enhanced MRI of the liver with hepatocellular carcinoma and hyperplastic nodule. J Comput Assist Tomogr 2002;26:451-455 23. Kang BK, Lim JH, Kim SH, Choi D, Lim HK, Lee WJ, et al.
Preoperative depiction of hepatocellular carcinoma: ferumox- ides-enhanced MR imaging versus triple-phase helical CT.
Radiology 2003;226:79-85
24. Edmondson HA, Steiner PE. Primary carcinoma of the liver: a study of 100 cases among 48,900 necropsies. Cancer 1954;7:462-503
25. Kim SH, Lim HK, Choi D, Lee WJ, Kim SH, Kim MJ, et al.
Percutaneous radiofrequency ablation of hepatocellular carcinoma: effect of histologic grade on therapeutic results. AJR Am J Roentgenol 2006;186:S327-S333
26. Efremidis SC, Hytiroglou P, Matsui O. Enhancement patterns and signal-intensity characteristics of small hepatocellular carcinoma in cirrhosis: pathologic basis and diagnostic
challenges. Eur Radiol 2007;17:2969-2982
27. Hayashi M, Matsui O, Ueda K, Kawamori Y, Kadoya M, Yoshikawa J, et al. Correlation between the blood supply and grade of malignancy of hepatocellular nodules associated with liver cirrhosis: evaluation by CT during intraarterial injection of contrast medium. AJR Am J Roentgenol 1999;172:969-976 28. Sakamoto M, Hirohashi S, Shimosato Y. Early stages of
multistep hepatocarcinogenesis: adenomatous hyperplasia and early hepatocellular carcinoma. Hum Pathol 1991;22:172-178 29. International Working Party. Terminology of nodular hepatocel-
lular lesions. Hepatology 1995;22:983-993
30. Sugihara S, Nakashima O, Kojiro M, Majima Y, Tanaka M,
Tanikawa K. The morphologic transition in hepatocellular carcinoma: a comparison of the individual histologic features disclosed by ultrasound-guided fine-needle biopsy with those of autopsy. Cancer 1992;70:1488-1492
31. Bruix J, Sherman M; Practice Guidelines Committee, American Association for the Study of Liver Diseases. Management of hepatocellular carcinoma. Hepatology 2005;42:1208-1236 32. Chang JM, Lee JM, Lee MW, Choi JY, Kim SH, Lee JY, et al.
Superparamagnetic iron oxide-enhanced liver magnetic resonance imaging: comparison of 1.5 T and 3.0 T imaging for detection of focal malignant liver lesions. Invest Radiol 2006;41:168-174