pISSN 1976-1457 eISSN 2005-6168
Dietary sodium intake in young Korean adults and its relationship with eating frequency and taste preference
Eugene Shim
1, Ha-Jung Ryu
2, Jinah Hwang
3, Soo Yeon Kim
1and Eun-Jung Chung
4§1
Department of Food and Nutrition, Soongeui Women's College, Seoul 100-751, Korea
2
Research Institute of Food & Nutritional Sciences, College of Human Ecology, Yonsei University, Seoul 120-749, Korea
3
Department of Foods and Nutrition, College of Natural Sciences, Myongji University, Yong-In 449-728, Korea
4
Division of General Studies, Kangnam University, 40 Gangnam-ro, Giheung-gu, Yongin, Gyeonggi 446-702, Korea
Abstract
Dietary sodium intake is considered one of the major causal factors for hypertension. Thus, to control the increase of blood pressure and reduce the risk of hypertension-related clinical complications, a reduction in sodium intake is recommended. The present study aimed at determining the association of dietary sodium intake with meal and snack frequency, snacking time, and taste preference in Korean young adults aged 20-26 years, using a 125-item dish-frequency questionnaire. The mean dietary sodium intakes of men and women were 270.6 mmol/day and 213.1 mmol/day, which were approximately 310% and 245% of the daily sodium intake goal for Korean men and women, respectively. Dietary sodium intake was positively correlated with systolic blood pressure in the total group, and BMI in the total and men-only groups. In the total and men-only groups, those who consumed meals more times per day consumed more dietary sodium, but the number of times they consumed snacks was negatively correlated with dietary sodium intake in the total, men-only, and women-only groups. In addition, those who consumed snacks in the evening consumed more sodium than those who did so in the morning in the men-only group. The sodium intake was also positively associated with preference for salty and sweet taste in the total and women-only groups. Such a high intake of sodium in these young subjects shows that a reduction in sodium intake is important for the prevention of hypertension and related diseases in the future.
Key Words: Dietary sodium intake, eating frequency, taste preference, hypertension
Introduction
7)A number of causal factors for hypertension have been identified to date, including excess body weight, reduced physical activity, inadequate intake of fruits and vegetables, excess alcohol intake, and excess dietary sodium intake [1]. Among these factors, sodium intake has been shown to have a strong association with blood pressure in population-based studies [2]
and randomized clinical trials [3].
In 2010, 26.9% of Korean adults aged 30 years or more had hypertension [4]. As blood pressure continues to increase throughout life, the prevalence of hypertension is expected to increase further owing to the increasing longevity of the Korean population [5,6].
Koreans normally consume seasoned soups and stews and pickled vegetables with a high sodium content. Thus, the average sodium intake of Korean adults was more than 260% of the daily sodium intake goal (87 mmol/day), which was 226 mmol (equivalent to 5,202 mg of sodium or 13.2 g of sodium chloride) per day in 2011 [4]. Additionally, Korean young adults in their
20s prefer instant foods such as ramen, which have a very high sodium content, resulting in higher sodium consumption of 217 mmol (equivalent to 4,990 mg of sodium or 12.7 g of sodium chloride) per day; this amounts to approximately 250% of the daily sodium intake goal [4]. Therefore, in order to effectively control the increase in blood pressure in the future and reduce the risk of hypertension-related clinical complications in Korea, changes in the diet, including sodium intake reduction in young people, should be implemented [3].
Salt preference is a liking for salt even in a sodium-replete state [7], whereas salt appetite reflects a desire for salt to maintain sodium homeostasis in a sodium-deprived state [8,9]. Therefore, salt preference is often assessed for the qualitative evaluation of salt intake and an individual’s attitude and response to salty foods [10-12]. Hypertensive patients have increased preference for salt without any alteration from normal sodium chloride taste thresholds [9], although some studies suggested that there was no relationship between salt preference and blood pressure [13,14]. Several studies showed that salt preference might be associated with the frequency or the amount of salty food
§Corresponding Author: Eun-Jung Chung, Tel. 82-31-280-3926, Fax. 82-31-280-3893, Email. [email protected] Received: August 24, 2012, Revised: April 11, 2013, Accepted: April 13, 2013
ⓒ2013 The Korean Nutrition Society and the Korean Society of Community Nutrition
This is an Open Access article distributed under the terms of the Creative Commons Attribution Non-Commercial License (http://creativecommons.org/licenses/by-nc/3.0/) which permits unrestricted non-commercial use, distribution, and reproduction in any medium, provided the original work is properly cited.
Men
(n = 71) Women
(n = 157) Total
(n = 228) P-value Mean (SEM)
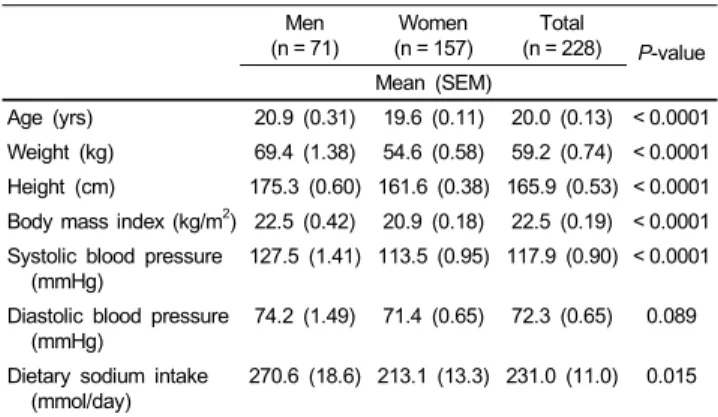
Age (yrs) 20.9 (0.31) 19.6 (0.11) 20.0 (0.13) < 0.0001 Weight (kg) 69.4 (1.38) 54.6 (0.58) 59.2 (0.74) < 0.0001 Height (cm) 175.3 (0.60) 161.6 (0.38) 165.9 (0.53) < 0.0001 Body mass index (kg/m2) 22.5 (0.42) 20.9 (0.18) 22.5 (0.19) < 0.0001 Systolic blood pressure
(mmHg)
127.5 (1.41) 113.5 (0.95) 117.9 (0.90) < 0.0001 Diastolic blood pressure
(mmHg) 74.2 (1.49) 71.4 (0.65) 72.3 (0.65) 0.089 Dietary sodium intake
(mmol/day) 270.6 (18.6) 213.1 (13.3) 231.0 (11.0) 0.015 Student’s t-test between men and women.
Table 1. Characteristics of the subjects
consumption [11,12,15-17]. Some researchers have also attempted to elucidate the relationship between dietary sodium intake and frequency of meals and snacks [18-20]; nonetheless, some contradiction on this relationship still exists.
The present study aimed at determining the association between dietary sodium intake and certain factors related to dietary habits, including meal and snack frequency and taste preference, in young Korean adults in their 20s.
Subjects and Methods
Subjects
Two hundred and seventy-eight students in a university in Gyeonggi Province in the Republic of Korea participated in the survey. Among them, 50 students who provided incomplete information on the survey questionnaires or who were diagnosed with hypertension were excluded from the analyses. Of the remaining 228 students selected, 71 (31.1%) were men and 157 (68.9%) were women; their ages ranged from 20 to 26 years.
Written informed consent was obtained from the participants.
Measurements
The survey was conducted in November 2008, using the self-administered questionnaire on sex, age, weight, height, frequency of meals and snacks, taste preference, alcohol drinking, and smoking. Snacks were defined as foods consumed between meals. To measure preference for salty, sweet, sour, and pungent tastes, a 5-point hedonic scale (1 = extreme dislike, 5 = extreme preference) was used. On the basis of this response, taste preference was classified into 3 categories: “low” (1 or 2 points),
“moderate” (3 points), and “high” (4 or 5 points) because of the small proportion of subjects that chose 1 or 5 points. To investigate dietary sodium intake, a 125-item dish-frequency questionnaire (DFQ) [21] was used instead of a food-frequency questionnaire (FFQ), which was developed to estimate the habitual sodium intake suitable for Koreans, who usually enjoy soups, stews, and pickled vegetables such as kimchi. The DFQ results significantly correlated with the 24-h urinary sodium estimates, and this questionnaire can be used quantitatively to estimate the sodium intake of adults [21]. When the actual sodium intake of food in soup was calculated, sodium content in the leftover broth was subtracted from the total sodium content of the food [22]. Alcohol drinking and smoking statuses were determined by the subjects’ responses to questions on the frequency of drinking per week and the number of cigarettes smoked per day.
Blood pressure was measured twice between 10 a.m. and 12 a.m. while the subjects were seated, with a 5-minute rest period and using automatic sphygmomanometers (HEM 780, Omron automatic blood pressure monitor; Japan). The mean of the 2
measurements was used in the analyses. We defined hypertension as systolic blood pressure (SBP) ≥ 140 mmHg and/or diastolic blood pressure (DBP) ≥ 90 mmHg, and prehypertension as 120 mmHg ≤ SBP < 140 mmHg and/or 80 mmHg ≤ DBP < 90 mmHg by the Joint National Committee 7 criteria [23].
Statistical analysis
All values except for the number of subjects (%) and correlation coefficients are presented as mean (SEM). An analysis of variance (ANOVA) was performed to determine differences between the 3 groups and was followed by the Student-Newman- Keuls test, which was used for comparisons after the performed analysis was found to be significant. Student’s t-test or chi-square tests were performed to determine differences between 2 groups.
The correlation of dietary sodium intake with blood pressure was examined using a partial correlation analysis, adjusting for age, body mass index (BMI), alcohol drinking, and smoking status.
Correlations of dietary sodium intake with BMI and with snack frequency were analyzed using Pearson’s and Spearman’s rank correlation tests, which measured the correlations between 2 continuous variables and between 1 continuous variable and 1 ordinal numeric variable, respectively. SAS 9.2 statistical software (SAS Institute Inc., Cary, NC) was used for all analyses.
Statistical significance was considered at P < 0.05.
Results
A total of 228 subjects (71 men and 157 women) were included in this study to assess the associations of sodium intake with blood pressure, taste preference, and dietary habits, including meal and snack frequency and snacking time. Characteristics of the study subjects are shown in Table 1.
Blood pressure
The mean values (SEM) of SBP and DBP of men were 127.5
(1.41) and 74.2 (1.49) mmHg, and the mean values of women
Men (n = 71)
Women (n = 157)
Total
(n = 228) χ2-value No. of subjects (%)
Prehypertension1) 48 (67.6) 40 (25.5) 88 (38.6) 6.4978*
Hypertension
Stage I2) 7 (9.9) 0 (0) 7 (3.1)
Stage II3) 4 (5.6) 1 (0.6) 5 (2.2)
Salty taste preference 1.0677
Low 19 (26.8) 51 (32.5) 70 (30.7)
Moderate 30 (42.3) 66 (42.0) 96 (42.1)
High 22 (31.0) 40 (25.5) 62 (27.2)
Sweet taste preference 8.4706*
Low 13 (18.3) 34 (21.7) 47 (20.6)
Moderate 39 (54.9) 55 (35.0) 94 (41.2)
High 19 (26.8) 68 (43.3) 87 (38.2)
Sour taste preference 10.8879**
Low 37 (52.1) 86 (54.8) 123 (53.9)
Moderate 30 (42.3) 40 (25.5) 70 (30.7)
High 4 (5.6) 31 (19.7) 35 (15.4)
Pungent taste preference 11.4510**
Low 24 (33.8) 31 (19.7) 55 (24.1)
Moderate 29 (40.8) 50 (31.8) 79 (34.6)
High 18 (25.4) 76 (48.4) 94 (41.2)
Frequency of meals 0.6394
Once a day 3 (4.2) 8 (5.1) 11 (4.8)
Twice a day 42 (59.2) 84 (53.5) 126 (55.3) Thrice a day 26 (36.6) 65 (41.4) 91 (39.9)
Frequency of snacks 2.4300
Once or less a day 38 (53.5) 67 (42.7) 105 (46.1) Twice a day 22 (31.0) 63 (40.1) 85 (37.3) Thrice or more a day 11 (15.5) 27 (17.2) 38 (16.7) Chi-square tests; *P< 0.05, **P< 0.01.
1)120 mmHg ≤ systolic blood pressure < 140 mmHg and/or 80 mmHg ≤ diastolic blood pressure < 90-99 mmHg.
2)Systolic blood pressure 140-159 mmHg or diastolic blood pressure 90-99 mmHg.
3)Systolic blood pressure ≥ 160 mmHg or diastolic blood pressure ≥ 100 mmHg.
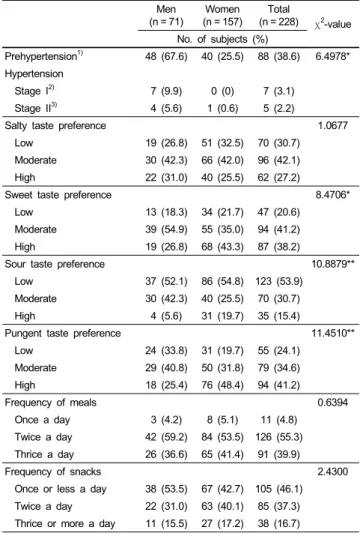
Table 2. Blood pressure distribution, taste preference and snack frequency of the subjects
Dietary sodium intake
Men Women Total
Correlation coefficient (P-value) Systolic blood pressure1) 0.205 (0.087) 0.076 (0.346) 0.193 (0.003) Diastolic blood pressure1) 0.064 (0.596) 0.037 (0.648) 0.073 (0.275) Body mass index2) 0.335 (0.006) 0.075 (0.371) 0.207 (0.002) Snack frequency3) -0.258 (0.027) -0.172 (0.036) -0.174 (0.009)
1)Partial correlation, adjusted for age, body mass index, alcohol drinking, and smoking.
2)Partial correlation, adjusted for age, alcohol drinking, and smoking.
3)Spearman correlation.
Table 3. Correlation of dietary sodium intake with blood pressure, body mass index and snack frequency
Frequency of meals
P-value Once a day Twice a day Thrice a day
mmol/day
Men 68.5 (37.0)b 252.9 (25.6)a 322.6 (24.5)a 0.002 Women 150.4 (41.2) 212.6 (18.9) 221.3 (20.4) 0.373 Total 108.5 (32.7)b 226.0 (15.3)a 250.3 (16.8)a 0.011 Data are presented as mean (SEM).
ANOVA followed by Student-Newman-Keuls test; numbers with different letters in the same row are significantly different from the others.
Table 4. Dietary sodium intake according to meal frequency
Time of snacks
P-value
Morning Afternoon Evening
mmol/day
Men 175.8 (32.3)b 257.0 (22.9)ab 287.7 (25.5)a 0.0143 Women 201.7 (47.5) 202.4 (11.8) 216.1 (23.4) 0.8683 Total 191.6 (31.0) 215.9 (10.9) 251.9 (17.8) 0.1164 Data are presented as mean (SEM).
ANOVA followed by Student-Newman-Keuls test; numbers with different letters in the same row are significantly different from the others.
Table 5. Dietary sodium intake according to time of snacks
were 113.5 (0.95) and 71.4 (0.65) mmHg, respectively (Table 1). As presented in Table 2, among the 71 men, 48 (67.6%) were prehypertensive, 7 (9.9%) were stage 1 hypertensive, and 4 (5.6%) were stage 2 hypertensive. Among the 157 women, 40 (25.5%) were prehypertensive and 1 (0.6%) was stage 2 hypertensive.
Dietary sodium intake
The mean dietary sodium intake of men was 270.6 (18.6) mmol/day (equivalent to 6,224 mg of sodium or 15.8 g of sodium chloride), and that of women was 213.1 (13.3) mmol/day (equivalent to 4,901 g of sodium or 12.5 g of sodium chloride), which were approximately 310% and 245% of the daily sodium intake goal of Korean adults, respectively (Table 1).
Taste preference
In the total group, most subjects belonged to the taste preference categories of moderate-salty (42.1%), moderate-sweet (41.2%), low-sour (53.9%), and high-pungent (31.2%). In terms of the meal and snack frequency categories, most subjects in the total group consumed meals twice a day (55.3%) and snacks once or less per day (46.1%) (Table 2).
Relationship between dietary sodium intake and blood pressure, BMI, and snack frequency
Table 3 lists the partial correlation coefficients between dietary
sodium intake and blood pressure adjusted for age, BMI, alcohol
drinking, and smoking; between dietary sodium intake and BMI
adjusted for age, alcohol drinking, and smoking; and between
dietary sodium intake and frequency of snacking. Significant and
positive relationships between dietary sodium intake and SBP
were noted in the total group and between dietary sodium intake
and BMI in the total and men-only groups. In each of the groups,
dietary sodium intake was negatively associated with snacking
frequency.
Salty taste preference P- value
Sweet taste preference P- value
Sour taste preference P- value
Pungent taste preference P- value
Low Moderate High Low Moderate High Low Moderate High Low Moderate High
mmol/day mmol/day mmol/day mmol/day
Men 245.94
(13.06) 263.59 (25.83)
301.48
(40.09) 0.509 281.7 (33.8)
269.6 (26.6)
265.1
(38.2) 0.694 239.3 (21.7)
309.3 (33.2)
269.9
(31.5) 0.331 250.1 (28.0)
297.7 (33.1)
254.3 (34.8) 0.487 Women 158.45
(12.09)b 215.23 (19.62)b
279.12
(35.93)a 0.002 164.7 (21.4)b
178.7 (14.4)b
265.0
(25.3)a 0.002 206.6 (19.9)
224.3 (23.7)
216.6
(25.3) 0.853 185.3 (22.3)
180.4 (13.5)
202.4 (19.7) 0.558 Total 182.20
(13.28)b 230.34 (15.81)b
287.06
(27.03)a 0.001 197.0 (19.5)b
216.4 (14.6)b
265.1
(21.3)a 0.041 216.4 (15.4)
260.7 (20.1)
222.7
(23.7) 0.194 213.6 (17.9)
223.5 (16.1)
230.1 (20.5) 0.431 Data are presented as mean (SEM).
ANOVA followed by Student-Newman-Keuls test; numbers with different letters in the same row are significantly different from the others.
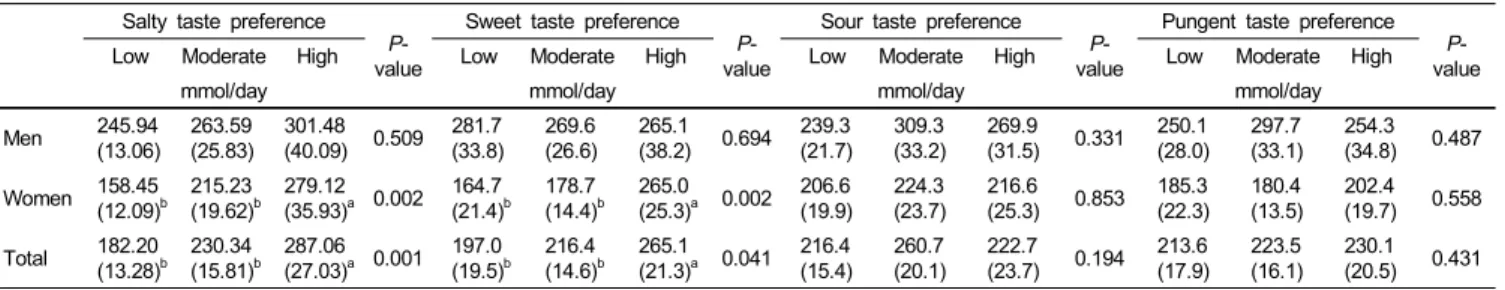
Table 6. Dietary sodium intake according to taste preference
Relationship between dietary sodium intake and meal frequency, snack time, and taste preference
The mean dietary sodium intake according to meal frequency is provided in Table 4. In the total and men-only groups, those who consumed meals twice or thrice a day consumed more sodium than those who consumed 1 meal a day. Table 5 describes the mean dietary sodium intake according to time of snacks. In the men-only group, those who ate snacks in the evening consumed more sodium than those who ate snacks in the morning. Table 6 shows the mean dietary sodium intake according to taste preference. In the total and women-only groups, those with a high preference for salty or sweet tastes had higher dietary sodium intake than those with a low or moderate preference, respectively. There were no significant differences in the mean dietary sodium intake according to preference for sour and pungent tastes.
Discussion
In the present study, blood pressure, BMI, meal and snack frequency, snacking time, and taste preference were investigated with respect to dietary sodium intake in young Korean adults in their 20s. Among the study subjects, 15.5% of men (n = 11) and 0.6% of women (n = 1) were hypertensive, which was lower than the prevalence of hypertension in Koreans aged 30 years or above [5] because the subjects were still younger adults in their 20s. Additionally, 48 (67.6%) men and 40 (25.5%) women, a relatively large number of subjects, were classified as prehypertensive patients. Lifestyle modifications have more important implications in prehypertension than in hypertension, because prehypertensionis not a disease category, but rather a high-risk factor for developing hypertension and does not yet require medication [23]. Thus, such a relatively high proportion of prehypertension in these young subjects indicates that lifestyle modifications should be urgently implemented to prevent hypertension and related diseases in the future.
The body effectively prevents the accumulation of salt and fluid by increasing the blood pressure to such an extent that pressure-induced increase in salt and water excretions matches the excessive sodium intakes [24]. Thus, excess dietary sodium
intake is one of the causal factors for hypertension, and the intake of sodium is an important factor that needs to be considered when investigating groups at high risk of hypertension. For evaluating daily dietary sodium intake of subjects, several tools have been developed, such as dietary recall or records, FFQs, and 24-h urinary sodium estimates. Among these tools, 24-h urinary sodium estimates are considered the most reliable, but the test lays a substantial burden on subjects because it is difficult for them to collect complete urine samples for 24 h [25]. In contrast, FFQs are cost-effective, easier to administer, and used in large-scale epidemiological studies [26]. However, a report showed that the sodium intake was underestimated when a FFQ was used for Koreans because it could not calculate the amount of sodium used in cooking process, which contributes to more than 70% of the total sodium intake of Koreans [27]. In the present study, therefore, dietary sodium intake of the subjects has been investigated by a DFQ, which was newly developed as an appropriate tool for Koreans, by considering sodium used in the cooking process and remaining in the leftover broth [22].
The mean dietary sodium intakes of men and women were 270.6 mmol/day (equivalent to 6,224 mg of sodium or 15.8 g of sodium chloride) and 213.1 mmol/day (equivalent to 4,901 mg of sodium or 12.5 g of sodium chloride) respectively, which were approximately 310% and 245% of the daily sodium intake goal of Koreans.
Another study using the same DFQ tools reported similar results, 277.4 mmol/day (equivalent to 6,381 mg of sodium or 16.2 g of sodium chloride) for men and 228.6 mmol/day (equivalent to 5,257 mg of sodium or 13.4 g of sodium chloride) for women, respectively [22]. In the Korea National Health and Nutrition Examination Survey (KNHANES), the mean dietary sodium intakes for men and women aged 19-29 years were 255.2 mmol/day (equivalent to 5,869 mg of sodium or 14.9 g of sodium chloride) and 175.9 mmol/day (equivalent to 4,045 mg of sodium or 10.3 g of sodium chloride), respectively [4], which are lower than the corresponding results of the present study. Considering the very high sodium intake reported, reduction in sodium intake is very important in order to prevent hypertension.
Reliable evidence has warranted greater attention to the
importance of SBP as a major risk factor for cardiovascular
diseases (CVDs), which continuously increases throughout life,
in contrast to DBP [23]. In the present study, the sodium intake
of the total group was positively correlated with SBP. Clinical trials have demonstrated that control of isolated systolic hyper- tension reduces total mortality, cardiovascular mortality, stroke, and heart failure events [28-30]. However, there was no statistically significant positive correlation between SBP and sodium intake when adjusted for sex (data not shown). These results may be due to the high SBP in men. Dietary sodium intake was also shown to be positively correlated with BMI in the total and men-only groups. Dietary sodium intake has been reported to be associated with ghrelin, a hormone with appetite-stimulating and adipogenic properties [31], as well as with BMI and body fat percentage, independent of the total calorie intake [32]. In a recent study, overweight and obesity were associated with adipose tissue dysfunction, resulting in chronic vascular inflammation, oxidative stress, activation of the renin-angiotensin- aldosterone system, and sympathetic overdrive, eventually leading to hypertension [33].
Taste is the most important factor affecting food selection and intake [34,35]. In the present study, the relationships between dietary sodium intake and preferences for 4 kinds of taste-salty, sweet, sour, and pungent-were investigated. Among these tastes, salty taste preference was positively associated with sodium intake in the total and women-only groups. Salt preference is assumed to be reflective of an individual's attitude toward and response to salty foods [11,12] and has been used for the qualitative evaluation of salt intake as an indirect tool [10,36,37], although salt preference, especially that which is self-evaluated, has been found to be too subjective to completely replace dietary sodium intake [17]. In addition, dietary sodium intake might be related with sweet taste, as shown in the present study in the total and women-only groups. It was reported that salt intake was related to sugar-sweetened soft drink consumption [38], which may increase the preference for sweet taste by prolonged exposure [39]. These results also show that there may be gender differences in the intake of nutrients or food according to taste preferences. A previous study reported that taste preferences were the strongest mediator of food intakes especially in women [40].
In the present study, however, sugar-containing food intake was not measured, and its relationship with sodium intake could not be investigated. This is one of the limitations of the present study.
Meals are generally described as one of the main eating occasions of the day, nominally occurring at morning (breakfast), mid-day (lunch), or evening (dinner), in a colloquial sense, while the term snacks refers to other eating episodes, generally smaller and less structured than meals [41]. In the present study, dietary sodium intake of those who consumed 2 or 3 meals per day was higher than that of those who consumed 1 meal per day in the total and men-only groups. A traditional Korean meal is typically composed of steamed rice, kimchi, several kinds of side dishes, and a soup or a stew including plant foods, and is considered a healthy diet because it is low in fat and rich in vitamins, minerals, and dietary fiber [42,43]. However, KNHANES reported that rice intake was positively correlated
with sodium intake [44], which suggests that traditional Korean meals might be high in sodium content, as sodium is added while cooking soups, stews, and side dishes, including kimchi. The types of meals, whether traditional or not, were not investigated in the present study, and it was difficult to elucidate a relationship between the frequency of the traditional rice-based meals and dietary sodium intake.
In the present study, the frequency of snacking was negatively correlated with dietary sodium intake in the total, men-only, and women-only groups. Evidence suggests that diet quality improves as the number of eating occasions increase [18,45,46], and a higher eating frequency is associated with reduced cardiometabolic risk factors [45,47]. In the studies reporting the abovementioned points, “eating frequency” was defined as the frequency of snacking rather than the mean number of meals consumed, and those who ate more often were not just snacking on “empty foods” but choosing foods that contribute to a healthy diet. In addition, increased eating frequency is associated with greater appetite control, and this may result in reduced total energy intake and weight loss [48,49], affecting cardiometabolic risk factors [45]. These results suggest that frequent snacks can not only contribute to a reduction in total energy intake by controlling the appetite, but also have a positive impact on the reduction of sodium intake. Several studies also suggest that nutrient intake must be adjusted for total calorie intake [19,50] because different individuals may have different sodium intakes according to their calorie requirements [50]. In the present study, however, the dietary sodium intake could not be adjusted for the subjects’ total calorie intake, because total calorie intake was not investigated, and food composition of the snacks was not analyzed. In addition, there was no significant correlation between frequency of meals and snacks. The study of food composition of snacks and their relationship with sodium intake should be evaluated further.
The timing of snacks might also be associated with the intake of sodium. A study reported that college students consumed salted snack items mostly as evening snacks, rather than as daytime snacks [51]. In the present study, those who ate snacks at night consumed more sodium than those who ate snacks in the morning. While snacks in the evening were correlated with a high sodium intake, snacks in the daytime may improve the quality of food intake and have beneficial effects on health, such as reductions in the total energy and sodium intakes.
In conclusion, the level of dietary sodium intake of young
Korean adults in their 20s was very high and positively related
with SBP in the total group and BMI in the total and men-only
groups. Due to the relatively higher proportion of prehypertensive
patients, reduction of sodium intake is considered an important
issue. To reduce sodium intake, dietary habits found to be
correlated with increased sodium intake, such as eating frequency
and late-night snacking, should be controlled. Sodium intake was
also positively correlated with a preference for sweet taste as
well as salty taste in the total and women-only groups. Further
studies on the relationship of dietary sodium intake with
sugar-containing or sweet-taste foods, snack frequency, and food composition of snacks and on the relationship of meal or snack frequency with the quality of dietary intake are necessary.
References
1. Whelton PK, He J, Appel LJ, Cutler JA, Havas S, Kotchen TA, Roccella EJ, Stout R, Vallbona C, Winston MC, Karimbakas J;
National High Blood Pressure Education Program Coordinating Committee. Primary prevention of hypertension: clinical and public health advisory from The National High Blood Pressure Education Program. JAMA 2002;288:1882-8.
2. Intersalt Cooperative Research Group. Intersalt: an international study of electrolyte excretion and blood pressure. Results for 24 hour urinary sodium and potassium excretion. BMJ 1988;297:
319-28.
3. Sacks FM, Svetkey LP, Vollmer WM, Appel LJ, Bray GA, Harsha D, Obarzanek E, Conlin PR, Miller ER 3rd, Simons- Morton DG, Karanja N, Lin PH; DASH-Sodium Collaborative Research Group. Effects on blood pressure of reduced dietary sodium and the Dietary Approaches to Stop Hypertension (DASH) diet. N Engl J Med 2001;344:3-10.
4. Ministry of Health and Welfare, Korea Centers for Disease Control and Prevention. The fifth Korea National Health and Nutrition Examination Survey (KNHANES V). Cheongwon:
Korea Centers for Disease Control and Prevention; 2011.
5. Ministry of Health and Welfare, Korea Centers for Disease Control and Prevention. The fourth Korea National Health and Nutrition Examination Survey (KNHANES IV). Cheongwon:
Korea Centers for Disease Control and Prevention; 2010.
6. Franklin SS, Gustin W 4th, Wong ND, Larson MG, Weber MA, Kannel WB, Levy D. Hemodynamic patterns of age-related changes in blood pressure. The Framingham Heart Study.
Circulation 1997;96:308-15.
7. Mattes RD. The taste for salt in humans. Am J Clin Nutr 1997;65:692S-697S.
8. White MM, Samson WK. A possible relationship between brain- derived adrenomedullin and oxytocin in the regulation of sodium balance. J Endocrinol 2009;203:253-62.
9. Schechter PJ, Horwitz D, Henkin RI. Sodium chloride preference in essential hypertension. JAMA 1973;225:1311-5.
10. Zhang Z, Zhang X. Salt taste preference, sodium intake and gastric cancer in China. Asian Pac J Cancer Prev 2011;12:
1207-10.
11. Kim GH, Lee HM. Frequent consumption of certain fast foods may be associated with an enhanced preference for salt taste. J Hum Nutr Diet 2009;22:475-80.
12. Watanabe M, Kudo H, Fukuoka Y, Hatakeyama A, Kudo H, Kodama H, Izumo Y, Sasaki H. Salt taste perception and salt intake in older people. Geriatr Gerontol Int 2008;8:62-4.
13. Lauer RM, Filer LJ, Reiter MA, Clarke WR. Blood pressure, salt preference, salt threshold, and relative weight. Am J Dis Child 1976;130:493-7.
14. Pangborn RM, Pecore SD. Taste perception of sodium chloride in relation to dietary intake of salt. Am J Clin Nutr 1982;35:
510-20.
15. Kim J, Park S, Nam BH. Gastric cancer and salt preference: a population-based cohort study in Korea. Am J Clin Nutr 2010;
91:1289-93.
16. Bertino M, Beauchamp GK, Engelman K. Increasing dietary salt alters salt taste preference. Physiol Behav 1986;38:203-13.
17. Drewnowski A, Henderson SA, Driscoll A, Rolls BJ. Salt taste perceptions and preferences are unrelated to sodium consumption in healthy older adults. J Am Diet Assoc 1996;96:471-4.
18. Hampl JS, Heaton CL, Taylor CA. Snacking patterns influence energy and nutrient intakes but not body mass index. J Hum Nutr Diet 2003;16:3-11.
19. Kerver JM, Yang EJ, Obayashi S, Bianchi L, Song WO. Meal and snack patterns are associated with dietary intake of energy and nutrients in US adults. J Am Diet Assoc 2006;106:46-53.
20. Ovaskainen ML, Reinivuo H, Tapanainen H, Hannila ML, Korhonen T, Pakkala H. Snacks as an element of energy intake and food consumption. Eur J Clin Nutr 2006;60:494-501.
21. Son SM, Park YS, Lim WJ, Kim SB, Jeong YS. Development and evaluation of validity of short Dish Frequency Questionnaire (DFQ) for estimation of habitual sodium intake for Korean adults. Korean J Community Nutr 2007;12:838-53.
22. Son SM, Park YS, Lim HJ, Kim SB, Jeong YS. Sodium intakes of Korean adults with 24-hour urine analysis and Dish Frequency Questionnaire and comparison of sodium intakes according to the regional area and dish group. Korean J Community Nutr 2007;12:
545-58.
23. Chobanian AV, Bakris GL, Black HR, Cushman WC, Green LA, Izzo JL Jr, Jones DW, Materson BJ, Oparil S, Wright JT Jr, Roccella EJ; National High Blood Pressure Education Program Coordinating Committee. Seventh report of the Joint National Committee on Prevention, Detection, Evaluation, and Treatment of High Blood Pressure. Hypertension 2003;42: 1206-52.
24. Karppanen H, Mervaala E. Sodium intake and hypertension. Prog Cardiovasc Dis 2006;49:59-75.
25. Tanaka T, Okamura T, Miura K, Kadowaki T, Ueshima H, Nakagawa H, Hashimoto T. A simple method to estimate populational 24-h urinary sodium and potassium excretion using a casual urine specimen. J Hum Hypertens 2002;16:97-103.
26. Willett W. Foreword. The validity of dietary assessment methods for use in epidemiologic studies. Br J Nutr 2009;102 Suppl 1:S1-2.
27. Nam HW, Lee KY. A study on the sodium and potassium intakes and their metabolism of the pregnant women in Korea. Korean J Nutr 1985;18:194-200.
28. Kostis JB, Davis BR, Cutler J, Grimm RH Jr, Berge KG, Cohen JD, Lacy CR, Perry HM Jr, Blaufox MD, Wassertheil-Smoller S, Black HR, Schron E, Berkson DM, Curb JD, Smith WM, McDonald R, Applegate WB. Prevention of heart failure by antihypertensive drug treatment in older persons with isolated systolic hypertension. SHEP Cooperative Research Group. JAMA 1997;278:212-6.
29. SHEP Cooperative Research Group. Prevention of stroke by antihypertensive drug treatment in older persons with isolated systolic hypertension. Final results of the Systolic Hypertension in the Elderly Program (SHEP). JAMA 1991;265:3255-64.
30. Staessen JA, Thijs L, Fagard R, O'Brien ET, Clement D, de Leeuw PW, Mancia G, Nachev C, Palatini P, Parati G, Tuomilehto J, Webster J. Predicting cardiovascular risk using conventional vs ambulatory blood pressure in older patients with systolic hypertension. Systolic Hypertension in Europe Trial Investigators.
JAMA 1999;282:539-46.
31. Brownley KA, Light KC, Grewen KM, Hinderliter AL, West SG.
Dietary sodium restriction alters postprandial ghrelin: implica-
tions for race differences in obesity. Ethn Dis 2006;16:844-51.
32. Ellison RC, Sosenko JM, Harper GP, Gibbons L, Pratter FE, Miettinen OS. Obesity, sodium intake, and blood pressure in adolescents. Hypertension 1980;2:78-82.
33. Dorresteijn JA, Visseren FL, Spiering W. Mechanisms linking obesity to hypertension. Obes Rev 2012;13:17-26.
34. Glanz K, Basil M, Maibach E, Goldberg J, Snyder D. Why Americans eat what they do: taste, nutrition, cost, convenience, and weight control concerns as influences on food consumption.
J Am Diet Assoc 1998;98:1118-26.
35. Frank RA, van der Klaauw NJ. The contribution of chemosensory factors to individual differences in reported food preferences.
Appetite 1994;22:101-23.
36. Wakai K. A review of food frequency questionnaires developed and validated in Japan. J Epidemiol 2009;19:1-11.
37. Clark AJ, Mossholder S. Sodium and potassium intake measure- ments: dietary methodology problems. Am J Clin Nutr 1986;
43:470-6.
38. He FJ, Marrero NM, MacGregor GA. Salt intake is related to soft drink consumption in children and adolescents: a link to obesity? Hypertension 2008;51:629-34.
39. Sartor F, Donaldson LF, Markland DA, Loveday H, Jackson MJ, Kubis HP. Taste perception and implicit attitude toward sweet related to body mass index and soft drink supplementation.
Appetite 2011;57:237-46.
40. Brug J, Tak NI, te Velde SJ, Bere E, de Bourdeaudhuij I. Taste preferences, liking and other factors related to fruit and vegetable intakes among schoolchildren: results from observational studies.
Br J Nutr 2008;99 Suppl 1:S7-14.
41. Gatenby SJ. Eating frequency: methodological and dietary aspects. Br J Nutr 1997;77 Suppl 1:S7-20.
42. Lee MJ, Popkin BM, Kim S. The unique aspects of the nutrition
transition in South Korea: the retention of healthful elements in their traditional diet. Public Health Nutr 2002;5:197-203.
43. Kim S, Moon S, Popkin BM. The nutrition transition in South Korea. Am J Clin Nutr 2000;71:44-53.
44. Ministry of Health and Welfare, Korea Centers for Disease Control and Prevention. The third Korea National Health and Nutrition Examination Survey (KNHANES III). Cheongwon:
Korea Centers for Disease Control and Prevention; 2006.
45. Smith KJ, Blizzard L, McNaughton SA, Gall SL, Dwyer T, Venn AJ. Daily eating frequency and cardiometabolic risk factors in young Australian adults: cross-sectional analyses. Br J Nutr 2012;108:1086-94.
46. Kerr MA, Rennie KL, McCaffrey TA, Wallace JM, Hannon- Fletcher MP, Livingstone MB. Snacking patterns among adolescents:
a comparison of type, frequency and portion size between Britain in 1997 and Northern Ireland in 2005. Br J Nutr 2009;101:
122-31.
47. Bhutani S, Varady KA. Nibbling versus feasting: which meal pattern is better for heart disease prevention? Nutr Rev 2009;67:
591-8.
48. Speechly DP, Rogers GG, Buffenstein R. Acute appetite reduction associated with an increased frequency of eating in obese males.
Int J Obes Relat Metab Disord 1999;23:1151-9.
49. Speechly DP, Buffenstein R. Greater appetite control associated with an increased frequency of eating in lean males. Appetite 1999;33:285-97.
50. Alderman MH, Cohen H, Madhavan S. Dietary sodium intake and mortality: the National Health and Nutrition Examination Survey (NHANES I). Lancet 1998;351:781-5.
51. Khan MA. Sodium intake from meals and snacks consumed by college students. J Am Diet Assoc 1983;82:664-6.