http://e-nrp.org
Dietary patterns and cardio-cerebrovascular disease in a Chinese population
Honglin Wang, Meng Qu, Peirong Yang, Biao Yang and Feng Deng
§Baoji Center for Disease Control and Prevention, XiBao Road No. 68, Baoji, Shaanxi, China
BACKGROUND/OBJECTIVES: Dietary pattern and its association with cardio-cerebrovascular disease have not been studied in Baoji city by now. This study was aimed to identify the dietary patterns among Chinese adults in Baoji, and explore the association between these dietary patterns and cardio-cerebrovascular disease.
SUBJECTS/METHODS: A total of 4,968 participants were included in this study at 12 counties. With multistage stratified random sampling and semi quantitative food frequency questionnaire, the prevalence of cardio-cerebrovascular disease and dietary intake were investigated in 2013. We used factor analysis to establish dietary patterns.
RESULTS: A total of 4,968 participants over 15 years old were included in this study. Five dietary patterns were identified in Baoji: protein, balanced, beans, prudent, and traditional patterns. The protein dietary pattern mainly included animal and plant proteins and was negatively associated with hypertension as well as stroke. The balanced pattern included carbohydrates, protein, and fat and was negatively associated with hypertension as well as stroke. The beans pattern was mainly beans and beans products and was negatively associated with hypertension. The prudent pattern only included staple foods and pickled vegetables and was positively associated with hypertension as well as coronary heart disease. The traditional pattern was representative of local Baoji traditional recipes and was positively associated with hypertension.
CONCLUSIONS: The protein, balanced, and beans dietary patterns showed many protective effects on cardio-cerebrovascular disease. Based on these results, Baoji city residents should be encouraged to choose protein, balanced, and beans dietary patterns and abandon prudent and traditional patterns to prevent incidence of hypertension, coronary heart disease, and stroke.
Nutrition Research and Practice 2015;9(3):313-318; doi:10.4162/nrp.2015.9.3.313; pISSN 1976-1457 eISSN 2005-6168
Keywords: Dietary patterns, factor analysis, cardio-cerebrovascular disease, Chinese
INTRODUCTION
*According to a study by the World Health Organization (WHO), cardiovascular disease is responsible for 33.7% of all deaths worldwide, whereas other chronic diseases are responsible for 26.5% [1]. Globally, it has been estimated that premature deaths resulting from hypertension reach approximately 7.1 million annually, which account for 64 million disability-adjusted life years (DALYs) [2]. Hypertension plays a major etiologic role in the development of ischemic heart disease, cerebrovascular disease, and cardiac and renal failure, and it is a significant risk factor for mortality and disability rates throughout the world [3].
Dietary patterns consider the interactions between all kinds of foods and nutrients and represent a broader picture of food and nutrient consumption, suggesting they may be more predictive of disease risk than individual food or nutrients [4].
In addition, dietary patterns have become a focus for nutritional research [5]. Factor analysis of dietary patterns can elucidate the proportions of all types of foods by dimension reduction.
Factor loading represents the correlation coefficient between foods and patterns. A positive loading indicates a positive association with the factor while a negative loading indicates a negative association with the factor. Larger loading of a given food item indicates greater contribution of that food item to the specific factor.
Dietary habits in Asians such as Chinese [6] are substantially different from those of Westerners. Therefore, it is important to examine dietary patterns and their associations with non- communicable diseases among people in China. Dietary habits in Northwest China such as Baoji are different from those in other cities. Further, dietary patterns and their associations with hypertension, coronary heart disease, stroke, and other chronic diseases have not been studied in Baoji, which is a represen- tative city of western China.
The present study surveyed the dietary and health status of residents over 15 years old in Baoji, identified dietary patterns among Chinese adults, and determined whether or not these dietary patterns are associated with chronic diseases (e.g.
hypertension, coronary heart disease, stroke) in order to provide
This work received the financial support from Shaanxi Provincial Department of health (Grant No. S2012027).
§Corresponding Author: Feng Deng, Tel. 09-17-356-3593, Fax. 09-17-336-5567, Email. [email protected] Received: May 14, 2014, Revised: October 14, 2014, Accepted: October 16, 2014
This is an Open Access article distributed under the terms of the Creative Commons Attribution Non-Commercial License (http://creativecommons.org/licenses/by-nc/3.0/) which permits unrestricted non-commercial use, distribution, and reproduction in any medium, provided the original work is properly cited.
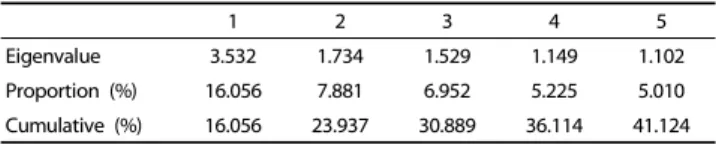
1 2 3 4 5
Eigenvalue 3.532 1.734 1.529 1.149 1.102
Proportion (%) 16.056 7.881 6.952 5.225 5.010
Cumulative (%) 16.056 23.937 30.889 36.114 41.124
Table 1. The eigenvalue of Correlation matrix
recommendations for improving food intakes.
SUBJECTS AND METHODS Research design
We designed "The epidemiology questionnaire of Non Comm- unicable Diseases and related risk factors in Baoji city" based on health interviews focused on dietary patterns, family background, body measurement, etc. according to the 2010 Chinese National Chronic Diseases Survey and the Fifth National Health Service Survey.
Study population
This study was based on a population sampling survey according to the Handbook of Baoji city of Shaanxi Province in China using multistage stratified random sampling from the total Baoji population and the Kish Grid method, which was organized by the Baoji City Health Bureau and performed by the Baoji CDC. Inclusion criteria were as follows: age over 15 years, residence in Baoji city for more than 6 months, partici- pated in the study voluntarily, and actively completed the questionnaire and measurement. Exclusion criteria were as follows: age less than 15 years and non-residents. A total of 5,020 participants were included in this study from 12 counties, resulting in 4,968 valid samples. Men numbered 2,519 (50.7%), women numbered 2,449 (49.3%), mean age (standard deviation) was 41.6 (16.3) years, and urban and rural percentages were 36.7% and 63.3%, respectively. The composition of the study population was in accordance with the 2010 Baoji city population.
Survey method and quality control
The questionnaire and anthropometric survey were carried out by well-trained medical examiners. The field investigation was conducted in April 2013. Pre-survey was arranged in each county before the formal investigation using unified survey methods. Height, weight, waist circumference, and blood pressure were obtained using standardized techniques and equipment in an early morning fasting state. Height was measured to the nearest 0.1 cm with subjects standing without shoes. Weight in light clothes was measured to the nearest 0.1 kg. Body mass index (BMI) was calculated as weight divided by the square of height (kg/m
2). Blood pressure was measured in a sitting position. Three measurements were made on all subjects at 5-min intervals, and the average of three measurement was used in the analysis. All subjects in the survey participated voluntarily, and written informed consent was obtained from all subjects. All aspects of design, train, sample, field investiga- tion, data entry, and checks were subjected to quality control.
Assessment of dietary intake
We investigated dietary consumption frequency and quantity over the past year using a semi-quantitative food frequency questionnaire. Amount of each nutrient was converted into grams per person per day using nutrition calculator software and finally merged into daily nutrient consumption per person.
Dietary questionnaire contained questions on edible oil, spices, and 27 types of food. For dietary patterns, similar foods were consolidated as follows: fresh milk, milk powder, and yogurt
into milk; pickles, pickled cabbage, and sauerkraut into pickled vegetables; fruit juice drinks and other beverages into beverages.
Daily intakes of 22 kinds of food were obtained.
Definition of chronic diseases
According to the "Chinese guidelines for prevention and treatment of hypertension (2010 Edition)", hypertension is defined as a systolic blood pressure ≥ 140 mmHg or diastolic blood pressure ≥ 90 mmHg. Information on chronic diseases was collected by a self-reported questionnaire. Coronary heart disease generally refers to coronary atherosclerotic cardiopathy, which can be divided into five clinical types according to the WHO: asymptomatic myocardial ischemia (latent coronary heart disease), ischemic heart failure, angina, myocardial infarction (ischemic heart disease), and sudden death. Stroke, also referred to as cerebral vascular accident, is divided into ischemic stroke and hemorrhagic stroke.
Statistical analysis
Epidata 3.1 was used to double input data, and database was analyzed with SPSS17.0 software after checks. Measurement data were analyzed by mean ± standard deviation, t test, chi-square test, and ANOVA statistical test, and all analyses were performed at a significance level of P < 0.05. Principal component factor analysis was used to identify dietary patterns. Factors were rotated by varimax orthogonal transformation in order to achieve a simpler structure with greater interpretability [7].
Factor number was selected as follows: 1. eigenvalue > 1.0; 2.
plot showing main distribution; 3. proportion of variance explained by each factor but only as a reference; 4. probability of factor extraction.
RESULTS
Factor analysis and dietary patterns
Factor analysis of the Kaiser-Meyer-Olkin measurement was 0.803. Bartlett test of spherical showed P < 0.001. Factor analysis extracted five dietary patterns with eigenvalues all larger than 1.0. The five factors of the cumulative variance contribution rate reached 41.124%, as shown in Table 1.
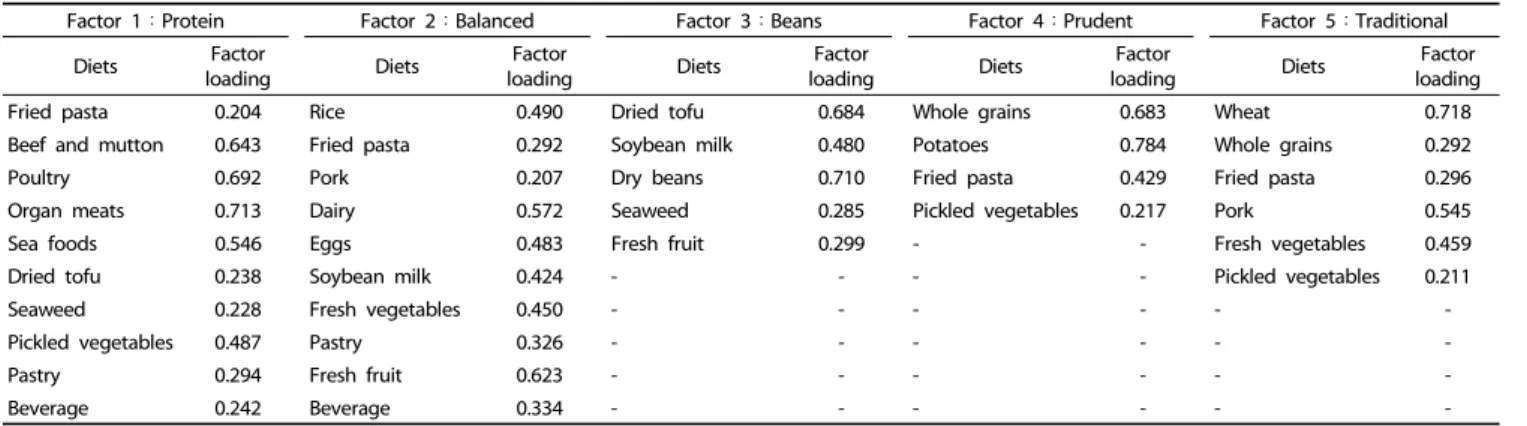
Factor loadings higher than 0.20 (absolute value) were
analyzed, and factors were named according to foods contained
in the dietary pattern: protein, balanced, beans, prudent, and
traditional dietary pattern (Table 2). Factor 1 was characterized
as high positive loadings of fried pasta, beef and mutton,
poultry, organ meat, seafood, dried tofu, seaweed, pickled
vegetables, pastry, and beverages. Factor 2 showed high
positive loadings of rice, fried pasta, pork, dairy, eggs, soybean
milk, fresh vegetables, pastry, fresh fruits, and beverages. Factor
3 showed high positive loadings of dried tofu, soybean milk,
dry beans, seaweed, and fresh fruits. Factor 4 showed high
positive loadings of whole grains, potatoes, fried pasta, and
Factor 1:Protein Factor 2:Balanced Factor 3:Beans Factor 4:Prudent Factor 5:Traditional
Diets Factor
loading Diets Factor
loading Diets Factor
loading Diets Factor
loading Diets Factor
loading
Fried pasta 0.204 Rice 0.490 Dried tofu 0.684 Whole grains 0.683 Wheat 0.718
Beef and mutton 0.643 Fried pasta 0.292 Soybean milk 0.480 Potatoes 0.784 Whole grains 0.292
Poultry 0.692 Pork 0.207 Dry beans 0.710 Fried pasta 0.429 Fried pasta 0.296
Organ meats 0.713 Dairy 0.572 Seaweed 0.285 Pickled vegetables 0.217 Pork 0.545
Sea foods 0.546 Eggs 0.483 Fresh fruit 0.299 - - Fresh vegetables 0.459
Dried tofu 0.238 Soybean milk 0.424 - - - - Pickled vegetables 0.211
Seaweed 0.228 Fresh vegetables 0.450 - - - -
Pickled vegetables 0.487 Pastry 0.326 - - - -
Pastry 0.294 Fresh fruit 0.623 - - - -
Beverage 0.242 Beverage 0.334 - - - -
‘-’ No items
Table 2. The results of dietary patterns identified by factor analysis
Variables Groups Protein Balanced Beans Prudent Traditional
Age (yrs) Q1 43.9 ± 16.2 44.1 ± 16.6 43.6 ± 16.5 40.6 ± 16.1 42.1 ± 16.8
Q2 41.7 ± 16.7 40.6 ± 16.3 40.7 ± 16.4 41.2 ± 16.9 40.8 ± 16.2
Q3 39.2 ± 15.7 40.1 ± 15.8 40.5 ± 15.9 43.0 ± 15.8 41.9 ± 15.8
F 34.8* 30.2* 18.2* 10.0* 2.9#
Gender (Male/Female) Q1 915/741 842/814 879/777 752/904 736/920
Q2 791/865 867/789 842/814 911/745 814/842
Q3 813/843 810/846 798/858 856/800 969/687
χ2 21.2* 1.2# 7.9* 31.5* 68.0*
BMI (kg/m2) Q1 22.8 ± 2.9 22.9 ± 3.0 22.8 ± 2.9 22.8 ± 2.9 22.8 ± 3.0
Q2 22.8 ± 2.9 22.8 ± 2.9 22.9 ± 3.0 22.8 ± 2.9 22.8 ± 2.9
Q3 22.9 ± 3.0 22.8 ± 2.9 22.8 ± 2.9 22.9 ± 3.0 22.9 ± 3.0
F 0.5# 0.7# 0.6# 0.9# 0.9#
Waist (cm) Q1 80.0 ± 10.3 80.0 ± 9.8 80.0 ± 9.8 80.8 ± 9.8 80.7 ± 9.7
Q2 80.5 ± 9.2 80.9 ± 10.4 80.7 ± 9.8 80.3 ± 10.1 80.6 ± 9.5
Q3 81.1 ± 10.0 80.8 ± 9.4 80.9 ± 10.0 80.5 ± 9.7 80.3 ± 10.3
F 4.6* 4.1* 3.6* 1.0# 0.6#
Each factor is divided into Q1 (low percentile), Q2 (middle percentile), Q3 (high percentile) by score. N = 1656 in Q1, or Q2, or Q3. *P< 0.05,#P> 0.05 Table 3. Demography and body indices by dietary pattern
Chronic diseases Groups Protein Balanced Beans Prudent Traditional
Hypertension Q1 25.4 25.1 24.2 17.1 18.8
Q2 19.8 20.4 19.1 22.6 19.7
Q3 17.3 17.1 19.2 22.8 23.9
χ2 34.0* 32.2* 17.2* 21.1* 14.7*
Coronary heart disease Q1 4.1 4.5 4.2 3.3 3.1
Q2 4.2 3.3 3.6 3.5 4.1
Q3 3.5 4.0 4.1 5.1 4.6
χ2 1.3# 3.2# 1.0# 8.5* 4.8#
Stroke Q1 3.2 3.6 3.1 1.9 2.6
Q2 2.5 2.2 2.5 2.3 2.7
Q3 1.7 1.6 1.8 3.2 2.2
χ2 7.9* 14.6* 5.6# 5.9# 1.0#
Each factor is divided into Q1 (low percentile), Q2 (middle percentile), Q3 (high percentile) by score. N = 1656 in Q1, or Q2, or Q3. *P< 0.05,#P> 0.05 Table 4. Chronic diseases prevalence rate(%) by dietary pattern
pickled vegetables. Factor 5 showed high positive loadings of wheat, whole grains, fried pasta, pork, fresh vegetables, and pickled vegetables.
Demography and body indices by dietary pattern
Each factor was divided into Q1 (low percentile), Q2 (middle
percentile), or Q3 (high percentile) by score. A higher score indicates greater association with a particular dietary pattern.
Research has suggested that dietary patterns are related to
demographic characteristics, lifestyles, and movement of popula-
tions [8]. The demography and body indices of dietary patterns
across percentiles are shown in Table 3. Average ages of the
protein, balanced, and beans dietary patterns in Q3 were younger than in Q1. Average age of the prudent dietary pattern in Q3 was older than in Q1. Traditional dietary pattern and BMI of each pattern showed no significant difference. Waist circum- ferences of the protein, balanced, and beans dietary patterns in Q3 were longer than in Q1. Prudent and traditional dietary patterns showed no significant difference. Protein and beans patterns in Q3 had more females than males, whereas prudent and traditional patterns in Q3 had more males than females.
Balanced pattern showed no difference in gender.
Association between dietary patterns and prevalence rates of chronic diseases
Table 4 shows seven chronic diseases according to dietary pattern.
The prevalence rates of hypertension among the protein, balanced, and beans patterns were significantly lower in Q3 than in Q1, whereas prevalence rates of hypertension among prudent and traditional patterns were higher in Q3 than in Q1.
The prevalence rate of coronary heart disease among the prudent pattern was higher in Q3 than in Q1. The other four patterns showed no significant difference.
The prevalence rate of stroke among the protein and balanced patterns were lower in Q3 than in Q1. The other three patterns showed no significant difference.
DISCUSSION
At present, there has been little research into the association between dietary nutrition and chronic diseases among Baoji city residents living in Shaanxi Province, northwest China. In this study, we investigated the relationship between nutrient intakes, dietary patterns, and cardio-cerebrovascular disease to provide baseline data for nutritional intervention.
In this study, five dietary patterns were identified by factor analysis in a Chinese adult population: protein, balanced, beans, prudent, and traditional patterns. Factor loadings higher than 0.20 (absolute value) were analyzed. Factor 1 mainly included animal protein and plant protein. Factor 2 included carbohydrates, protein, and fat. Factor 3 included beans and bean products.
Factor 4 included staple foods and pickled vegetables. Factor 5 included Baoji local traditional recipes. Contribution rates were 16.1%, 7.9%, 7.0%, 5.2%, and 5.0%, respectively, reaching 41.1% of the accumulative variance contribution rate. This rate is high compared to other dietary studies that found a cumulative contribution rate of 30% or less [9,10]. In addition to factor analysis, other methods were used to identify dietary patterns (e.g., Reduced rank regression, RRR) [11]. RRR provides linear functions of predictor variables that explain as much of the variation in response variables as possible, whereas factor analysis derives dietary patterns by maximizing the explained variation among all predictor variables [12].
Demography and body indices analysis by dietary pattern showed that ages of the protein, balanced, and beans dietary patterns were younger, whereas age of the prudent pattern was older. There were more females in the protein and beans patterns, whereas males were more prominent in the prudent and traditional patterns. This indicates that young people
preferred the protein, balanced, and beans dietary patterns, whereas old people preferred the prudent pattern. There are two types of obesity, general obesity based on BMI and abdominal obesity (also known as central obesity) based on waist circumference. In this study, BMI of each pattern was not significantly different, whereas waist circumference was longer in the protein, balanced, and beans patterns. This result suggests that dietary factors more easily lead to abdominal obesity than general obesity.
The protein, balanced, and beans patterns were associated with reduced prevalence of hypertension. The protein and balanced patterns were associated with reduced prevalence of stroke, whereas the prudent and traditional patterns were associated with increased prevalence of hypertension. The prudent pattern was associated with increased prevalence of coronary heart disease.
Prior studies have investigated correlations between dietary patterns and hypertension, cardiovascular disease, stroke, and cancer [13,14]. Previous studies investigating dietary patterns and their associations with chronic diseases have been reported from the USA [15-17], Canada [18], Germany [19], Portugal [20], Iran [21], and other Asian countries [22-24]. These studies have found that dietary patterns characterized by high intakes of vegetables, fruits, and fish are inversely associated with diseases, whereas dietary patterns characterized by high intakes of red meat, processed meat, refined grains, and fried foods are associated with increased risk.
Our results are comparable to those of previous studies. The
balanced dietary pattern in the present study is resembles the
healthy dietary pattern identified in Western countries, which
is characterized by comprehensive intakes of protein, carbo-
hydrates, and fat. A systematic review study indicated that fruit
and vegetable concentrates are effective in significantly improv-
ing circulating concentrations of antioxidant vitamins, provita-
mins, and folate as well as decreasing markers of oxidative stress
[25], which has been associated with reduced risk of chronic
diseases [26]. High intakes of fruits, vegetables, cereals, fishes,
nuts, low-fat dairy products, and poultry in addition to relatively
low intakes of fat and sugars appear to be effective in lowering
blood pressures and hypertension [27]. Dietary patterns chara-
cterized by frequent intakes of fruits and dairy products have
been shown to significantly decrease blood pressure among
Chinese [28]. The Dietary Approaches to Stop Hypertension
(DASH) dietary pattern, which is rich in fruits, vegetables, and
low-fat dairy products and low in saturated fat, red meat, and
sweets, is successful in controlling hypertension [29]. On the
other hand, increased consumption of a Western dietary pattern
is typically associated with higher prevalence of chronic diseases
such as coronary heart diseases [30]. Western dietary patterns
with high intakes of red and processed meats, butter, oils, fats,
sweets and desserts, refined grains, and high-fat dairy are
associated with significantly increased risk of cardiovascular
disease [31]. Hu reported that Western dietary pattern score
is positively associated with fat intake percentage as well as
prevalence of coronary heart disease [32]. A cohort study in
Japan also demonstrated that dietary patterns with high meat
intakes are closely related to increased risk of cardiovascular
diseases [33]. In this study, although we did not identify Western
dietary patterns, the prudent pattern rich in whole grains, potatoes, fried pasta, and pickled vegetables was positively associated with prevalence of coronary heart disease. The Baoji traditional dietary pattern rich in whole grains, fried pasta, and vegetables did not show any protective effect against chronic diseases, which corroborates a Korean study [34].
This study has several limitations. Firstly, confounding factors could not be avoided, although we used multistage stratified random sampling. Secondly, there was some potential recall and reporting biases in the semi-quantitative food frequency questionnaire. Future prospective cohort and clinical trials are warranted to verify our findings.
In conclusion, five major dietary patterns were identified by factor analysis and were associated with prevalence of chronic diseases among Chinese adults. The protein dietary pattern was negatively associated with hypertension and stroke, the balanced pattern was negatively associated with hypertension and stroke, the beans pattern was negatively associated with hypertension, the prudent pattern was positively associated with hypertension and coronary heart disease, and the traditional pattern was positively associated with hypertension. In the future, these results should be confirmed by prospective cohort and clinical trials. On the whole, we should encourage Baoji city residents to choose protein, balanced, and beans dietary patterns and abandon prudent and traditional patterns to prevent incidence of hypertension, coronary heart disease, stroke, and other chronic diseases.
ACKNOWLEDGMENTS
We thank the study participants for their contribution to the research. We also thank the guidance of Xi'an Jiao Tong University in research design, and the the strong support and help of Health Bureau and CDC of Baoji City and 12 counties to process in the field survey.
REFERENCES
1. Gaziano TA, Bitton A, Anand S, Abrahams-Gessel S, Murphy A.
Growing epidemic of coronary heart disease in low- and middle- income countries. Curr Probl Cardiol 2010;35:72-115.
2. Whitworth JA; World Health Organization, International Society of Hypertension Writing Group. 2003 World Health Organization (WHO)/International Society of Hypertension (ISH) statement on management of hypertension. J Hypertens 2003;21:1983-92.
3. Chockalingam A, Campbell NR, Fodor JG. Worldwide epidemic of hypertension. Can J Cardiol 2006;22:553-5.
4. Newby PK, Tucker KL. Empirically derived eating patterns using factor or cluster analysis: a review. Nutr Rev 2004;62:177-203.
5. Kant AK. Dietary patterns and health outcomes. J Am Diet Assoc 2004;104:615-35.
6. Wang D, He Y, Li Y, Luan D, Yang X, Zhai F, Ma G. Dietary patterns and hypertension among Chinese adults: a nationally representative cross-sectional study. BMC Public Health 2011;11:925.
7. Rezazadeh A, Rashidkhani B, Omidvar N. Association of major dietary patterns with socioeconomic and lifestyle factors of adult women living in Tehran, Iran. Nutrition 2010;26:337-41.
8. Zhang L, Shi ZF, Chi AL, Zhao ZT. Effects of 11 years' community
intervention on hypertension, diabetes and KAP of the diseases among urban residents. Chin J Public Health 2013;29:608-11.
9. Luo Y, Chen X, Zuo G, Yuan N. Association between hypertension and dietary patterns in residents of Jiangyin city. Chin J Public Health 2009;25:314-6.
10. Shang X, Li Y, Liu A, Zhang Q, Hu X, Du S, Ma J, Xu G, Li Y, Guo H, Du L, Ma G. Dietary pattern and its association with the prevalence of obesity and related cardiometabolic risk factors among Chinese children. PLoS One 2012;7:e43183.
11. Song SJ, Lee JE, Paik HY, Park MS, Song YJ. Dietary patterns based on carbohydrate nutrition are associated with the risk for diabetes and dyslipidemia. Nutr Res Pract 2012;6:349-56.
12. Hoffmann K, Schulze MB, Schienkiewitz A, Nöthlings U, Boeing H.
Application of a new statistical method to derive dietary patterns in nutritional epidemiology. Am J Epidemiol 2004;159:935-44.
13. Foroughi M, Akhavanzanjani M, Maghsoudi Z, Ghiasvand R, Khorvash F, Askari G. Stroke and nutrition: a review of studies. Int J Prev Med 2013;4:S165-79.
14. Heidemann C, Schulze MB, Franco OH, van Dam RM, Mantzoros CS, Hu FB. Dietary patterns and risk of mortality from cardiovascular disease, cancer, and all causes in a prospective cohort of women.
Circulation 2008;118:230-7.
15. Lutsey PL, Steffen LM, Stevens J. Dietary intake and the develop- ment of the metabolic syndrome: the Atherosclerosis Risk in Communities study. Circulation 2008;117:754-61.
16. Deshmukh-Taskar PR, O'Neil CE, Nicklas TA, Yang SJ, Liu Y, Gustat J, Berenson GS. Dietary patterns associated with metabolic syndrome, sociodemographic and lifestyle factors in young adults:
the Bogalusa Heart Study. Public Health Nutr 2009;12:2493-503.
17. Fialkowski MK, McCrory MA, Roberts SM, Tracy JK, Grattan LM, Boushey CJ. Dietary patterns are associated with dietary recommen- dations but have limited relationship to BMI in the Communities Advancing the Studies of Tribal Nations Across the Lifespan (CoASTAL) cohort. Public Health Nutr 2012;15:1948-58.
18. Langsetmo L, Poliquin S, Hanley DA, Prior JC, Barr S, Anastassiades T, Towheed T, Goltzman D, Kreiger N; CaMos Research Group.
Dietary patterns in Canadian men and women ages 25 and older:
relationship to demographics, body mass index, and bone mineral density. BMC Musculoskelet Disord 2010;11:20.
19. Heidemann C, Scheidt-Nave C, Richter A, Mensink GB. Dietary patterns are associated with cardiometabolic risk factors in a repre- sentative study population of German adults. Br J Nutr 2011;106:
1253-62.
20. Fonseca MJ, Gaio R, Lopes C, Santos AC. Association between dietary patterns and metabolic syndrome in a sample of Portuguese adults. Nutr J 2012;11:64.
21. Khosravi-Boroujeni H, Sarrafzadegan N, Mohammadifard N, Sajjadi F, Maghroun M, Asgari S, Rafieian-Kopaei M, Azadbakht L. White rice consumption and CVD risk factors among Iranian population.
J Health Popul Nutr 2013;31:252-61.
22. Shin JY, Kim JM, Kim Y. Associations between dietary patterns and hypertension among Korean adults: the Korean National Health and Nutrition Examination Survey (2008-2010). Nutr Res Pract 2013;7:
224-32.
23. Akter S, Nanri A, Pham NM, Kurotani K, Mizoue T. Dietary patterns and metabolic syndrome in a Japanese working population. Nutr Metab (Lond) 2013;10:30.
24. Daniel CR, Prabhakaran D, Kapur K, Graubard BI, Devasenapathy
N, Ramakrishnan L, George PS, Shetty H, Ferrucci LM, Yurgalevitch S, Chatterjee N, Reddy KS, Rastogi T, Gupta PC, Mathew A, Sinha R. A cross-sectional investigation of regional patterns of diet and cardio-metabolic risk in India. Nutr J 2011;10:12.
25. Esfahani A, Wong JM, Truan J, Villa CR, Mirrahimi A, Srichaikul K, Kendall CW. Health effects of mixed fruit and vegetable concen- trates: a systematic review of the clinical interventions. J Am Coll Nutr 2011;30:285-94.
26. Hung HC, Joshipura KJ, Jiang R, Hu FB, Hunter D, Smith-Warner SA, Colditz GA, Rosner B, Spiegelman D, Willett WC. Fruit and vegetable intake and risk of major chronic disease. J Natl Cancer Inst 2004;96:1577-84.
27. Appel LJ, Moore TJ, Obarzanek E, Vollmer WM, Svetkey LP, Sacks FM, Bray GA, Vogt TM, Cutler JA, Windhauser MM, Lin PH, Karanja N. A clinical trial of the effects of dietary patterns on blood pressure.
DASH Collaborative Research Group. N Engl J Med 1997;336:
1117-24.
28. Lee SA, Cai H, Yang G, Xu WH, Zheng W, Li H, Gao YT, Xiang YB, Shu XO. Dietary patterns and blood pressure among middle-aged
and elderly Chinese men in Shanghai. Br J Nutr 2010;104:265-75.
29. Bhupathiraju SN, Tucker KL. Coronary heart disease prevention:
nutrients, foods, and dietary patterns. Clin Chim Acta 2011;412:
1493-514.
30. Hu FB, Rimm EB, Stampfer MJ, Ascherio A, Spiegelman D, Willett WC. Prospective study of major dietary patterns and risk of coronary heart disease in men. Am J Clin Nutr 2000;72:912-21.
31. Berg CM, Lappas G, Strandhagen E, Wolk A, Torén K, Rosengren A, Aires N, Thelle DS, Lissner L. Food patterns and cardiovascular disease risk factors: the Swedish INTERGENE research program. Am J Clin Nutr 2008;88:289-97.
32. Hu FB. Dietary pattern analysis: a new direction in nutritional epidemiology. Curr Opin Lipidol 2002;13:3-9.
33. Shimazu T, Kuriyama S, Hozawa A, Ohmori K, Sato Y, Nakaya N, Nishino Y, Tsubono Y, Tsuji I. Dietary patterns and cardiovascular disease mortality in Japan: a prospective cohort study. Int J Epidemiol 2007;36:600-9.
34. Kim YO. Dietary patterns associated with hypertension among Korean males. Nutr Res Pract 2009;3:162-6.