ABSTRACT
BACKGROUND/OBJECTIVES: Regional disparities in dietary factors might be related to regional disparities in cardiometabolic health. Therefore, this study investigated the associations of cardiometabolic risk factors and dietary factors with regional types in Korean adults.
SUBJECTS/METHODS: Based on data from the 2007–2017 Korea National Health and Nutrition Examination Survey, the study included 39,781 adults aged ≥ 19 years who completed the dietary survey and a health examination. Healthy and unhealthy dietary factors (fat, sodium, fruit, and vegetable intakes) were evaluated using 1-day 24-h dietary recall method, as well as the use of nutrition labels with a questionnaire.
RESULTS: Of the participants, 48.7%, 36.0%, and 15.2% lived in metropolitan, urban, and rural areas, respectively. Adults living in urban and rural had higher odds ratios (ORs) for obesity (OR for urban, 1.07; 95% confidence interval (CI), 1.01–1.14; OR for rural, 1.14; 95%
CI, 1.05–1.24) than adults living in metropolitan areas; these associations were significantly observed in middle-aged adults. Compared to metropolitan residents, rural residents had lower ORs for hypertension in middle-aged (OR, 0.86; 95% CI, 0.76–0.96) and metabolic syndrome in older adults (OR, 0.78; 95% CI, 0.67–0.91). Regarding urban residents, a lower OR for diabetes in middle-aged adults (OR, 0.85; 95% CI, 0.74–0.97) and a higher OR for hypertension in older adults (OR, 1.19; 95% CI, 1.02–1.39) were observed. Overall rural residents had higher ORs of excessive carbohydrate, low fruit, and high salted-vegetable intakes than metropolitan residents. Low fruit intake was positively associated with obesity, metabolic syndrome, and hypertension, after adjustment for regional type and other confounders in total participants.
CONCLUSIONS: These findings indicate that cardiometabolic risk and unhealthy dietary factors differ among regional types and age groups within Korea. Nutritional policy and interventions should consider regional types for prevention and management of cardiometabolic risk factors.
Keywords: Health status disparity; carbohydrate; fruit; vegetables; obesity
Original Research
Received: Jan 8, 2020 Revised: May 21, 2020 Accepted: Jul 17, 2020
§
Corresponding Author:
Hye-Kyeong Kim
Department of Food Science and Nutrition, The Catholic University of Korea, 43 Jibong-ro, Wonmi-gu, Bucheon 14662, Korea.
Tel. +82-2-2164-4314 E-mail. [email protected]
©2020 The Korean Nutrition Society and the Korean Society of Community Nutrition This is an Open Access article distributed under the terms of the Creative Commons Attribution Non-Commercial License (https://
creativecommons.org/licenses/by-nc/4.0/) which permits unrestricted non-commercial use, distribution, and reproduction in any medium, provided the original work is properly cited.
ORCID iDs Kyungho Ha
https://orcid.org/0000-0002-0397-2070 YoonJu Song
https://orcid.org/0000-0002-4764-5864 Hye-Kyeong Kim
https://orcid.org/0000-0003-1659-1709 Funding
This study was supported by Korean Centers for Disease Control and Prevention (research promotion project for investigation of causes and solutions of regional health disparities) and the Catholic University of Korea, Research Fund, 2019.
Kyungho Ha 1 , YoonJu Song 2 , and Hye-Kyeong Kim 2§
1
Department of Food Science and Nutrition, Jeju National University, Jeju 63243, Korea
2
Department of Food Science and Nutrition, The Catholic University of Korea, Bucheon 14662, Korea
Regional disparities in the
associations of cardiometabolic risk
factors and healthy dietary factors in
Korean adults
Conflict of Interest
The authors declare no potential conflicts of interests.
Author Contributions
Conceptualization: Ha K, Song Y, Kim HK;
Formal analysis: Ha K, Song Y; Funding acquisition: Kim HK; Investigation: Ha K;
Methodology: Ha K, Song Y; Supervision:
Kim HK, Song Y; Validation: Kim HK, Song Y;
Writing - original draft: Ha K; Writing - review &
editing: Song Y, Kim HK.
INTRODUCTION
According to the World Health Organization (WHO), health equity constitutes the absence of preventable, unfair, or soluble differences in aspects of health among groups based on social, economic, demographic, or geographic factors [1]. Although health inequity can be caused by differences in a variety of factors including gender, ethnicity, income, education, and occupation [2], regional or geographical differences are well-known factors that influence health disparities [3,4].
In 2011, the Korean government established the National Health Plan 2020 (NHP 2020), which set 2 major goals: increasing healthy life expectancy and achieving health equity [5]. However, the Korean Society for Equity in Health recently reported that healthy life expectancy varied among regional types in Korean [6]. In addition, the prevalence of cardiometabolic risk factors, such as obesity, metabolic syndrome, and diabetes, differed between urban and rural areas [7-10].
Urbanization has also affected health-related lifestyle factors in Korea, in that urban residents tended to have a westernized lifestyle rather than the traditional Korean lifestyle [11-14]. Previous studies for Koreans reported that age-specific health behaviors, such as exercise, daily activity, and weight reduction, differed among residential areas [13]; moreover, older people in rural areas showed unbalanced food and nutrient intakes, compared to older people in urban areas [14].
Regional disparities in cardiometabolic health can be attributed to different diet and lifestyle factors. A healthy diet, defined by the consumption of appropriate levels of fat, sodium, fruits, and vegetables, as well as the use of nutrition labels, is a major index of the NHP 2020; in addition, the Korean government has continuously monitored regional disparities in healthy diets [5]. Regional disparities in cardiometabolic health risks and healthy diets deserve investigation as the basic information for establishing public health policy in Korea.
Therefore, this study investigated the associations of cardiometabolic risk factors and dietary factors with regional types (metropolitan, urban, and rural), and examined associations between cardiometabolic risk factors and unhealthy dietary factors by regional type in Korea using a large-scale national survey.
SUBJECTS AND METHODS
Study design and participants
This study used data from the 2007–2017 Korea National Health and Nutrition Examination Survey (KNHANES). KNHANES is an ongoing nationwide cross-sectional survey conducted by the Korea Centers for Disease Control and Prevention (KCDC) that examines a
nationally representative sample of Koreans. The survey includes a health interview, health
examination, and dietary survey; detailed information regarding the survey procedures has
been previously described [15]. KNHANES was approved by the KCDC Institutional Review
Board (IRB) until 2014, and has been conducted without deliberation according to the
bioethics law since 2015 (IRB NO.: 2007-02CON-04-P, 2008-04EXP-01-C, 2008-04EXP-01-C,
2010-02CON-21-C, 2010-02CON-21-C, 2012-01EXP-01-2C, 2013-07CON-03-4C, 2013-12EXP-
03-5C). Written informed consent was obtained from all participants.
Among the 60,801 adults aged 19 years or older who participated in a 24-h dietary recall survey, those who were missing biochemical or anthropometric measurements (n = 9,873), lacked information regarding the use of nutrition labels (n = 9,864), were pregnant or lactating (n = 646), and reported implausible energy intake (< 500 or > 5,000 kcal/day) (n = 637) were excluded. In total, 39,781 participants were included in the final analysis.
Classification of regional types
Regional types were categorized into metropolitan, urban, and rural areas. In accordance with the administrative divisions of Korea, Seoul (the capital city) and 6 metropolitan cities were classified as metropolitan areas, while “dong” areas were classified as urban areas, and “eup”
or “myeon” areas were classified as rural areas, including those located in metropolitan cities.
Assessment of healthy and unhealthy diets
Adherence to a healthy diet was defined as fulfillment of 2 or more of the following criteria, in accordance with the NHP 2020: 1) appropriate fat intake (15%–30% of energy), 2) sodium intake ≤ 2,000 mg/day, 3) fruit and vegetable intake ≥ 500 g/day, and 4) use of nutrition labels in food selection [5]. Recently, sugar intake (free sugar from processed foods < 10% of energy) has been added to a healthy diet of the NHP 2020 [16], however it was not included in this study because data of sugar intake was only available in 2016–2017 KNHANES. Daily nutrient and food group intakes were estimated using 1-day 24-h dietary recall method.
Information regarding the use of nutrition labels in food selection was obtained from the dietary behavior questionnaire. This study examined associations between regional types and unhealthy dietary factors, which were regarded as opposites of healthy dietary factors.
Because fat intake has a reciprocal relationship with carbohydrate intake, which is the major energy source for Koreans, excessive carbohydrate intake (> 65% of energy) was also evaluated [17]. Fruit and vegetable intakes were estimated separately; vegetable was divided into salted (kimchi and pickled vegetables) and unsalted (all vegetables except kimchi and pickled vegetables) vegetable intakes. The median fruit and vegetable intakes of the participants were used as reference values for fruit and vegetable intakes, respectively.
Definitions of cardiometabolic risk factors
In this study, cardiometabolic risk factors included obesity, metabolic syndrome, hypertension, and diabetes. Study participants were regarded as obese if their body mass index (BMI) ≥ 25 kg/m
2, according to the WHO Asia-Pacific guidelines [18]. Based on the guidelines of the American Heart Association/National Heart, Lung, and Blood Institute Scientific Statement [19], excluding waist circumference [20], metabolic syndrome was defined as fulfillment of 3 or more of the following components: 1) abdominal obesity (≥ 90 cm for men and ≥ 85 cm for women), 2) elevated blood pressure (systolic blood pressure ≥ 130 mmHg, diastolic blood pressure ≥ 85 mmHg, or taking antihypertensive medications), 3) reduced high-density lipoprotein-cholesterol (< 40 mg/dL for men and < 50 mg/dL for women), 4) elevated triglycerides (≥ 150 mg/dL), and 5) elevated fasting blood glucose (≥ 100 mg/dL or the use of oral antidiabetic medications or insulin). Hypertension was diagnosed as a systolic blood pressure ≥ 140 mmHg or diastolic blood pressure ≥ 90 mmHg, or the use of antihypertensive medications; diabetes was diagnosed as fasting blood glucose ≥ 126 mg/dL, the use of oral antidiabetic medications or insulin, or a physician's diagnosis [21].
Other variables
Sociodemographic characteristics were obtained from the health interview; these included
education, household income, marital status, and lifestyle factors such as physical activity,
current smoking status, and alcohol consumption. Education level was categorized into elementary school or less, middle school, high school, and college or more. Household income level was divided into the lowest, lower-middle, upper-middle, and highest quartiles of monthly household income. Marital status was classified as married and unmarried. Physical activity was defined as “yes” if the study participants performed vigorous activity for at least 75 minutes per week, moderate activity for at least 150 minutes, or an equivalent combination of moderate and vigorous activities. Current smokers were defined as those who smoked ≥ 100 cigarettes over a lifetime and continued to smoke; alcohol consumers were regarded as those who drank alcoholic beverages more than once per month during the past year.
Statistical analysis
All statistical analyses were conducted using SAS ver. 9.4 (SAS Institute, Cary, NC, USA).
The complex sampling design parameters of KNHANES, including strata, cluster, and weight, were applied to the PROC SURVEY procedure. Differences in study participants' general characteristics and their adherence to a healthy diet according to regional types were examined using the χ
2test. Odds ratios (ORs) and 95% confidence intervals (CIs) for cardiometabolic risk factors and unhealthy dietary factors according to regional types were calculated using a multiple logistic regression after adjustments for age, sex, BMI, education, household income, marital status, survey period, alcohol consumption, current smoking status, physical activity, and total energy intake. Considering the different age distribution by regional type, age-stratified analysis was conducted. In addition, associations between unhealthy dietary factors and cardiometabolic risk factors were examined for total participants and different regional types using a multiple logistic regression. For this analysis, the participants who had prior diagnoses and were receiving medications for hypertension, diabetes, or dyslipidemia were additionally excluded (n = 10,189), because they may have altered their dietary habits. All P-values were two-sided and P-values < 0.05 were considered statistically significant.
RESULTS
General characteristics of participants
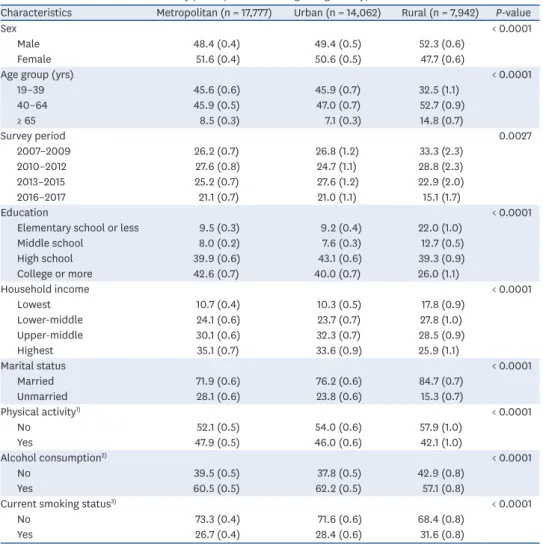
Among the study participants, 48.7%, 36.0%, and 15.2% lived in metropolitan, urban, and rural areas, respectively. Table 1 shows the sociodemographic characteristics and lifestyles of the study participants according to regional types. The distributions of sex, age group, education, household income, and marital status differed significantly among regional types (all P < 0.0001). The proportion of participants aged 65 years or older was highest in rural areas (14.8%) and lowest in urban areas (7.1%). Participants living in rural areas tended to have lower education and household income levels. The participants’ lifestyles, including physical activity, alcohol consumption, and current smoking status, also differed among regional types (all P < 0.0001). The proportions of participants who did not perform physical activity (57.9%) and were current smokers (31.6%) were highest in rural areas, while the proportion of alcohol consumers was lowest in rural areas (57.1%).
Distribution of cardiometabolic risk factors and adherence to a healthy diet
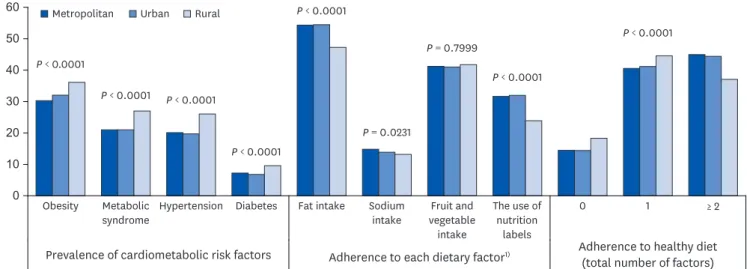
The prevalence of obesity, metabolic syndrome, hypertension, and diabetes in total
participants were 31.8%, 21.9%, 20.9%, and 7.4%, respectively. Rural residents had
significantly higher prevalence of these risk factors than metropolitan and urban residents
(all P < 0.0001) (Fig. 1).
Adherence to a healthy diet was highest in metropolitan areas (45.0%) and lowest in rural areas (37.1%); the distribution of adherence to a healthy diet differed significantly among regional types (P < 0.0001) (Fig. 1). Regarding individual dietary factors, the proportions of adults having appropriate amounts of fat and using nutrition labels in food selection were lowest in rural areas, compared to metropolitan and urban areas (all P < 0.0001).
Rural areas also had the lowest proportion of adults with sodium intake ≤ 2,000 mg/day (13.2%), although this proportion was similar to the proportions of adults in urban (13.9%) and metropolitan (14.8%) areas (P = 0.0231). No significant differences were found in the adherences to fruit and vegetable intakes.
Cardiometabolic risk factors and regional types
Table 2 presents the multivariable-adjusted ORs for cardiometabolic risk factors among regional types. After adjustment for confounding variables, adults living in urban and rural areas had higher ORs for obesity (OR for urban, 1.07; 95% CI, 1.01–1.14; OR for rural, 1.14;
95% CI, 1.05–1.24) than adults living in metropolitan areas in total participants. When the Table 1. General characteristics of study participants according to regional types in Korea
Characteristics Metropolitan (n = 17,777) Urban (n = 14,062) Rural (n = 7,942) P-value
Sex < 0.0001
Male 48.4 (0.4) 49.4 (0.5) 52.3 (0.6)
Female 51.6 (0.4) 50.6 (0.5) 47.7 (0.6)
Age group (yrs) < 0.0001
19–39 45.6 (0.6) 45.9 (0.7) 32.5 (1.1)
40–64 45.9 (0.5) 47.0 (0.7) 52.7 (0.9)
≥ 65 8.5 (0.3) 7.1 (0.3) 14.8 (0.7)
Survey period 0.0027
2007–2009 26.2 (0.7) 26.8 (1.2) 33.3 (2.3)
2010–2012 27.6 (0.8) 24.7 (1.1) 28.8 (2.3)
2013–2015 25.2 (0.7) 27.6 (1.2) 22.9 (2.0)
2016–2017 21.1 (0.7) 21.0 (1.1) 15.1 (1.7)
Education < 0.0001
Elementary school or less 9.5 (0.3) 9.2 (0.4) 22.0 (1.0)
Middle school 8.0 (0.2) 7.6 (0.3) 12.7 (0.5)
High school 39.9 (0.6) 43.1 (0.6) 39.3 (0.9)
College or more 42.6 (0.7) 40.0 (0.7) 26.0 (1.1)
Household income < 0.0001
Lowest 10.7 (0.4) 10.3 (0.5) 17.8 (0.9)
Lower-middle 24.1 (0.6) 23.7 (0.7) 27.8 (1.0)
Upper-middle 30.1 (0.6) 32.3 (0.7) 28.5 (0.9)
Highest 35.1 (0.7) 33.6 (0.9) 25.9 (1.1)
Marital status < 0.0001
Married 71.9 (0.6) 76.2 (0.6) 84.7 (0.7)
Unmarried 28.1 (0.6) 23.8 (0.6) 15.3 (0.7)
Physical activity
1)< 0.0001
No 52.1 (0.5) 54.0 (0.6) 57.9 (1.0)
Yes 47.9 (0.5) 46.0 (0.6) 42.1 (1.0)
Alcohol consumption
2)< 0.0001
No 39.5 (0.5) 37.8 (0.5) 42.9 (0.8)
Yes 60.5 (0.5) 62.2 (0.5) 57.1 (0.8)
Current smoking status
3)< 0.0001
No 73.3 (0.4) 71.6 (0.6) 68.4 (0.8)
Yes 26.7 (0.4) 28.4 (0.6) 31.6 (0.8)
All values are presented as percentage (SE). The complex sampling design parameters of Korea National Health and Nutrition Examination Survey, including strata, cluster, and weight, were used in the PROC SURVEY procedure.
1)
Physical activity: “yes” performed vigorous activity for at least 75 minutes, moderate activity for at least 150 minutes, or an equivalent combination of moderate and vigorous activities per week.
2)
Alcohol consumption: “yes” consumed alcoholic beverages more than once per month during the past year.
3)
Current smoking status: “yes” smoked ≥ 100 cigarettes over a lifetime and a current smoker.
data were stratified by age group, these higher ORs for obesity in urban and rural areas were observed in middle-aged adults (40–64 years) only. On the other hand, in middle-aged adults, urban residents had a lower OR for diabetes (OR, 0.85; 95% CI, 0.74–0.97) and rural residents had a lower OR for hypertension (OR, 0.86; 95% CI, 0.76–0.96), compared to metropolitan residents. In older adults aged ≥ 65 years, urban residents had a higher OR for hypertension (OR, 1.19; 95% CI, 1.02–1.39), but rural resident had a lower OR for metabolic syndrome (OR, 0.78; 95% CI, 0.67–0.91), compared to metropolitan residents. There was no significant association between cardiometabolic risk factors and regional types in younger adults aged 19–39 years.
Table 2. Multivariable-adjusted odds ratios for cardiometabolic risk factors according to regional types in Korea
Cardiometabolic risk factors Metropolitan Urban Rural
Total (n = 39,781)
Obesity 1.00
1),2)1.07 (1.01–1.14) 1.14 (1.05–1.24)
Metabolic syndrome 1.00 1.00 (0.93–1.08) 1.01 (0.92–1.11)
Hypertension 1.00 1.01 (0.93–1.10) 0.91 (0.83–1.01)
Diabetes 1.00 0.94 (0.84–1.04) 0.97 (0.85–1.10)
Age 19–39 yrs (n = 13,428)
Obesity 1.00 1.06 (0.96–1.17) 1.17 (1.00–1.37)
Metabolic syndrome 1.00 1.03 (0.89–1.19) 1.11 (0.89–1.39)
Hypertension 1.00 1.03 (0.85–1.25) 1.01 (0.78–1.31)
Diabetes 1.00 0.97 (0.70–1.36) 0.74 (0.44–1.24)
Age 40–64 yrs (n = 19,592)
Obesity 1.00 1.09 (1.00–1.18) 1.21 (1.10–1.35)
Metabolic syndrome 1.00 0.97 (0.88–1.06) 1.04 (0.93–1.16)
Hypertension 1.00 0.91 (0.83–1.00) 0.86 (0.76–0.96)
Diabetes 1.00 0.85 (0.74–0.97) 1.00 (0.86–1.17)
Age ≥ 65 yrs (n = 6,761)
Obesity 1.00 1.12 (0.96–1.30) 0.94 (0.80–1.10)
Metabolic syndrome 1.00 0.95 (0.81–1.10) 0.78 (0.67–0.91)
Hypertension 1.00 1.19 (1.02–1.39) 1.00 (0.85–1.16)
Diabetes 1.00 1.07 (0.89–1.28) 0.84 (0.69–1.02)
1)
The complex sampling design parameters of Korea National Health and Nutrition Examination Survey, including strata, cluster, and weight, were used in the PROC SURVEY procedure.
2)
Adjusted for age, sex, body mass index (except for obesity and metabolic syndrome), education, household income, marital status, survey period, alcohol consumption, current smoking status, physical activity, and total energy intake.
0 10 20 30 40 50 60
Obesity Metabolic
syndrome Hypertension Diabetes Fat intake Sodium
intake Fruit and vegetable intake
The use of nutrition
labels
0 1 ≥ 2
Prevalence of cardiometabolic risk factors Adherence to each dietary factor
1)Adherence to healthy diet (total number of factors) Metropolitan Urban Rural
%
P < 0.0001
P < 0.0001
P < 0.0001
P < 0.0001 P < 0.0001
P < 0.0001
P < 0.0001
P = 0.0231
P = 0.7999
Fig. 1. Distribution of prevalence of cardiometabolic risk factors and adherence to a healthy diet among regional types in Korea.
1)
Adherence to a healthy diet was defined as the fulfillment of 2 or more of the following criteria: 1) appropriate fat intake (15%–30% of energy), 2) sodium intake
≤ 2,000 mg/day, 3) fruit and vegetable intake ≥ 500 g/day, and 4) the use of nutrition labels in food selection.
Unhealthy dietary factors and regional types
Table 3 presents the associations between unhealthy dietary factors and regional types.
Compared to metropolitan residents, rural residents had higher ORs for inadequate fat intake (OR, 1.28; 95% CI, 1.17–1.39) and excessive carbohydrate intake (OR, 1.17; 95%
CI, 1.07–1.28) in total participants. Total fruit and vegetable intake was not significantly associated with regional type, but significant associations were observed when fruit and vegetable intakes were separated. Participants living in rural areas had a higher OR for low fruit intake (OR, 1.14; 95% CI, 1.04–1.25) than participants living in metropolitan areas.
The ORs for low vegetable intake were lower among urban (OR, 0.93; 95% CI, 0.87–0.99) and rural (OR, 0.90; 95% CI, 0.83–0.98) residents, while the ORs for high salted vegetable intake were higher among urban (OR, 1.08; 95% CI, 1.01–1.16) and rural (OR, 1.18; 95% CI, 1.07–1.29) residents, compared to metropolitan residents. The age-stratified analysis showed similar tendency of associations, although statistical significance was different among age groups. However, unlike other age groups, older adults living in rural areas had a higher OR for low unsalted vegetable intake (OR, 1.20; 95% CI, 1.02–1.40) than older adults in metropolitan areas. There were no significant associations between absence of nutrition label use and regional type.
Association between cardiometabolic risk factors and unhealthy dietary factors
After adjustment for regional type and other confounders, low fruit intake was positively associated with obesity, metabolic syndrome, and hypertension in total participants; these significant associations were observed in all regional types except metabolic syndrome for metropolitan residents and obesity and hypertension for urban residents (Table 4). Excessive carbohydrate intake, low vegetable intake, and not-using nutrition labels were negatively
Table 3. Multivariable-adjusted odds ratios for unhealthy dietary factors according to regional types in Korea Unhealthy dietary
factors Total Age 19–39 yrs Age 40–64 yrs Age ≥ 65 yrs
Metropolitan (n = 17,777) Urban
(n = 14,062) Rural
(n = 7,942) Metropolitan (n = 6,451) Urban
(n = 5,265) Rural
(n = 1,712) Metropolitan (n = 8,739) Urban
(n = 6,921) Rural
(n = 3,932) Metropolitan (n = 2,587) Urban
(n = 1,876) Rural (n = 2,298) Excessive fat intake
(> 30% of energy)
1)1.00
2),3)0.97
(0.89–1.06) 0.87
(0.76–0.998) 1.00 0.94
(0.84–1.06) 0.91
(0.75–1.11) 1.00 1.08
(0.94–1.24) 0.84
(0.69–1.02) 1.00 0.75
(0.51–1.11) 0.97 (0.58–1.62) Inadequate fat intake
(< 15% of energy)
1)1.00 1.05
(0.98–1.12) 1.28
(1.17–1.39) 1.00 1.06
(0.95–1.19) 1.22
(1.03–1.44) 1.00 0.99
(0.90–1.09) 1.24
(1.11–1.39) 1.00 1.13
(0.95–1.34) 1.34 (1.10–1.63) Excessive carbohydrate
intake (> 65% of energy) 1.00 1.06
(0.99–1.13) 1.17
(1.07–1.28) 1.00 1.09
(0.99–1.20) 1.15
(1.01–1.31) 1.00 0.99
(0.91–1.08) 1.11
(0.98–1.25) 1.00 1.14
(0.95–1.38) 1.38 (1.12–1.70) High sodium intake
(> 2,000 mg/day) 1.00 1.04
(0.95–1.14) 1.12
(1.00–1.26) 1.00 0.96
(0.83–1.11) 1.12
(0.90–1.39) 1.00 1.08
(0.95–1.22) 1.19
(1.00–1.41) 1.00 1.23
(1.01–1.49) 1.06 (0.87–1.29) Low fruit and vegetable
intake (< 500 g/day) 1.00 1.02
(0.95–1.09) 1.04
(0.95–1.14) 1.00 1.05
(0.95–1.16) 1.05
(0.90–1.22) 1.00 1.03
(0.94–1.13) 1.00
(0.89–1.12) 1.00 0.94
(0.80–1.11) 1.24 (1.05–1.46) Low fruit intake
(< median) 1.00 1.06
(0.99–1.14) 1.14
(1.04–1.25) 1.00 1.13
(1.03–1.25) 1.07
(0.92–1.24) 1.00 1.03
(0.94–1.13) 1.10
(0.98–1.23) 1.00 1.09
(0.93–1.29) 1.34 (1.12–1.60) Low vegetable intake
(< median) 1.00 0.93
(0.87–0.99) 0.90
(0.83–0.98) 1.00 0.93
(0.84–1.02) 0.96
(0.83–1.10) 1.00 0.99
(0.91–1.09) 0.84
(0.75–0.94) 1.00 0.97
(0.83–1.14) 1.06 (0.90–1.25) High salted
vegetable intake (≥ median)
1.00 1.08
(1.01–1.16) 1.18
(1.07–1.29) 1.00 1.05
(0.96–1.16) 1.17
(1.01–1.35) 1.00 1.06
(0.97–1.16) 1.15
(1.02–1.30) 1.00 1.05
(0.90–1.22) 1.10 (0.93–1.31) Low unsalted
vegetable intake (< median)
1.00 0.97
(0.91–1.03) 0.99
(0.91–1.08) 1.00 0.94
(0.85–1.03) 1.05
(0.91–1.20) 1.00 1.02
(0.93–1.12) 0.96
(0.86–1.07) 1.00 1.06
(0.90–1.24) 1.20 (1.02–1.40) Not-using nutrition
labels in food selection 1.00 0.97
(0.90–1.04) 1.08
(0.98–1.19) 1.00 0.97
(0.89–1.07) 1.07
(0.93–1.23) 1.00 0.94
(0.86–1.02) 1.02
(0.91–1.16) 1.00 0.93
(0.71–1.21) 1.25 (0.90–1.74)
1)
The reference group was 15%–30% of energy.
2)
The complex sampling design parameters of Korea National Health and Nutrition Examination Survey, including strata, cluster, and weight, were used in the PROC SURVEY procedure.
3)
Adjusted for age, sex, body mass index, education, household income, marital status, survey period, alcohol consumption, current smoking status, physical
activity, and total energy intake.
associated with obesity, but these associations were found only in metropolitan residents.
The participants with low unsalted vegetable intake had a higher OR for metabolic syndrome than those with high unsalted vegetable intake (OR, 1.11; 95% CI, 1.02–1.21). Diabetes was not significantly associated with unhealthy dietary factors.
DISCUSSION
In this large-scale, cross-sectional study, cardiometabolic risk factors differed among regional types and age groups in Korea. Compared to metropolitan areas, middle-aged adults (40–64 years) in urban and rural areas had higher ORs for obesity, whereas middle-aged Table 4. Multivariable-adjusted odds ratios for cardiometabolic risk factors according to unhealthy dietary factors by regional types in Korea
Cardiometabolic risk factors Total (n = 29,592) Metropolitan (n = 13,445) Urban (n = 10,724) Rural (n = 5,423) Obesity
Excessive fat intake (> 30% of energy)
1)1.10 (1.00–1.21)
2),3)1.08 (0.94–1.24) 1.12 (0.96–1.31) 1.15 (0.88–1.51) Excessive carbohydrate intake (> 65% of energy) 0.90 (0.84–0.96) 0.89 (0.80–0.98) 0.93 (0.83–1.05) 0.86 (0.74–1.01) High sodium intake (> 2,000 mg/day) 1.06 (0.96–1.17) 1.18 (1.02–1.37) 1.01 (0.85–1.20) 0.84 (0.65–1.08) Low fruit and vegetable intake (< 500 g/day) 1.01 (0.94–1.08) 1.00 (0.90–1.11) 1.04 (0.92–1.16) 0.97 (0.83–1.15)
Low fruit intake (< median) 1.14 (1.06–1.21) 1.16 (1.05–1.28) 1.09 (0.98–1.21) 1.22 (1.03–1.44) Low vegetable intake (< median) 0.91 (0.85–0.98) 0.86 (0.78–0.96) 1.00 (0.89–1.13) 0.93 (0.79–1.09)
High salted vegetable intake (≥ median) 1.06 (0.99–1.14) 1.14 (1.03–1.26) 0.99 (0.88–1.11) 0.92 (0.79–1.08) Low unsalted vegetable intake (< median) 0.98 (0.91–1.05) 0.94 (0.85–1.04) 1.05 (0.93–1.18) 0.91 (0.78–1.06) Not-using nutrition labels in food selection 0.91 (0.85–0.98) 0.90 (0.81–0.99) 0.92 (0.81–1.04) 0.92 (0.77–1.09) Metabolic syndrome
Excessive fat intake (> 30% of energy)
1)0.95 (0.83–1.09) 0.85 (0.70–1.03) 1.12 (0.89–1.41) 0.88 (0.61–1.26) Excessive carbohydrate intake (> 65% of energy) 1.02 (0.93–1.11) 1.04 (0.91–1.19) 1.06 (0.91–1.22) 0.89 (0.72–1.10) High sodium intake (> 2,000 mg/day) 0.98 (0.86–1.11) 0.90 (0.75–1.09) 1.10 (0.87–1.38) 0.95 (0.72–1.25) Low fruit and vegetable intake (< 500 g/day) 1.12 (1.02–1.23) 1.10 (0.96–1.26) 1.17 (1.01–1.35) 1.12 (0.91–1.37) Low fruit intake (< median) 1.20 (1.10–1.31) 1.13 (1.00–1.29) 1.22 (1.06–1.40) 1.24 (1.03–1.50) Low vegetable intake (< median) 0.98 (0.89–1.07) 1.01 (0.88–1.16) 0.95 (0.82–1.11) 1.00 (0.83–1.19) High salted vegetable intake (≥ median) 1.05 (0.97–1.14) 1.10 (0.98–1.24) 0.97 (0.85–1.12) 0.98 (0.81–1.19) Low unsalted vegetable intake (< median) 1.11 (1.02–1.21) 1.13 (0.99–1.28) 1.10 (0.96–1.26) 1.08 (0.90–1.31) Not-using nutrition labels in food selection 1.01 (0.91–1.12) 1.02 (0.88–1.18) 0.96 (0.81–1.13) 1.07 (0.84–1.37) Hypertension
Excessive fat intake (> 30% of energy)
1)0.91 (0.76–1.08) 0.81 (0.63–1.04) 1.00 (0.76–1.32) 1.05 (0.67–1.64) Excessive carbohydrate intake (> 65% of energy) 1.02 (0.91–1.14) 1.03 (0.87–1.22) 1.01 (0.84–1.21) 1.00 (0.77–1.29) High sodium intake (> 2,000 mg/day) 1.00 (0.84–1.18) 1.03 (0.79–1.33) 0.98 (0.74–1.29) 0.93 (0.68–1.27) Low fruit and vegetable intake (< 500 g/day) 1.12 (1.00–1.25) 1.10 (0.94–1.29) 1.14 (0.94–1.40) 1.13 (0.87–1.48) Low fruit intake (< median) 1.17 (1.05–1.30) 1.19 (1.02–1.39) 1.05 (0.87–1.28) 1.31 (1.05–1.64) Low vegetable intake (< median) 1.01 (0.90–1.13) 0.98 (0.84–1.16) 1.02 (0.85–1.24) 0.94 (0.72–1.23) High salted vegetable intake (≥ median) 1.06 (0.96–1.18) 1.06 (0.92–1.22) 1.01 (0.83–1.22) 0.90 (0.71–1.14) Low unsalted vegetable intake (< median) 1.05 (0.94–1.17) 1.04 (0.89–1.22) 1.07 (0.89–1.29) 1.01 (0.80–1.26) Not-using nutrition labels in food selection 1.03 (0.91–1.17) 1.10 (0.92–1.32) 0.91 (0.73–1.13) 1.10 (0.79–1.53) Diabetes
Excessive fat intake (> 30% of energy)
1)1.02 (0.72–1.43) 0.82 (0.48–1.40) 1.24 (0.74–2.08) 1.05 (0.43–2.58) Excessive carbohydrate intake (> 65% of energy) 1.03 (0.83–1.29) 1.01 (0.72–1.42) 0.87 (0.61–1.23) 1.57 (0.92–2.69) High sodium intake (> 2,000 mg/day) 0.93 (0.66–1.31) 0.97 (0.59–1.62) 0.82 (0.46–1.45) 1.11 (0.56–2.21) Low fruit and vegetable intake (< 500 g/day) 1.15 (0.91–1.45) 0.98 (0.69–1.39) 1.30 (0.90–1.87) 1.31 (0.76–2.24) Low fruit intake (< median) 1.05 (0.85–1.31) 0.94 (0.67–1.32) 1.00 (0.70–1.42) 1.45 (0.89–2.36) Low vegetable intake (< median) 0.99 (0.79–1.24) 0.84 (0.60–1.17) 1.28 (0.87–1.87) 0.93 (0.58–1.48)
High salted vegetable intake (≥ median) 1.04 (0.84–1.30) 1.10 (0.78–1.55) 1.04 (0.73–1.48) 0.91 (0.56–1.47) Low unsalted vegetable intake (< median) 1.16 (0.94–1.43) 1.06 (0.76–1.47) 1.37 (0.96–1.96) 1.05 (0.69–1.60) Not-using nutrition labels in food selection 0.97 (0.76–1.25) 0.96 (0.64–1.44) 1.03 (0.70–1.51) 0.80 (0.46–1.37)
1)
The reference group was 15%–30% of energy.
2)
The complex sampling design parameters of Korea National Health and Nutrition Examination Survey, including strata, cluster, and weight, were used in the PROC SURVEY procedure.
3)