초 록
토지정보화 방법론은 정보시스템 개발 방법론의 과정을 따르면서 토지정보의 구축 및 관리, 활용 에 특화된 토지정보화와 관련된 시스템의 개발에 적용할 수 있는 방법론이다. 따라서 정보시스템의 구축 방법론의 이해와 토지정보화에 대한 특수한 상황의 이해가 필요하다. 본 연구에서는 토지정보 화에 대한 이해를 높이기 위하여 기존의 토지정보시스템들에 대한 다양한 분석을 시도하였고, 기초 방법론으로는 EA기반의 참조모형 및 컴포넌트 기반의 방법론을 활용하고 있다. 더불어 토지정보화 과정 중에 발생할 수 있는 다양한 문제나 이슈사항, 단계별로 수행하여야 하는 문제 등을 제시하여 방법론 세부항목으로 구성함으로서 토지정보화 방법론의 특수성을 최대한 살릴 수 있도록 구축하였다.
주요어 : 지리정보시스템, 지적도, 토지정보, 개발방법론
Comparison between the Road-based and the
Parcel-based Address Coordinates for Urban Air Pollution Estimation
- A Case Study of Yeongdeungpo-gu, Seoul, Korea -
Park, Jinwoo* · Choi, Jinmu** · Hong, Seong-Yun***
Abstract
The address system in Korea was changed to the road-based system in 2014, but the current address coordinates are still largely based on the old, parcel-based system. Compared to the parcel-based address system that defines the center of a parcel as its coordinates, the road-based system locates the coordinates at a certain distance away from the road on which the parcel fronts. The difference in coordinates between these two systems is small, but it can be crucial for micro-level modelling. In order to assess the impact of the discrepancy between the two address systems, this study measured the degree of air pollution exposure at two different locations, the road-based address coordinates and the parcel-based address coordinates, for each of 252 buildings in Yeongdeungpo-gu, Seoul. The air pollution values were estimated using a microscopic air pollution dispersion model, CALINE4, and t-tests and F-tests were conducted to evaluate statistical significance on the observed difference. The results showed a considerable difference in the level of air pollution exposure between the two address systems, suggesting that the on-going use of the parcel-based address coordinates could cause potentially significant errors in micro-level analysis.
Keywords: Road Name Address, Address system, Address coordinates, Geocoding, Air pollution dispersion model
1. Introduction
Address systems have been established using a different addressing scheme for each country and
each era, though their objective is presenting address locations precisely. For example, the USA uses a road-based address system and Japan has developed a parcel-based system (Park et al.
* 경희대학교 지리학과 Department of Geography, Kyung Hee University (first author: [email protected]) ** 경희대학교 지리학과 부교수 Department of Geography, Kyung Hee University (corresponding author: [email protected])
*** 경희대학교 지리학과 조교수 Department of Geography, Kyung Hee University ([email protected])
2009). In Korea, a parcel-based address system has been adopted about 110 years ago since the Japanese colonial periods. Recently, the parcel- based system has begun to show some critical problems such as the loss of continuity for parcel number assignment rules and causing confusion in the address finding, as cities are getting complicated (Kang and Hong 2000). Therefore, the Korean government has changed the national address system from the parcel-based system to the road-based system for improving the efficiency of address finding and administration of the country. By implementing the road-based address system, the limitations of the parcel-based address system are comparatively solved; it has made location findings be easier than before, and it has enhanced the consistency of rule for the address assignment.
Address system is not only a critical element in generating the basic map of a country, but also providing its coordinates as the fundamental spatial information of the country (Kang and Lee 2010; Kim et al. 2011). The address system is very important spatial information because it is used for finding location precisely and efficiently.
Besides, address coordinates are a method for numerically expressing the position of the building.
Therefore, the address coordinates should also be considered as the momentous element, which actually help people to find the exact building of the address.
With the address system transition led by the Korean government, the comparison between the two address systems should be actively carried out (Kang and Jang 2012; Roh and Jeong 2009).
However, much of the previous studies have mainly focused on the construction and management of the address system. Despite the fact that the address system is based on the road, the address coordinates still use the center of a parcel instead of building location of the address.
Therefore, this study investigated the difference between the parcel-based and the road-based address coordinates; how they are different and what influence the difference can make on the urban environment. Since the distance of the two coordinates for the same address are tiny, we adopted a micro-level air pollution model in the urban environment in order to compare the influence of the difference between the two coordinates.
The study area included 252 buildings on three roads, Gyeongin-ro, Yeongdeungpo-ro, and Yeongjung- ro, in Yeongdeungpo-gu which is one of the oldest districts in Seoul.
The paper consists of three more sections. The following section mentioned a discordance between address system and address coordinates, presented on the Internet map. Also, it commented why micro-scale modeling is important in this study and why the air pollution dispersion model is used for the comparison of address coordinates. The next section compared the road-based address coordinates with the parcel-based coordinates using the air pollution data derived from the dispersion model with road, traffic, meteorological, and receptor coordinates data. Then, the statistical verification was carried out on the results. Finally, the key issues and significances were discussed in the conclusion.
2. Theoretical Backgrounds
2.1. Discordance of Address Coordinates with the Address System on the Internet Map
With the transition of address systems, numerous studies have been conducted. Early studies on the address system mainly focused on where to choose for a case study and how to apply the road-based system (Kang and Hong 2000; Choi and Lee 1999).
Researches on the development of management systems for the road-based address system were to proceed concomitantly in the early-2000s (Lee et al. 2001). Later, studies about the efficiency of the validity and the administration of address assignment had been proceeded (Hong and Kim 2015). Ji (2005) built a road-based address database to find duplicated road names and inapplicable names that did not match with the area. During the final stages of construction of the road-based address system in the late 2000s, studies have focused mainly on the attribute amendment such as the changes of the features on the road (Kim et al. 2011; Yeom et al. 2014; Bang et al. 2012).
If you find a location of a road-based address on the internet map, you will see the center of a parcel, not a building. It means that the parcel- based coordinates are still used for road-based address. The discordance on the internet map is caused by the absence of the rule that specify where is the exact point location of the
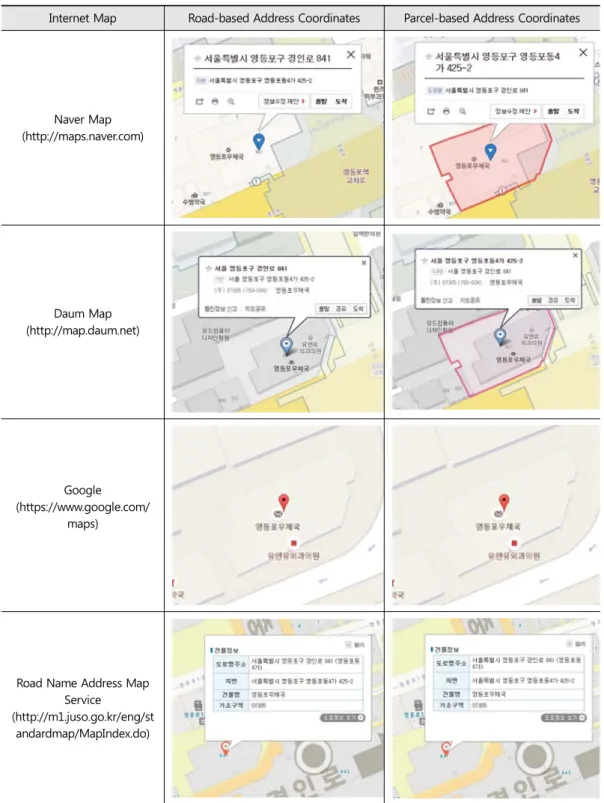
road-based address. Although the address system in Korea was changed to the road-based address system in 2014, the address geocoding process still uses the parcel-based coordinates as a reference, which represents the center of a parcel. Table 1 shows geocoded points with the road-based address
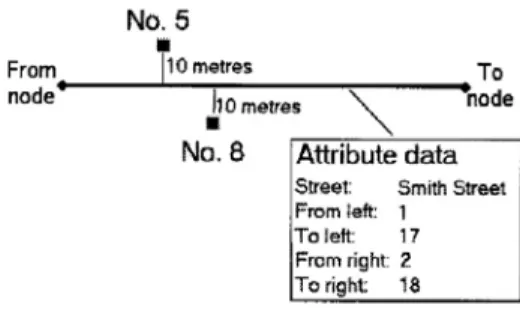
‘841, Gyeongin-ro, Yeongdeungpo- gu, Seoul’ and the parcel based address ‘452-2 Yeogdeungpo-dong 4-ga, Yeongdeungpo-gu, Seoul’. The address coordinates for the two different address systems on the four different internet maps shows the same location. While the road- based address coordinates are generally located either the locations of building entrances or certain distance away from the road toward the buildings (Figure 1, Ratcliffe 2001), the geocoded address coordinates on the Internet map (Table 1) are still shown at the center of the parcel. The problem of geocoding in the new road-based address system has been discussed (Roh and Jeong 2009), but the difference between the coordinates of two different address systems was not experimented.
Figure 1. Example of the Road-Based Address Geocoding Source: Ratcliffe 2001
2009). In Korea, a parcel-based address system has been adopted about 110 years ago since the Japanese colonial periods. Recently, the parcel- based system has begun to show some critical problems such as the loss of continuity for parcel number assignment rules and causing confusion in the address finding, as cities are getting complicated (Kang and Hong 2000). Therefore, the Korean government has changed the national address system from the parcel-based system to the road-based system for improving the efficiency of address finding and administration of the country. By implementing the road-based address system, the limitations of the parcel-based address system are comparatively solved; it has made location findings be easier than before, and it has enhanced the consistency of rule for the address assignment.
Address system is not only a critical element in generating the basic map of a country, but also providing its coordinates as the fundamental spatial information of the country (Kang and Lee 2010; Kim et al. 2011). The address system is very important spatial information because it is used for finding location precisely and efficiently.
Besides, address coordinates are a method for numerically expressing the position of the building.
Therefore, the address coordinates should also be considered as the momentous element, which actually help people to find the exact building of the address.
With the address system transition led by the Korean government, the comparison between the two address systems should be actively carried out (Kang and Jang 2012; Roh and Jeong 2009).
However, much of the previous studies have mainly focused on the construction and management of the address system. Despite the fact that the address system is based on the road, the address coordinates still use the center of a parcel instead of building location of the address.
Therefore, this study investigated the difference between the parcel-based and the road-based address coordinates; how they are different and what influence the difference can make on the urban environment. Since the distance of the two coordinates for the same address are tiny, we adopted a micro-level air pollution model in the urban environment in order to compare the influence of the difference between the two coordinates.
The study area included 252 buildings on three roads, Gyeongin-ro, Yeongdeungpo-ro, and Yeongjung- ro, in Yeongdeungpo-gu which is one of the oldest districts in Seoul.
The paper consists of three more sections. The following section mentioned a discordance between address system and address coordinates, presented on the Internet map. Also, it commented why micro-scale modeling is important in this study and why the air pollution dispersion model is used for the comparison of address coordinates. The next section compared the road-based address coordinates with the parcel-based coordinates using the air pollution data derived from the dispersion model with road, traffic, meteorological, and receptor coordinates data. Then, the statistical verification was carried out on the results. Finally, the key issues and significances were discussed in the conclusion.
2. Theoretical Backgrounds
2.1. Discordance of Address Coordinates with the Address System on the Internet Map
With the transition of address systems, numerous studies have been conducted. Early studies on the address system mainly focused on where to choose for a case study and how to apply the road-based system (Kang and Hong 2000; Choi and Lee 1999).
Researches on the development of management systems for the road-based address system were to proceed concomitantly in the early-2000s (Lee et al. 2001). Later, studies about the efficiency of the validity and the administration of address assignment had been proceeded (Hong and Kim 2015). Ji (2005) built a road-based address database to find duplicated road names and inapplicable names that did not match with the area. During the final stages of construction of the road-based address system in the late 2000s, studies have focused mainly on the attribute amendment such as the changes of the features on the road (Kim et al. 2011; Yeom et al. 2014; Bang et al. 2012).
If you find a location of a road-based address on the internet map, you will see the center of a parcel, not a building. It means that the parcel- based coordinates are still used for road-based address. The discordance on the internet map is caused by the absence of the rule that specify where is the exact point location of the
road-based address. Although the address system in Korea was changed to the road-based address system in 2014, the address geocoding process still uses the parcel-based coordinates as a reference, which represents the center of a parcel. Table 1 shows geocoded points with the road-based address
‘841, Gyeongin-ro, Yeongdeungpo- gu, Seoul’ and the parcel based address ‘452-2 Yeogdeungpo-dong 4-ga, Yeongdeungpo-gu, Seoul’. The address coordinates for the two different address systems on the four different internet maps shows the same location. While the road- based address coordinates are generally located either the locations of building entrances or certain distance away from the road toward the buildings (Figure 1, Ratcliffe 2001), the geocoded address coordinates on the Internet map (Table 1) are still shown at the center of the parcel. The problem of geocoding in the new road-based address system has been discussed (Roh and Jeong 2009), but the difference between the coordinates of two different address systems was not experimented.
Figure 1. Example of the Road-Based Address Geocoding Source: Ratcliffe 2001
Internet Map Road-based Address Coordinates Parcel-based Address Coordinates
Naver Map (http://maps.naver.com)
Daum Map (http://map.daum.net)
Google (https://www.google.com/
maps)
Road Name Address Map Service (http://m1.juso.go.kr/eng/st
andardmap/MapIndex.do)
Table 1. Address Coordinates on the Internet Map 2.2. Air Pollution Dispersion Model for
Urban Environment
Even if a road-based address can be converted into the matching parcel-based address, the coordinates of the road-based address is not the same as that of the matching parcel-based address. As mentioned earlier, Korea adopted a new road-based address system but still uses a parcel-based address coordinates for a road- based address geocoding. If the two address coordinates are not identical, it could trigger a problem for microscopic studies even though the locational difference is small. In this study, the difference in coordinates between the two address systems is small, thus it is necessary to use microscopic model to identify the locational differences.
One of the microscopic models that are very sensitive to the locational difference is the air pollution dispersion model called CALINE4 (Hu et al. 2013). The model uses the address coordinates as input for representing buildings and parcels
(Moon et al. 2005). The estimated value might be different for the input coordinates even with the same model and the same input data (Han and Hwang 2011). Therefore, microscopic differences in the address coordinates can be identified with the air pollution dispersion model.
This study adopted CALINE4 as an air pollution dispersion model developed by CALTRANS (California Department of Transportation)(Benson 1984). CALINE4 is widely used to model the contamination generated by roads inside of a city (Delfino et al. 2014; Hu et al. 2013). In this study, the model is used for identifying locational differences in two different types of address coordinates.
3. Comparison of Address Coordinates corresponding to Address System 3.1. Sequence of the Analysis
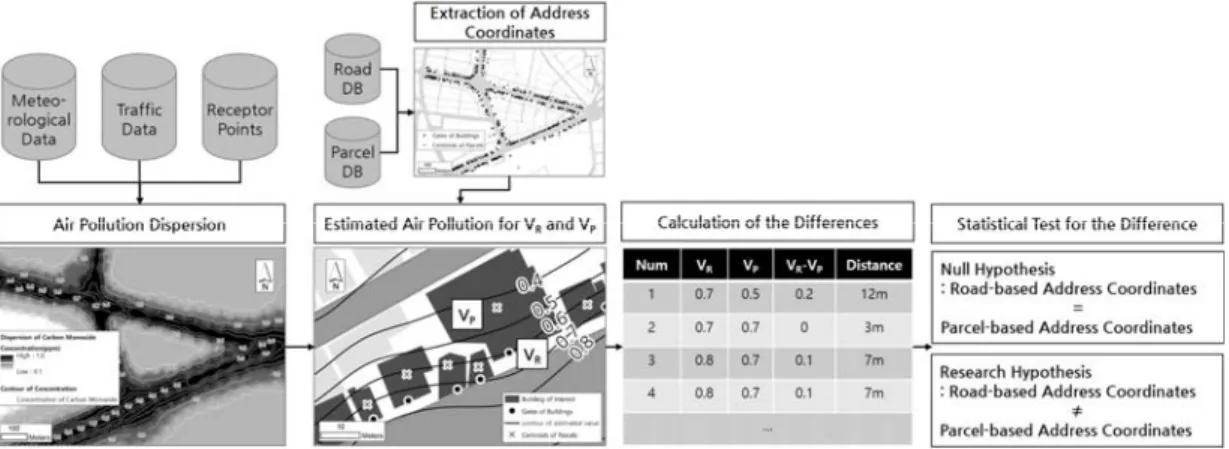
In this research, the analysis was conducted in four phases, as illustrated in Figure 2. In the first phase of the analysis, an air pollution diffusion
Figure 2. Sequence of the Analysis
Internet Map Road-based Address Coordinates Parcel-based Address Coordinates
Naver Map (http://maps.naver.com)
Daum Map (http://map.daum.net)
Google (https://www.google.com/
maps)
Road Name Address Map Service (http://m1.juso.go.kr/eng/st
andardmap/MapIndex.do)
Table 1. Address Coordinates on the Internet Map 2.2. Air Pollution Dispersion Model for
Urban Environment
Even if a road-based address can be converted into the matching parcel-based address, the coordinates of the road-based address is not the same as that of the matching parcel-based address. As mentioned earlier, Korea adopted a new road-based address system but still uses a parcel-based address coordinates for a road- based address geocoding. If the two address coordinates are not identical, it could trigger a problem for microscopic studies even though the locational difference is small. In this study, the difference in coordinates between the two address systems is small, thus it is necessary to use microscopic model to identify the locational differences.
One of the microscopic models that are very sensitive to the locational difference is the air pollution dispersion model called CALINE4 (Hu et al. 2013). The model uses the address coordinates as input for representing buildings and parcels
(Moon et al. 2005). The estimated value might be different for the input coordinates even with the same model and the same input data (Han and Hwang 2011). Therefore, microscopic differences in the address coordinates can be identified with the air pollution dispersion model.
This study adopted CALINE4 as an air pollution dispersion model developed by CALTRANS (California Department of Transportation)(Benson 1984).
CALINE4 is widely used to model the contamination generated by roads inside of a city (Delfino et al.
2014; Hu et al. 2013). In this study, the model is used for identifying locational differences in two different types of address coordinates.
3. Comparison of Address Coordinates corresponding to Address System 3.1. Sequence of the Analysis
In this research, the analysis was conducted in four phases, as illustrated in Figure 2. In the first phase of the analysis, an air pollution diffusion
Figure 2. Sequence of the Analysis
model called CALINE4 was used to simulate air pollution in the urban area. Meteorological data, traffic data and receptor points were used as input data for the model. In the second phase, the simulated air pollution data were used to estimate the degree of pollution at the road-based and parcel-based address coordinates of the same building. The differences in the level of pollution between the two sets of coordinates were measured in the third phase, and a statistical test was carried out to determine whether the observed differences are statistically significant in the last phase.
3.2. Input Data for Air Pollution Dispersion
model called CALINE4 was used to simulate air pollution in the urban area. Meteorological data, traffic data and receptor points were used as input data for the model. In the second phase, the simulated air pollution data were used to estimate
the degree of pollution at the road-based and parcel-based address coordinates of the same building. The differences in the level of pollution between the two sets of coordinates were measured in the third phase, and a statistical test was carried out to determine whether the observed differences are statistically significant in the last phase.
Meteorological data required for CALINE4 includes wind speed, wind direction, the standard deviation of the wind direction, atmospheric stability class, the height of the mixed layer, and temperature.
Among these data, wind speed and temperature were acquired from the Automatic Weather Service data from the Korea Meteorological Administration. The mean and standard deviation of wind direction were calculated based on the Yamartino Method (Yamartino 1984). Atmospheric stability was calculated based on the Pasquill’s stability to simplify calculation (Pasquill 1971).
Table 3 shows the input meteorological data.
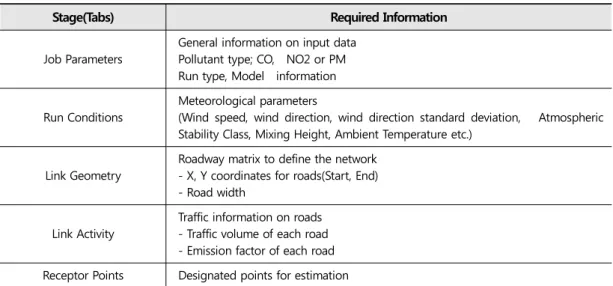
Stage(Tabs) Required Information
Job Parameters
General information on input data Pollutant type; CO, NO2 or PM Run type, Model information
Run Conditions
Meteorological parameters
(Wind speed, wind direction, wind direction standard deviation, Atmospheric Stability Class, Mixing Height, Ambient Temperature etc.)
Link Geometry
Roadway matrix to define the network - X, Y coordinates for roads(Start, End) - Road width
Link Activity
Traffic information on roads - Traffic volume of each road - Emission factor of each road Receptor Points Designated points for estimation
Table 2. Input data for CALINE4 Source: Benson 1984
Figure 3. Roads in the Study Area(Yeongdeungpo-Gu, Seoul)
Category Value
Wind Speed 1.218 m/s
Wind Direction 282.40°
Wind Direction Std. Dev. 16.67°
Atmospheric Stability Class 7(G)
Mixing Height 1230m
Ambient Temperature 29.4°C Table 3. Input Data – Meteorological Data
Source: KAM 2016
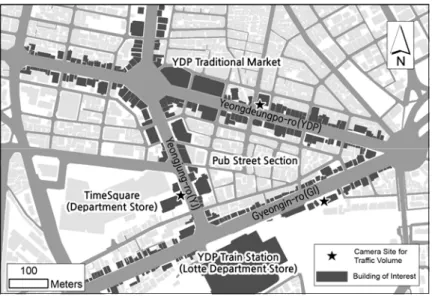
Figure 3 shows a study area including three roads–Yeongdeungpo-ro (YDP), Gyeongin-ro (GI), and Yeongjung-ro (YJ)-near Yeongdeongpo Train Station. The road segment data were derived from the digital topographic map provided by the National Geographic Information Institute (NGII 2013). The parcel-based address coordinates, used in this study, were calculated as the centroid of each parcel from Korean cadastral map. Since Korea does not specify the road-based address
coordinates, the entrances of the buildings were used as the road-based address coordinates, which were obtained from the Road Name Database produced by the Ministry of Interior of Korea (MOI 2013).
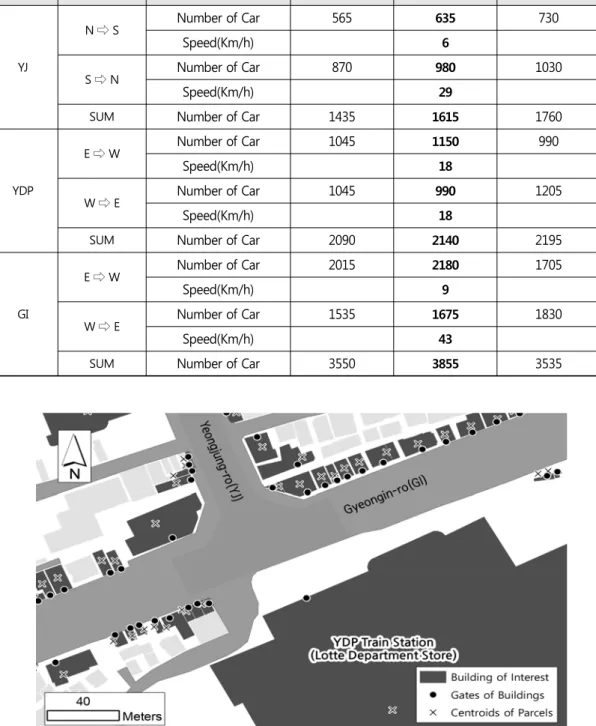
For the traffic data, a direct survey was conducted for three hours from 5 pm to 8 pm on August 14th, 2015. The variation of the traffic is shown in the Table 4. The time was chosen to include the traffic peak time from 6 pm to 7 pm in order to estimate the highest value of the dispersed air pollution. In addition, the speed of cars on the path was obtained from the Seoul Metropolitan Police Agency Compre- hensive Traffic Information Center in order to calculate the emission coefficient.
Address coordinates were assigned as the receptor points of the dispersion model to get the estimated pollution values. Within the research area, 252 buildings near to the roads were selected and two kinds of address coordinates for each building were extracted (Figure 4). One coordinate is for
model called CALINE4 was used to simulate air pollution in the urban area. Meteorological data, traffic data and receptor points were used as input data for the model. In the second phase, the simulated air pollution data were used to estimate the degree of pollution at the road-based and parcel-based address coordinates of the same building. The differences in the level of pollution between the two sets of coordinates were measured in the third phase, and a statistical test was carried out to determine whether the observed differences are statistically significant in the last phase.
3.2. Input Data for Air Pollution Dispersion
model called CALINE4 was used to simulate air pollution in the urban area. Meteorological data, traffic data and receptor points were used as input data for the model. In the second phase, the simulated air pollution data were used to estimate
the degree of pollution at the road-based and parcel-based address coordinates of the same building. The differences in the level of pollution between the two sets of coordinates were measured in the third phase, and a statistical test was carried out to determine whether the observed differences are statistically significant in the last phase.
Meteorological data required for CALINE4 includes wind speed, wind direction, the standard deviation of the wind direction, atmospheric stability class, the height of the mixed layer, and temperature.
Among these data, wind speed and temperature were acquired from the Automatic Weather Service data from the Korea Meteorological Administration. The mean and standard deviation of wind direction were calculated based on the Yamartino Method (Yamartino 1984). Atmospheric stability was calculated based on the Pasquill’s stability to simplify calculation (Pasquill 1971).
Table 3 shows the input meteorological data.
Stage(Tabs) Required Information
Job Parameters
General information on input data Pollutant type; CO, NO2 or PM Run type, Model information
Run Conditions
Meteorological parameters
(Wind speed, wind direction, wind direction standard deviation, Atmospheric Stability Class, Mixing Height, Ambient Temperature etc.)
Link Geometry
Roadway matrix to define the network - X, Y coordinates for roads(Start, End) - Road width
Link Activity
Traffic information on roads - Traffic volume of each road - Emission factor of each road Receptor Points Designated points for estimation
Table 2. Input data for CALINE4 Source: Benson 1984
Figure 3. Roads in the Study Area(Yeongdeungpo-Gu, Seoul)
Category Value
Wind Speed 1.218 m/s
Wind Direction 282.40°
Wind Direction Std. Dev. 16.67°
Atmospheric Stability Class 7(G)
Mixing Height 1230m
Ambient Temperature 29.4°C Table 3. Input Data – Meteorological Data
Source: KAM 2016
Figure 3 shows a study area including three roads–Yeongdeungpo-ro (YDP), Gyeongin-ro (GI), and Yeongjung-ro (YJ)-near Yeongdeongpo Train Station. The road segment data were derived from the digital topographic map provided by the National Geographic Information Institute (NGII 2013). The parcel-based address coordinates, used in this study, were calculated as the centroid of each parcel from Korean cadastral map. Since Korea does not specify the road-based address
coordinates, the entrances of the buildings were used as the road-based address coordinates, which were obtained from the Road Name Database produced by the Ministry of Interior of Korea (MOI 2013).
For the traffic data, a direct survey was conducted for three hours from 5 pm to 8 pm on August 14th, 2015. The variation of the traffic is shown in the Table 4. The time was chosen to include the traffic peak time from 6 pm to 7 pm in order to estimate the highest value of the dispersed air pollution. In addition, the speed of cars on the path was obtained from the Seoul Metropolitan Police Agency Compre- hensive Traffic Information Center in order to calculate the emission coefficient.
Address coordinates were assigned as the receptor points of the dispersion model to get the estimated pollution values. Within the research area, 252 buildings near to the roads were selected and two kinds of address coordinates for each building were extracted (Figure 4). One coordinate is for
Road Name
Heading
Direction Type of Information 5 pm∼6 pm 6 pm∼7 pm 7 pm∼8 pm
YJ
N ⇨ S Number of Car 565 635 730
Speed(Km/h) 6
S ⇨ N Number of Car 870 980 1030
Speed(Km/h) 29
SUM Number of Car 1435 1615 1760
YDP
E ⇨ W Number of Car 1045 1150 990
Speed(Km/h) 18
W ⇨ E Number of Car 1045 990 1205
Speed(Km/h) 18
SUM Number of Car 2090 2140 2195
GI
E ⇨ W Number of Car 2015 2180 1705
Speed(Km/h) 9
W ⇨ E Number of Car 1535 1675 1830
Speed(Km/h) 43
SUM Number of Car 3550 3855 3535
Table 4. Traffic Data Source: SPATIC 2016
Figure 4. Differences in Address Coordinates between Gate of Building (Road-based) and Centroids of Parcels(Parcel-based)
the parcel-based address (the centroid of a parcel) and the other is for the road-based address (the entrance of a building). Table 5 shows that the difference between these two sets of address coordinates is as large as 85 m in a building like the YDP Train Station at the bottom right side of Figure 4.
3.3. Differences in the Estimated Values for Each Coordinates Pairs ]
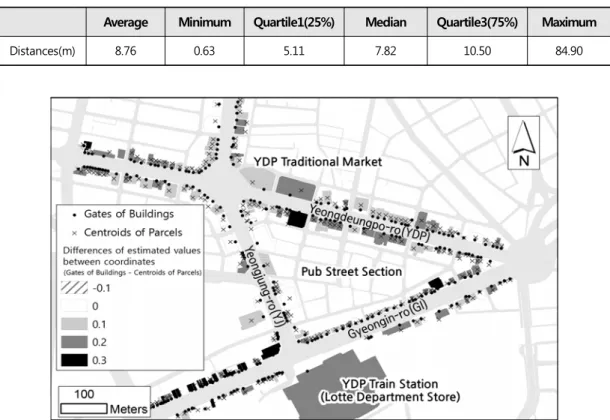
Figure 5 shows differences in the estimated pollution values between the two sets of address coordinates for each building. Note that the estimated value using the road-based address
coordinates is and the parcel-based address coordinates is . In Figure 5, is larger for the most of the buildings. It is because, in many cases, the road-based address coordinates are closer to the road than its counterpart, the parcel-based address coordinates. Table 6 shows the building number for each difference( - ) in the estimated pollution values. The differences of the estimated pollution values between two coordinates were ranged from -0.1ppm to 0.3ppm. Among the investigated 252 buildings, only three buildings showed larger in 0.1ppm. More than 70% of buildings showed larger .
Average Minimum Quartile1(25%) Median Quartile3(75%) Maximum
Distances(m) 8.76 0.63 5.11 7.82 10.50 84.90
Table 5. Distance between address coordinates pairs
Figure 5. Differences of the estimated values between pair of coordinates
Road Name
Heading
Direction Type of Information 5 pm∼6 pm 6 pm∼7 pm 7 pm∼8 pm
YJ
N ⇨ S Number of Car 565 635 730
Speed(Km/h) 6
S ⇨ N Number of Car 870 980 1030
Speed(Km/h) 29
SUM Number of Car 1435 1615 1760
YDP
E ⇨ W Number of Car 1045 1150 990
Speed(Km/h) 18
W ⇨ E Number of Car 1045 990 1205
Speed(Km/h) 18
SUM Number of Car 2090 2140 2195
GI
E ⇨ W Number of Car 2015 2180 1705
Speed(Km/h) 9
W ⇨ E Number of Car 1535 1675 1830
Speed(Km/h) 43
SUM Number of Car 3550 3855 3535
Table 4. Traffic Data Source: SPATIC 2016
Figure 4. Differences in Address Coordinates between Gate of Building (Road-based) and Centroids of Parcels(Parcel-based)
the parcel-based address (the centroid of a parcel) and the other is for the road-based address (the entrance of a building). Table 5 shows that the difference between these two sets of address coordinates is as large as 85 m in a building like the YDP Train Station at the bottom right side of Figure 4.
3.3. Differences in the Estimated Values for Each Coordinates Pairs ]
Figure 5 shows differences in the estimated pollution values between the two sets of address coordinates for each building. Note that the estimated value using the road-based address
coordinates is and the parcel-based address coordinates is . In Figure 5, is larger for the most of the buildings. It is because, in many cases, the road-based address coordinates are closer to the road than its counterpart, the parcel-based address coordinates. Table 6 shows the building number for each difference( - ) in the estimated pollution values. The differences of the estimated pollution values between two coordinates were ranged from -0.1ppm to 0.3ppm. Among the investigated 252 buildings, only three buildings showed larger in 0.1ppm. More than 70% of buildings showed larger .
Average Minimum Quartile1(25%) Median Quartile3(75%) Maximum
Distances(m) 8.76 0.63 5.11 7.82 10.50 84.90
Table 5. Distance between address coordinates pairs
Figure 5. Differences of the estimated values between pair of coordinates
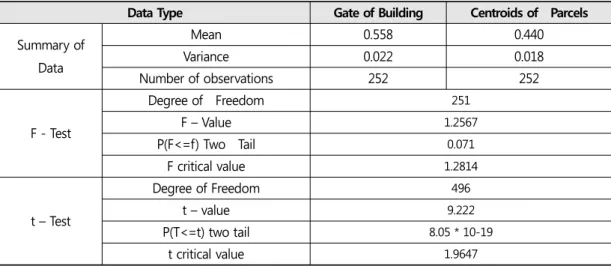
Data Type Gate of Building Centroids of Parcels
Summary of Data
Mean 0.558 0.440
Variance 0.022 0.018
Number of observations 252 252
F - Test
Degree of Freedom 251
F – Value 1.2567
P(F<=f) Two Tail 0.071
F critical value 1.2814
t – Test
Degree of Freedom 496
t – value 9.222
P(T<=t) two tail 8.05 * 10-19
t critical value 1.9647
Table 7. Results of Statistical Tests
Decreased Maintained Increased
Difference(ppm) -0.1 0 0.1 0.2 0.3
Number(%) 3(1.2) 54(21.4) 109(43.3) 68(27) 18(7.1)
Table 6. Building Number for each Difference Value( - )
3.4. Statistical Test for the Difference
Statistical tests were performed to verify the differences between the estimated values for the sample address coordinates. F-test and t-test were employed to validate the statistical significance of the difference in both variance and mean of the estimated pollution values, respectively. Table 7 shows the results from the statistical tests. For the F-test, there were little evidence against the null hypothesis of equal variances. However, the result from the t-test (9.222) was much larger than the t-critical value (1.9647), so the null hypothesis of equal means could be rejected. This suggests that changes in the estimated value accompanying changes in address coordinates are not simply due
to sampling; it is likely that they are truly different in reality.
4. Conclusion
The Korean government has changed the national address system to the road-based address system for the efficiency of address finding. However, the parcel-based address coordinates(for the center of a parcel) are still used as if it is the coordinates of corresponding road-based address for geocoding.
Therefore, this study investigated the difference between the two coordinates using an air pollution dispersion model in the microscopic urban environment.
Because the distances between the two address coordinates are relatively small, CALINE4 model
was chosen, which is widely applied for air pollution modeling at microscale. With road, traffic, meteorological, and receptor coordinates data, CALINE4 derived the estimated air pollution values for the two address coordinates of 252 buildings around the Yeongdeungpo station.
Although the estimated differences between two address coordinates might be small in rural areas due to small traffic volume, this study showed a case that the parcel-based address coordinates cannot be used for the road-based address.
In the results, the differences of the estimated values between the two coordinates were ranged from -0.1ppm to 0.3ppm. Among the investigated 252 buildings, more than 70% of buildings showed larger value at the entrance of buildings that represented the road-based address coordinates.
The t-test showed that those two estimated pollution values are significantly different in mean. Consequently, it reveals that the parcel- based address coordinates could not be used for the road-based address for micro-level analysis.
The comparison of address coordinates according to the address system performed in this study has two kinds of future research tasks. First, further experiments under various conditions is necessary.
Only one day traffic data was applied for air pollution estimation in this study, but more sample in various time and season might be necessary to generalize the result of this study. Second, a new method to derive the road-based address coordinates should be specified such as the center of a building or the enterence of it. Further, new road- based geocoding method should be investigated with the road-based address structure and coordinates.
References
Bang Y, Ga C, Yu K. 2012. Matching and Attribute Conflating Method for Linking the Digital Map with the Road Name Address System - Focused on the road centerline layer. Journal of the Korean Society of Surveying, Geodesy, Photogrammetry and Cartography. 30(4):379-388. Benson PE. 1984. CALINE4-A Dispersion Model for
Predicting Air Pollutant Concentrations near Roadways, Final Report. Sacramento (CA):California Department of Transportation. No. FHWA/ CA/TL-84/15.
Choi Y, Lee S. 1999. A Study on the Effective Ways for Establishing New Address System and Executing Early-Focused on the Case of Chong-Ju City-. Journal of the Korean Cadastre Information Association. 1:15-40.
Daum. 2016. Daum Map [Interent]. [http://map.daum. net]. Last accessed 15 September 2016. Delfino RJ, Wu J, Tjoa T, Gullesserian SK,
Nickerson B, Gillen DL. 2014. Asthma Morbidity and Ambient Air Pollution: Effect Modification by Residential Traffic-Related Air Pollution. Epidemiology. 25(1):48-57. Google. 2016. Google Map [Interent]. [https://www.google.
com/maps]. Last accessed 15 September 2016. Han D, Hwang SS. 2011. Spatial Epidemiology and
Environmental Health: on the Use of Spatially Referenced Health and Environment Data. Korean Journal of Environmental Health. 37(1):1-11.
Hong SI, Kim YH. 2015. A Study on Geographical Category Classification of Road Names of New Address System : in the Case of Cheongju City. Journal of The Korean Association of
Data Type Gate of Building Centroids of Parcels
Summary of Data
Mean 0.558 0.440
Variance 0.022 0.018
Number of observations 252 252
F - Test
Degree of Freedom 251
F – Value 1.2567
P(F<=f) Two Tail 0.071
F critical value 1.2814
t – Test
Degree of Freedom 496
t – value 9.222
P(T<=t) two tail 8.05 * 10-19
t critical value 1.9647
Table 7. Results of Statistical Tests
Decreased Maintained Increased
Difference(ppm) -0.1 0 0.1 0.2 0.3
Number(%) 3(1.2) 54(21.4) 109(43.3) 68(27) 18(7.1)
Table 6. Building Number for each Difference Value( - )
3.4. Statistical Test for the Difference
Statistical tests were performed to verify the differences between the estimated values for the sample address coordinates. F-test and t-test were employed to validate the statistical significance of the difference in both variance and mean of the estimated pollution values, respectively. Table 7 shows the results from the statistical tests. For the F-test, there were little evidence against the null hypothesis of equal variances. However, the result from the t-test (9.222) was much larger than the t-critical value (1.9647), so the null hypothesis of equal means could be rejected. This suggests that changes in the estimated value accompanying changes in address coordinates are not simply due
to sampling; it is likely that they are truly different in reality.
4. Conclusion
The Korean government has changed the national address system to the road-based address system for the efficiency of address finding. However, the parcel-based address coordinates(for the center of a parcel) are still used as if it is the coordinates of corresponding road-based address for geocoding.
Therefore, this study investigated the difference between the two coordinates using an air pollution dispersion model in the microscopic urban environment.
Because the distances between the two address coordinates are relatively small, CALINE4 model
was chosen, which is widely applied for air pollution modeling at microscale. With road, traffic, meteorological, and receptor coordinates data, CALINE4 derived the estimated air pollution values for the two address coordinates of 252 buildings around the Yeongdeungpo station.
Although the estimated differences between two address coordinates might be small in rural areas due to small traffic volume, this study showed a case that the parcel-based address coordinates cannot be used for the road-based address.
In the results, the differences of the estimated values between the two coordinates were ranged from -0.1ppm to 0.3ppm. Among the investigated 252 buildings, more than 70% of buildings showed larger value at the entrance of buildings that represented the road-based address coordinates.
The t-test showed that those two estimated pollution values are significantly different in mean. Consequently, it reveals that the parcel- based address coordinates could not be used for the road-based address for micro-level analysis.
The comparison of address coordinates according to the address system performed in this study has two kinds of future research tasks. First, further experiments under various conditions is necessary.
Only one day traffic data was applied for air pollution estimation in this study, but more sample in various time and season might be necessary to generalize the result of this study. Second, a new method to derive the road-based address coordinates should be specified such as the center of a building or the enterence of it. Further, new road- based geocoding method should be investigated with the road-based address structure and coordinates.
References
Bang Y, Ga C, Yu K. 2012. Matching and Attribute Conflating Method for Linking the Digital Map with the Road Name Address System - Focused on the road centerline layer. Journal of the Korean Society of Surveying, Geodesy, Photogrammetry and Cartography. 30(4):379-388.
Benson PE. 1984. CALINE4-A Dispersion Model for Predicting Air Pollutant Concentrations near Roadways, Final Report. Sacramento (CA):California Department of Transportation. No. FHWA/
CA/TL-84/15.
Choi Y, Lee S. 1999. A Study on the Effective Ways for Establishing New Address System and Executing Early-Focused on the Case of Chong-Ju City-. Journal of the Korean Cadastre Information Association. 1:15-40.
Daum. 2016. Daum Map [Interent]. [http://map.daum.
net]. Last accessed 15 September 2016.
Delfino RJ, Wu J, Tjoa T, Gullesserian SK, Nickerson B, Gillen DL. 2014. Asthma Morbidity and Ambient Air Pollution: Effect Modification by Residential Traffic-Related Air Pollution. Epidemiology. 25(1):48-57.
Google. 2016. Google Map [Interent]. [https://www.google.
com/maps]. Last accessed 15 September 2016.
Han D, Hwang SS. 2011. Spatial Epidemiology and Environmental Health: on the Use of Spatially Referenced Health and Environment Data.
Korean Journal of Environmental Health.
37(1):1-11.
Hong SI, Kim YH. 2015. A Study on Geographical Category Classification of Road Names of New Address System : in the Case of Cheongju City. Journal of The Korean Association of
Regional Geographers. 21(3):553-568
Hu H, Barlow T, Lee Y, Cho H, Kim M. 2013.
Developing a Roadside Air Quality Assessment Methodology Using Seoul Air Quality Monitoring Data. Seoul Studies. 14(2):115-129.
Ji JD. 2005. The Course of Development and Actual Conditions of New Address Systems in Korea.
Journal of The Korean Society Of Cadastre.
21(2):37-52.
Kang Y, Hong IO. 2000. A Study on Road Network for the Implementation of New Address System in Seoul. Journal of the Korean Urban Geographical Society. 3(2):57-71.
Kang Y, Jang Y. 2012. A Study on the Integrated Topological Data Model Based on Linear Features of New Address and National Basic Districts. Journal of the Korean Cartographic Association. 12(3):63-79.
Kang Y, Lee J. 2010. The Strategy for Constructing New Address Data as Framework Data of Korean National Spatial Data Infrastructure.
Journal of the Korean Cartographic Association.
10(2):113-127.
Kim JH, Chae GS, Park KH, Hong SE. 2011. A Study on a Method of the Updating Building Data in a Map of Road Name Based Address. Journal of the Korean Cadastre Information Association.
13(2):89-100
(KMA) Korea Meteorological Administration. 2016.
Automatic Weather Service [Interent]. [http://web.kma.
go.kr/eng/index.jsp]. Last accessed 15 September 2016.
Lee MY, Oh MS, Lee JY, Shin YC. 2001. A Study on the Management System of the New Address -Grant Scheme of Road Name and Building
Number in Cheongju City-. Journal of the Korean Association of Geographic Information Studies. 4(1):47-56.
(MOI) Ministry of the Interior. 2013. The Database for the Road Name Address System [Interent].
[http://www.juso.go.kr/info/RoadMapData.ht m]. Last accessed 15 September 2016.
(MOI) Ministry of the Interior. 2016. Road Name Address Map Service [Interent]. [http://m1.juso.go.kr /eng/standardmap/MapIndex.do]. Last accessed 15 September 2016.
Moon N, Lee Y, Kang Y, Kim Y. 2005. The Application of Air Quality Models on Environment Impact Assessment. Korea Environment Institute.
Research Thesis. p.1-153.
(NGII) National Geographic Information Institute.
2013. The Consecutive Digital Map [Interent].
[http://map.ngii.go.kr/mn/mainPage.do].
Last accessed 15 September 2016.
Naver. 2016. Naver Map [Interent]. [http://maps.
naver.com]. Last accessed 15 September 2016.
Park JH, Kim HY, Park JH. 2009. Address, Zip Code and Administrative Districts around the World.
Postal & Logistics technology Review. 8(3):23- 42.
Pasquill F. 1971. Atmospheric Dispersion of Pollution.
Quarterly Journal of the Royal Meteorological Society. 97(414):369-395.
Ratcliffe JH. 2001. On the Accuracy of TIGER- Type Geocoded Address Data in Relation to Cadastral and Census Areal Units. International Journal of Geographical Information Science.
15(5):473-485.
Roh H, Jeong J. 2009. Geocoding Implementation of Korea’s New Address System. The Journal of
Applied Geography. 28:31-55.
(SPATIC) Seoul Metropolitan Police Agency Comprehensive Traffic Information Center. 2016. Traffic Information [Interent]. [http://www.spatic.go.kr/ wwwen/trafficArtery.
dev]. Last accessed 15 September 2016.
Yamartino R. 1984. A Comparison of Several
“Single-Pass” Estimators of the Standard Deviation of Wind Direction. Journal of Climate and Applied Meteorology. 23(9):1362-1366.
Yeom JH, Huh Y, Lee J. 2014. Building Matching
Analysis and New Building Update for the Integrated Use of the Digital Map and the Road Name Address Map. Journal of the Korean Society of Surveying, Geodesy, Photogrammetry and Cartography. 32(5):459-467.
2016년 10월 03일 원고접수(Received) 2016년 11월 03일 1차심사(1st Reviewed) 2016년 12월 07일 게재확정(Accepted)
도심대기오염추정을 위한 도로명주소좌표와 지번주소좌표의 비교 - 서울 영등포 지역의 사례연구 -
초 록
2014년 한국의 주소체계는 지번기반에서 도로명기반으로 변화하였다. 그러나 주소좌표는 지번주 소체계의 주소좌표를 그대로 사용하고 있다. 지번주소 좌표는 필지의 중심에 위치하는 반면, 도로명 주소 좌표는 도로로부터 일정한 거리에 위치한다. 따라서 도로명주소와 지번주소의 차이는 작지만 미시적 모델링에서는 결정적일수 있다. 두 좌표 그룹의 차이를 살펴보기 위해, 본 연구는 도시지역에 서 대기오염 배출량을 추정하는 사례연구를 수행하였다. 도시에서는 필지의 크기가 작기 때문에 두 그룹의 자표간 거리도 작다. 따라서 미시적 대기오염 확산 모델인 CALINE4가 각 좌표에서의 대기오 염 추정량의 차이를 살펴보기 위해 선정되었다. 입력자료로 서울시 영등포구의 도로들에 인접한 252 개의 건물들을 대상으로 두 그룹의 좌표들이 수집되었다. 각 건물에 대해 두 개의 서로 다른 주소 좌 표에 대해 대기오염량이 추정되었고, t 검증과 F 검증을 사용하여 그 값들의 통계적 차이를 검증하였 다. 통계적 검증 결과 각 건물의 두 주소에 대해 추정된 대기오염량이 통계적으로 유의한 차이가 있 음을 보였다. 따라서 지번주소기반 좌표를 도로명주소의 좌표로 사용하면 미시적 분석에 있어서 상 당한 오류를 야기할 수 있다.
주요어 : 도로명주소, 주소체계, 주소좌표, 지오코딩, 대기오염확산모델.