JPNT 6(2), 79-86 (2017)
https://doi.org/10.11003/JPNT.2017.6.2.79
JPNT
Journal of Positioning,Navigation, and Timing
1. INTRODUCTION
Precision positioning using GNSS is used in a number of fields including land surveying, national defense, and construction; a number of precision positioning methods have been developed. Real Time Kinematic (RTK) refers to a differential positioning method using GNSS that removes errors related to satellite, ionosphere, and troposphere through double differencing and makes it possible for accurate positioning within 2~3 cm should the positioning be undertaken within 10 km of a reference station. However,
Accuracy Analysis of Code-based PPP-RTK Positioning Utilizing K-SSR Correction Messages Outside the Reference Network
Woong-Jun Yoon1†, Kwan-Dong Park1, Hye-In Kim2, Seung Woo Seo3, Junpyo Park3
1Department of Geoinformatic Engineering, Inha University, Incheon 22212, Korea
2PPSoln Inc., Seoul 08504, Korea
3Agency for Defense Development, Daejeon 34186, Korea
ABSTRACT
Precise Point Positioning-Real Time Kinematic (PPP-RTK) refers to a technology that combines PPP with network-RTK in which a user does not directly receive observed data from a reference station but receives State-Space Representation (SSR) messages corrected for error components from a central processing station through Networked Transport of RTCM via Internet Protocol (NTRIP) or Digital Multimedia Broadcasting (DMB) for purposes of positioning. SSR messages, which refer to corrections used in PPP-RTK, are generated by a central processing station using real-time observed data collected from reference stations and account for corrections needed due to the ionosphere, troposphere, satellite orbital errors, satellite time offsets, and satellite biases. This study used a type of SSR message provided in South Korea, known as Korea-SSR (K-SSR), to implement a PPP-RTK algorithm based on code-pseudorange measurements and validated its accuracy within the reference station network. In order to validate the accuracy of the implemented algorithm outside of the network, the K-SSR was extrapolated and applied to positioning in reference stations in Changchun, China (CHAN) and Japan (AIRA). This also entailed a quantitative evaluation that measured improvements in accuracy in comparison with point positioning. The results of the study showed that positioning applied with extrapolated K-SSR correction data was more accurate in both AIRA and CHAN than point positioning with improvements of approximately 20~50%.
Keywords: global positioning system, precise point positioning, state space representation, real-time kinematic, multiple regression
the accuracy of RTK is reduced when the baseline with the reference station is greater than 10 km. Network-RTK was developed as a positioning method to overcome such shortcomings of RTK (Vollath et al. 2000). Network-RTK makes it possible for accurate positioning up to 2~3 cm and covers a larger area than traditional RTK by using a network of reference stations. However, Network-RTK requires bi- directional communication which limits the number of users, requires up to 50~60 reference stations in the case of South Korea, and results in heavy data usage due to users having to receive data from a reference station as is the case with RTK. Precise Point Positioning (PPP) refers to precise point positioning, which unlike differential positioning that removes errors through double differentiation, receives satellite related errors of each component and applies the errors to positioning. Because of this, the location of the Received Feb 17, 2017 Revised Mar 30, 2017 Accepted Apr 1, 2017
†Corresponding Author E-mail: [email protected]
Tel: +82-32-873-4310 Fax: +82-32-6455-4305
https://doi.org/10.11003/JPNT.2017.6.2.79
user does not need to be transmitted to the reference station which makes one-directional communication possible.
Also because the observation data of a reference station is not directly received, PPP makes it possible to receive correction data having light data loads. However, unlike RTK and Network-RTK, which are based on differential positioning and almost completely remove errors due to the ionosphere or troposphere for short baseline distances, PPP is not based on differential positioning which requires much time to estimate integer ambiguity for carrier wave- based positioning.
PPP-RTK, which supplements the shortcomings of PPP and Network-RTK, refers to a technology that applies to positioning correction data generated from a central processing station that accounts for each error component including ionosphere or troposphere induced errors. As PPP-RTK receives correction data that account for errors induced by the ionosphere and troposphere, its convergence time is longer than PPP (Wubbena et al. 2005). In addition, PPP-RTK makes one-directional communication possible and makes real-time PPP-RTK possible when undertaking positioning based on code-pseudorange measurements.
The correction data applied to PPP-RTK technology is also known as state space correction data and includes correction data that accounts for errors due to satellite time differences, satellite orbits, satellite biases, the ionosphere, and the troposphere. Recently, Kim (2016) applied the Korea-State-Space Representation (K-SSR) to a PPP-RTK based on code-pseudorange measurements to develop a stable algorithm that computes locations at the sub-meter level. PPP-RTK that applies K-SSR shows high accuracy within reference station networks. However, due to difficulties in computing correction data associated with the ionosphere or troposphere outside of the network, its accuracy cannot be relied on in such cases. Because of this, in order to use PPP-RTK in nearby offshore areas or areas outside of the lattice points of the Korean peninsula, its accuracy needs to be checked.
This study validates the accuracy of PPP-RTK based on code-pseudorange measurements applied with K-SSR, a type of SSR message provided in South Korea, outside of its network by extrapolating the K-SSR and applying the extrapolation to permanent observation centers located in Japan and China to undertake positioning. Before doing so, an algorithm of PPP-RTK based on code-pseudorange measurements applied with K-SSR was implemented and checked for its positioning accuracy within its network using a reference station in Daejeon operated by the Korea Astronomy and Space Science Institute. The K-SSR was extrapolated using multiple regression; its range of
application was expanded to include areas outside of the reference station network. The extrapolated K-SSR was then applied to the implemented algorithm for the purposes of quantitively evaluating the accuracy of positioning through the AIRA (Japan) and CHAN (China) reference stations outside of the network.
2. PPP-RTK
In 2012, South Korea introduced a program called the GNSS State Monitoring And Representation Technique (GNSMART) from a German firm known as GEO++ that generates PPP-RTK correction data. Currently a firm called PPSOLN is generating PPP-RTK correction data on a trial basis using the reference stations of the National Geographic Information Institute. Fig. 1 represents the PPP-RTK reference station network in South Korea, which includes a total of 19 reference stations including Jeju Island.
SSR messages are generated from a central processing station and are based on observation data collected from reference stations. As shown in Fig. 2 the central processing station models correction values according to each error factor, which is why it is called state space correction data where transmission cycles differ according to the rate of change of the error factors (Won 2015). Satellite time offset transmission cycles, due to large time differences, have short transmission cycles of 1~10 seconds whereas satellite bias, which changes comparatively slowly, has long transmission cycles of 30 minutes. The SSR correction data is provided in the Radio Technical Commission for Maritime Services (RTCM) format where SSR is included starting with the Fig. 1. PPP-RTK reference stations used in this study.
Woong-Jun Yoon et al. Code-based PPP-RTK Outside the Network 81
RTCM 3.2 version. Currently, the International GNSS Service- Real Time Service (IGS-RTS) of the IGS provides correction data worldwide that accounts for GPS and GLONASS errors due to satellite orbits, satellite time offsets, and satellite biases but excludes errors due to the ionosphere and troposphere.
The SSR message provided in South Korea, known as K-SSR, is generated using the GNSMART program from a central processing station that collects observation data from 19 reference stations in South Korea. The SSR message also includes correction data that accounts for errors due to satellite orbits, satellite time offsets, satellite biases, and the ionosphere, and troposphere. The types of provided satellite obit correction data include correction values that account for along-track, cross-track, and radial direction satellite orbits of each satellite and the provided satellite time offset correction data include correction coefficients for each satellite. Correction data regarding satellite biases include codes for each frequency and carrier wave bias correction values.
Correction data accounting for errors due to the ionosphere and troposphere are provided via correction values at lattice points where users interpolate correction
values for use according to their location. The lattice points are represented in Fig. 3 which includes points having a longitudinal and latitudinal distance of 1° between latitudes of 34° to 39° and longitudes of 126° to 130°. Ionosphere correction data is provided via slant total electron content (STEC) values of each satellite at each lattice point and troposphere correction data is provided from zenith path dry delay volumes and wet delay volumes of the lattice points. Table 1 represents the correction data provided by the K-SSR.
The SSR correction data applied algorithm additionally applies correction data to the code-pseudorange measurement observation equation and the observation equation of p, and the code-pseudorange measurement is represented in Eq. (1) (Misra & Enge 2011).
p = ρ + c(δtr - δts) + I + T + M + br + bs +e (1)
In Eq. (1), p refers to the geometric range between the receiver and satellite; c refers to the speed of light; δtr refers to the receiver time offset; δts refers to the satellite time offset; I refers to the ionosphere induced error; T refers to the troposphere induced error; M refers to the multi-path error; br refers to receiver bias; bs refers to satellite bias; and e refers to noise interference.
The satellite orbit correction data of the K-SSR is provided via correction values for along-track, cross-track, and radial directions and is converted to Earth-Center Earth-Fixed (ECEF) values for application to the algorithm. The Satellite orbit correction data equation is represented in Eq. (2).
Xc = Xb - Xssr (2)
In Eq. (2), Xc refers to the corrected satellite coordinate, Xb refers to the satellite coordinate computed via the broadcasted orbit, and Xssr refers to the satellite orbit correction data converted to ECEF.
Fig. 2. Concept of state space representation (Wubbena 2012).
Fig. 3. Grid points of K-SSR.
Table 1. K-SSR corrections.
Types of K-SSR Components Satellite orbit radial
along-track cross-track Satellite clock offset Clock bias
Clock drift Clock drift rate Satellite bias C1
P2 L1 L2
Ionosphere STEC
Troposphere Zenith Hydrostatic Delay (ZHD) Zenith Wet Delay (ZWD)
82 JPNT 6(2), 79-86 (2017)
https://doi.org/10.11003/JPNT.2017.6.2.79
The satellite time offset correction data is given by a function having three coefficients and can be computed using Eq. (3).
3 p = ρ + c(δ𝑡𝑡𝑟𝑟− 𝛿𝛿𝑡𝑡𝑠𝑠) + I + T + M + 𝑏𝑏𝑟𝑟+ 𝑏𝑏𝑠𝑠+ 𝑒𝑒 (1)
In Eq. (1), p refers to the geometric range between the receiver and satellite; c refers to the speed of light; δ𝑡𝑡𝑟𝑟 refers to the receiver time offset; 𝛿𝛿𝑡𝑡𝑠𝑠 refers to the satellite time offset; I refers to the ionosphere induced error; T refers to the troposphere induced error; M refers to the multi-path error; 𝑏𝑏𝑟𝑟 refers to receiver bias; 𝑏𝑏𝑠𝑠 refers to satellite bias; and 𝑒𝑒 refers to noise interference.
The satellite orbit correction data of the K-SSR is provided via correction values for along-track, cross-track, and radial directions and is converted to Earth-Center Earth-Fixed (ECEF) values for application to the algorithm. The Satellite orbit correction data equation is represented in Eq. (2).
Χ𝑐𝑐= Χ𝑏𝑏− Χ𝑠𝑠𝑠𝑠𝑟𝑟 (2) In Eq. (2), Χ𝑐𝑐 refers to the corrected satellite coordinate, Χ𝑏𝑏 refers to the satellite coordinate computed via the broadcasted orbit, and Χ𝑠𝑠𝑠𝑠𝑟𝑟 refers to the satellite orbit correction data converted to ECEF.
The satellite time offset correction data is given by a function having three coefficients and can be computed using Eq.
(3).
δ𝑡𝑡𝑠𝑠𝑠𝑠𝑟𝑟𝑠𝑠 = 𝑎𝑎𝑠𝑠𝑠𝑠𝑟𝑟+ 𝑏𝑏𝑠𝑠𝑠𝑠𝑟𝑟(𝑡𝑡 − 𝑡𝑡0) + 𝑐𝑐𝑠𝑠𝑠𝑠𝑟𝑟(𝑡𝑡 − 𝑡𝑡0)2
𝑐𝑐 (3)
In Eq. (3), δ𝑡𝑡𝑠𝑠𝑠𝑠𝑟𝑟𝑠𝑠 refers to the satellite time offset correction data; 𝑎𝑎𝑠𝑠𝑠𝑠𝑟𝑟 refers to clock bias correction data (m); 𝑏𝑏𝑠𝑠𝑠𝑠𝑟𝑟 refers to clock drift correction data; 𝑐𝑐𝑠𝑠𝑠𝑠𝑟𝑟 refers to clock drift rate correction data (m/s2); t refers to time of positioning; 𝑡𝑡0 refers to the correction data reference time; and c refers to the speed of light. The satellite bias correction data is based on codes of each frequency that do not require a separate computing equation and carrier wave bias correction values where the C/A code bias correction value was applied to the algorithm.
For the ionosphere correction data, the STEC of each satellite of each lattice point distanced longitudinally at 1° is provided. The STECs of four lattice points near the location of the user were interpolated and applied to the algorithm. The Ionosphere delay volume is shown in Eq. (4).
Ι𝑠𝑠𝑠𝑠𝑟𝑟= 40.3
𝑓𝑓2 𝑆𝑆𝑆𝑆𝑆𝑆𝑆𝑆 (4)
In Eq. (4), Ι𝑠𝑠𝑠𝑠𝑟𝑟 refers to ionosphere delay volumes, 𝑓𝑓 refers to the frequency, and 𝑆𝑆𝑆𝑆𝑆𝑆𝑆𝑆 refers to slant total electron content. The troposphere correction data was provided from zenith path dry delay volumes and wet delay volumes of the lattice points as was the case for the ionosphere correction data. The delay volumes of the troposphere are represented through Eq. (5).
Τ𝑠𝑠𝑠𝑠𝑟𝑟= 𝑚𝑚ℎ × 𝑍𝑍𝑍𝑍𝑍𝑍 + 𝑚𝑚𝑤𝑤 × 𝑍𝑍𝑍𝑍𝑍𝑍 (5)
In Eq. (5), Τ𝑠𝑠𝑠𝑠𝑟𝑟 refers to the troposphere delay volume, 𝑚𝑚ℎ refers to the dry mapping function, 𝑚𝑚𝑤𝑤 refers to the wet mapping function, ZHD refers to the zenith path dry delay, and ZWD refers to zenith path wet delay. The mapping function was based on the Global Mapping Function (Boehm et al. 2006).
3. RESEARCH METHOD
This study validates the accuracy of the K-SSR outside of its network by applying the K-SSR extrapolations to reference stations AIRA (Japan) and CHAN (China) and comparing the accuracy results with point-positioning based on code-pseudorange measurements. Before checking the accuracy of the PPP-RTK algorithm based on code-pseudorange measurements applied with the K-SSR outside of its network, the algorithm was checked for its accuracy using the DAEJ reference station within its network. Also in order to expand the application range of the K-SSR beyond its reference station network, the K-SSR was extrapolated using multiple regression and the extrapolations were applied to PPP-RTK positioning based on code-pseudorange measurements of AIRA and CHAN.
(3)
In Eq. (3), δtsssr refers to the satellite time offset correction data; assr refers to clock bias correction data (m); bssr refers to clock drift correction data; cssr refers to clock drift rate correction data (m/s2); t refers to time of positioning; t0
refers to the correction data reference time; and c refers to the speed of light. The satellite bias correction data is based on codes of each frequency that do not require a separate computing equation and carrier wave bias correction values where the C/A code bias correction value was applied to the algorithm.
For the ionosphere correction data, the STEC of each satellite of each lattice point distanced longitudinally at 1° is provided. The STECs of four lattice points near the location of the user were interpolated and applied to the algorithm.
The Ionosphere delay volume is shown in Eq. (4).
3 (Misra & Enge 2011).
p = ρ + c(δ𝑡𝑡𝑟𝑟− 𝛿𝛿𝑡𝑡𝑠𝑠) + I + T + M + 𝑏𝑏𝑟𝑟+ 𝑏𝑏𝑠𝑠+ 𝑒𝑒 (1)
In Eq. (1), p refers to the geometric range between the receiver and satellite; c refers to the speed of light; δ𝑡𝑡𝑟𝑟 refers to the receiver time offset; 𝛿𝛿𝑡𝑡𝑠𝑠 refers to the satellite time offset; I refers to the ionosphere induced error; T refers to the troposphere induced error; M refers to the multi-path error; 𝑏𝑏𝑟𝑟 refers to receiver bias; 𝑏𝑏𝑠𝑠 refers to satellite bias; and 𝑒𝑒 refers to noise interference.
The satellite orbit correction data of the K-SSR is provided via correction values for along-track, cross-track, and radial directions and is converted to Earth-Center Earth-Fixed (ECEF) values for application to the algorithm. The Satellite orbit correction data equation is represented in Eq. (2).
Χ𝑐𝑐= Χ𝑏𝑏− Χ𝑠𝑠𝑠𝑠𝑟𝑟 (2) In Eq. (2), Χ𝑐𝑐 refers to the corrected satellite coordinate, Χ𝑏𝑏 refers to the satellite coordinate computed via the broadcasted orbit, and Χ𝑠𝑠𝑠𝑠𝑟𝑟 refers to the satellite orbit correction data converted to ECEF.
The satellite time offset correction data is given by a function having three coefficients and can be computed using Eq.
(3).
δ𝑡𝑡𝑠𝑠𝑠𝑠𝑟𝑟𝑠𝑠 = 𝑎𝑎𝑠𝑠𝑠𝑠𝑟𝑟+ 𝑏𝑏𝑠𝑠𝑠𝑠𝑟𝑟(𝑡𝑡 − 𝑡𝑡0) + 𝑐𝑐𝑠𝑠𝑠𝑠𝑟𝑟(𝑡𝑡 − 𝑡𝑡0)2
𝑐𝑐 (3)
In Eq. (3), δ𝑡𝑡𝑠𝑠𝑠𝑠𝑟𝑟𝑠𝑠 refers to the satellite time offset correction data; 𝑎𝑎𝑠𝑠𝑠𝑠𝑟𝑟 refers to clock bias correction data (m); 𝑏𝑏𝑠𝑠𝑠𝑠𝑟𝑟 refers to clock drift correction data; 𝑐𝑐𝑠𝑠𝑠𝑠𝑟𝑟 refers to clock drift rate correction data (m/s2); t refers to time of positioning; 𝑡𝑡0 refers to the correction data reference time; and c refers to the speed of light. The satellite bias correction data is based on codes of each frequency that do not require a separate computing equation and carrier wave bias correction values where the C/A code bias correction value was applied to the algorithm.
For the ionosphere correction data, the STEC of each satellite of each lattice point distanced longitudinally at 1° is provided. The STECs of four lattice points near the location of the user were interpolated and applied to the algorithm. The Ionosphere delay volume is shown in Eq. (4).
Ι𝑠𝑠𝑠𝑠𝑟𝑟= 40.3
𝑓𝑓2 𝑆𝑆𝑆𝑆𝑆𝑆𝑆𝑆 (4)
In Eq. (4), Ι𝑠𝑠𝑠𝑠𝑟𝑟 refers to ionosphere delay volumes, 𝑓𝑓 refers to the frequency, and 𝑆𝑆𝑆𝑆𝑆𝑆𝑆𝑆 refers to slant total electron content. The troposphere correction data was provided from zenith path dry delay volumes and wet delay volumes of the lattice points as was the case for the ionosphere correction data. The delay volumes of the troposphere are represented through Eq. (5).
Τ𝑠𝑠𝑠𝑠𝑟𝑟= 𝑚𝑚ℎ × 𝑍𝑍𝑍𝑍𝑍𝑍 + 𝑚𝑚𝑤𝑤 × 𝑍𝑍𝑍𝑍𝑍𝑍 (5)
In Eq. (5), Τ𝑠𝑠𝑠𝑠𝑟𝑟 refers to the troposphere delay volume, 𝑚𝑚ℎ refers to the dry mapping function, 𝑚𝑚𝑤𝑤 refers to the wet mapping function, ZHD refers to the zenith path dry delay, and ZWD refers to zenith path wet delay. The mapping function was based on the Global Mapping Function (Boehm et al. 2006).
3. RESEARCH METHOD
This study validates the accuracy of the K-SSR outside of its network by applying the K-SSR extrapolations to reference stations AIRA (Japan) and CHAN (China) and comparing the accuracy results with point-positioning based on code-pseudorange measurements. Before checking the accuracy of the PPP-RTK algorithm based on code-pseudorange measurements applied with the K-SSR outside of its network, the algorithm was checked for its accuracy using the DAEJ reference station within its network. Also in order to expand the application range of the K-SSR beyond its reference station network, the K-SSR was extrapolated using multiple regression and the extrapolations were applied to PPP-RTK positioning based on code-pseudorange measurements of AIRA and CHAN.
(4)
In Eq. (4), Issr refers to ionosphere delay volumes, f refers to the frequency, and STEC refers to slant total electron content. The troposphere correction data was provided from zenith path dry delay volumes and wet delay volumes of the lattice points as was the case for the ionosphere correction data. The delay volumes of the troposphere are represented through Eq. (5).
Tssr = mh × ZHD + mw ×ZWD (5)
In Eq. (5), Tssr refers to the troposphere delay volume, mh refers to the dry mapping function, mw refers to the wet mapping function, ZHD refers to the zenith path dry delay, and ZWD refers to zenith path wet delay. The mapping function was based on the Global Mapping Function (Boehm et al. 2006).
3. RESEARCH METHOD
This study validates the accuracy of the K-SSR outside of its network by applying the K-SSR extrapolations to reference stations AIRA (Japan) and CHAN (China) and comparing the accuracy results with point-positioning based on code-pseudorange measurements. Before checking the accuracy of the PPP-RTK algorithm based
on code-pseudorange measurements applied with the K-SSR outside of its network, the algorithm was checked for its accuracy using the DAEJ reference station within its network. Also in order to expand the application range of the K-SSR beyond its reference station network, the K-SSR was extrapolated using multiple regression and the extrapolations were applied to PPP-RTK positioning based on code-pseudorange measurements of AIRA and CHAN.
3.1 Algorithm Accuracy Validation
The accuracy of the K-SSR applied algorithm was evaluated by comparing the point positioning based on code-pseudorange measurements with the horizontal root mean square (RMS). Over a period of 7 days between DOY 346~352 of 2016 during UTC 0 to 1500 hours, DAEJ point positioning and K-SSR applied positioning were performed in 30 second intervals. The point positioning used code- pseudorange measurements; the point positioning ionosphere error model used the Klobuchar model; and troposphere error model used the Saastamoinen model.
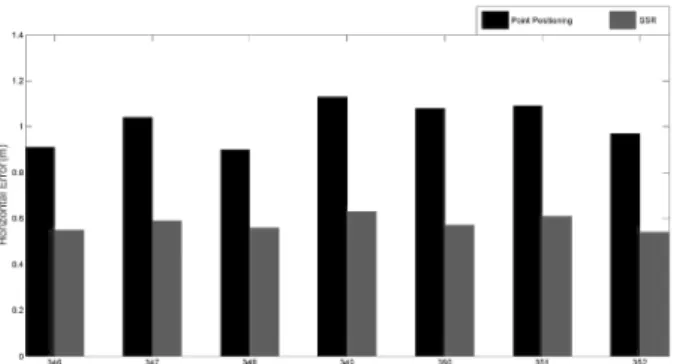
The K-SSR applied algorithm used all correction data provided by the K-SSR. The coordinates computed from each positioning were compared with the precision coordinates of the DAEJ reference station to calculate the horizontal RMS error. Fig. 4 represents the 7-day south- north direction and east-west direction positioning error and Fig. 5 represents the results in a bar graph.
Fig 4 shows a 0.34m bias to the East and 0.54 m bias to the West for point positioning and a 0.37 m bias to the west and 0.13 m bias to the north for the SSR applied positioning.
The SSR applied positioning from the DAEJ had largely Fig. 4. Horizontal error at DAEJ.
Woong-Jun Yoon et al. Code-based PPP-RTK Outside the Network 83
http://www.ipnt.or.kr reduced north-south directional biases compared with
point positioning and showed improved precision. Fig. 5 shows that the 7-day horizontal RMS error average of the DAEJ point positioning was 1.01 m with the smallest error occurring in DOY 348 at 0.90 m and the largest error occurring in DOY 349 at 1.13 m. The horizontal RMS error average of the K-SSR applied algorithm was 0.57 m with the smallest error occurring in DOY 352 at 0.54 m and the largest error occurring in DOY 349 at 0.63 m. Fig. 5 shows that the K-SSR applied algorithm had 30~45% greater accuracy compared with point positioning and had a 7-day horizontal RMS error range between 0.09 m to 0.23 m, which was less than point positioning, indicating that the algorithm produced stable sub-meter performance levels.
3.2 Correction Data Extrapolation
Satellite-related correction data, which is less influenced by user location, can be applied outside of the reference station network. However, the correction data accounting for errors due to the ionosphere and troposphere change according to user location, which makes its application outside the reference station network difficult. In order to check the accuracy of the K-SSR applied outside of its network, ionosphere and troposphere correction data provided in a lattice form having longitudinal and latitudinal distances of 1° were extrapolated and used to estimate the correction values used for positioning outside of the reference station network.
The extrapolation was done using multiple regression and is represented in Eq. (6).
4 3.1 Algorithm Accuracy Validation
The accuracy of the K-SSR applied algorithm was evaluated by comparing the point positioning based on code- pseudorange measurements with the horizontal root mean square (RMS). Over a period of 7 days between DOY 346~352 of 2016 during UTC 0 to 1500 hours, DAEJ point positioning and K-SSR applied positioning were performed in 30 second intervals. The point positioning used code-pseudorange measurements; the point positioning ionosphere error model used the Klobuchar model; and troposphere error model used the Saastamoinen model. The K-SSR applied algorithm used all correction data provided by the K-SSR. The coordinates computed from each positioning were compared with the precision coordinates of the DAEJ reference station to calculate the horizontal RMS error. Fig. 4 represents the 7-day south-north direction and east-west direction positioning error and Fig. 5 represents the results in a bar graph.
Fig 4 shows a 0.34m bias to the East and 0.54 m bias to the West for point positioning and a 0.37 m bias to the west and 0.13 m bias to the north for the SSR applied positioning. The SSR applied positioning from the DAEJ had largely reduced north-south directional biases compared with point positioning and showed improved precision. Fig. 5 shows that the 7-day horizontal RMS error average of the DAEJ point positioning was 1.01 m with the smallest error occurring in DOY 348 at 0.90 m and the largest error occurring in DOY 349 at 1.13 m. The horizontal RMS error average of the K-SSR applied algorithm was 0.57 m with the smallest error occurring in DOY 352 at 0.54 m and the largest error occurring in DOY 349 at 0.63 m. Fig. 5 shows that the K-SSR applied algorithm had 30~45% greater accuracy compared with point positioning and had a 7-day horizontal RMS error range between 0.09 m to 0.23 m, which was less than point positioning, indicating that the algorithm produced stable sub-meter performance levels.
3.2 Correction Data Extrapolation
Satellite-related correction data, which is less influenced by user location, can be applied outside of the reference station network. However, the correction data accounting for errors due to the ionosphere and troposphere change according to user location, which makes its application outside the reference station network difficult. In order to check the accuracy of the K-SSR applied outside of its network, ionosphere and troposphere correction data provided in a lattice form having longitudinal and latitudinal distances of 1° were extrapolated and used to estimate the correction values used for positioning outside of the reference station network.
The extrapolation was done using multiple regression and is represented in Eq. (6).
𝐸𝐸𝑖𝑖𝑖𝑖𝑖𝑖𝑖𝑖/𝑡𝑡𝑡𝑡𝑖𝑖𝑡𝑡= ∑ ∑ 𝐸𝐸𝑖𝑖𝑛𝑛 1 𝑛𝑛=0 2 𝑖𝑖=0
(𝜙𝜙𝑡𝑡− 𝜙𝜙0)𝑖𝑖(𝜆𝜆𝑡𝑡− 𝜆𝜆0)𝑛𝑛 (6)
In Eq. (6) 𝐸𝐸𝑖𝑖𝑖𝑖𝑖𝑖𝑖𝑖/𝑡𝑡𝑡𝑡𝑖𝑖𝑡𝑡 refers to the ionosphere and troposphere correction values estimated according to the longitudinal and latitudinal location of the user; 𝐸𝐸𝑖𝑖𝑛𝑛 refers to the coefficient matrix; and 𝜙𝜙𝑡𝑡 and 𝜆𝜆𝑡𝑡 refer to the latitude and longitude of the user location, respectively. The latitude and longitude used as the standard in this study and represented as 𝜙𝜙0 and 𝜆𝜆0 were 36° for the latitude and 128° for the longitude. The coefficient matrix was calculated using the method of least squares of the domestic lattice point correction values.
4. COMPARISON OF POSITIONING PERFORMANCE
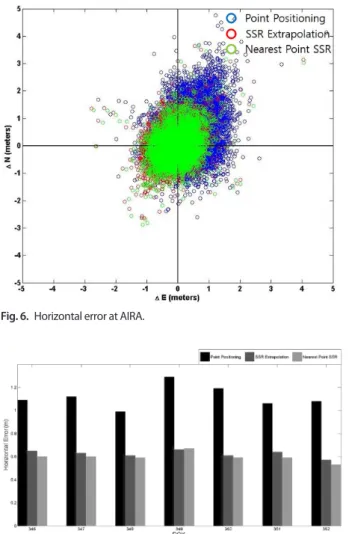
After applying the extrapolated ionosphere and troposphere correction data to the algorithm, positioning was undertaken using the AIRA and CHAN data. As represented in Fig. 3, AIRA is located at a latitude of 31.8238° and a longitude of 130.5994° and has a baseline distance of 260 km with the closest lattice point B (latitude 34° and longitude 130°) of the K-SSR network. CHAN is located at a latitude of 43.7902° and a longitude of 125.4430° and has a baseline distance of 650 km with the closest lattice point A (latitude 38° and longitude 126°) of the K-SSR network. A total of 15 hours of data at 30 second intervals between UTC 0~15 hours and DOY 346~352 was used as the positioning data. Point positioning and extrapolated K-SSR applied positioning were each performed while an additional positioning that utilized nearest domestic lattice point correction information was undertaken. This was to measure the accuracy of the PPP-RTK based on code-pseudorange measurements outside of the network but also to compare the accuracy of the different correction data application methods. The results were each named ‘Point Positioning’, ‘SSR Extrapolation’, and ‘Nearest Point SSR’. Fig. 6 shows the horizontal RMS error of AIRA in the south-north direction and east-west direction; Fig. 7 shows the positioning results of AIRA using a bar graph; and Figs. 8 and 9 show the positioning results of CHAN using the same methods.
(6)
In Eq. (6) Eiono/trop refers to the ionosphere and troposphere correction values estimated according to the longitudinal
and latitudinal location of the user; Enm refers to the coefficient matrix; and ϕr and λr refer to the latitude and longitude of the user location, respectively. The latitude and longitude used as the standard in this study and represented as ϕ0 and λ0 were 36° for the latitude and 128°
for the longitude. The coefficient matrix was calculated using the method of least squares of the domestic lattice point correction values.
4. COMPARISON OF POSITIONING PERFORMANCE
After applying the extrapolated ionosphere and troposphere correction data to the algorithm, positioning was undertaken using the AIRA and CHAN data. As represented in Fig. 3, AIRA is located at a latitude of 31.8238° and a longitude of 130.5994° and has a baseline distance of 260 km with the closest lattice point B (latitude 34° and longitude 130°) of the K-SSR network. CHAN is located at a latitude of 43.7902° and a longitude of 125.4430°
and has a baseline distance of 650 km with the closest lattice point A (latitude 38° and longitude 126°) of the K-SSR network. A total of 15 hours of data at 30 second intervals between UTC 0~15 hours and DOY 346~352 was used as the positioning data. Point positioning and extrapolated K-SSR applied positioning were each performed while an additional positioning that utilized nearest domestic lattice point correction information was undertaken. This was to measure the accuracy of the PPP-RTK based on code- pseudorange measurements outside of the network but also to compare the accuracy of the different correction data application methods. The results were each named ‘Point Positioning’, ‘SSR Extrapolation’, and ‘Nearest Point SSR’.
Fig. 6 shows the horizontal RMS error of AIRA in the south- north direction and east-west direction; Fig. 7 shows the positioning results of AIRA using a bar graph; and Figs. 8 and 9 show the positioning results of CHAN using the same methods.
Fig. 6 shows that the point positioning bias of AIRA was 0.41 m to the east and 0.42 m to the north whereas the extrapolated K-SSR applied positioning bias was 0.16 m to the west and 0.02 m to the north. The positioning bias of the nearest lattice point correction data applied positioning was 0.07 m to the west and 0.05m to the north.
The positioning from AIRA and the positioning applied with K-SSR both were found to have reduced bias compared with point positioning and the extrapolated K-SSR applied positioning had less south-north bias but greater east-west bias compared with the nearest lattice point correction Fig. 5. Positioning result using K-SSR at DAEJ.
https://doi.org/10.11003/JPNT.2017.6.2.79
information applied positioning. The point positioning horizontal RMS error average shown in Fig. 7 was found to be 1.11m with the smallest error occurring on DOY 348 at 0.99 m and the largest error occurring at DOY 349 at 1.19 m.
The horizontal RMS error average of the extrapolated K-SSR applied positioning was found to be 0.62 m with the smallest error occurring on DOY 352 at 0.57 m and the largest error occurring in DOY 349 at 0.66 m. The 7-day positioning results show an improvement in accuracy of 35~50%. The horizontal RMS error average of the nearest lattice point correction information applied positioning was found to be 0.59 m which was within 5 cm of the 7-day horizontal RMS error average of the extrapolated K-SSR applied positioning.
Fig. 8 shows a point positioning bias of CHAN at 0.87 m to the east and 0.32 m to the north whereas the positioning bias of the extrapolated K-SSR applied positioning was found to be 0.26 m to the east and 0.10 m to the south. The nearest lattice point correction data applied positioning showed bias at 0.26 m to the east and 0.1 m to the north. In the case of CHAN and AIRA both methods also showed reductions
in bias. Fig. 9 shows that the point positioning of the horizontal RMS error average was 1.31 m with the smallest error occurring on DOY 349 at 1.21 m and the largest error occurring at DOY 352 at 1.39 m. The horizontal RMS error average of the extrapolated K-SSR applied positioning was found to be 0.86m with the smallest error occurring on DOY 347 at 0.80 m and the largest error occurring on DOY 349 at 1.00 m, showing a 20~40% improvement in accuracy compared with point positioning. The horizontal RMS error average of the nearest lattice point correction data applied positioning was found to be 0.75 m, which was a 30~50%
improvement in accuracy compared with point positioning and also a 10~20% improvement in accuracy compared with extrapolated K-SSR applied positioning.
Positioning applying the extrapolated K-SSR outside of the network was found to be relatively more accurate in AIRA, which had a shorter baseline distance, compared with CHAN. The multiple regression method used for extrapolation uses the correction data found within a reference station and estimates the outside network
Fig. 6. Horizontal error at AIRA. Fig. 8. Horizontal error at CHAN.
Fig. 7. Positioning result using K-SSR at AIRA. Fig. 9. Positioning result using K-SSR at CHAN.
Woong-Jun Yoon et al. Code-based PPP-RTK Outside the Network 85
correction value using quadratic equations, which results in the accumulation of estimation errors as the baseline distance becomes greater. Because of this, CHAN, having a longer baseline, has larger ionosphere and troposphere correction value estimation errors resulting in less accuracy compared with AIRA. Positioning that applied the nearest lattice point correction data was found to be more accurate than the extrapolated K-SSR applied positioning where even at a baseline distance of 650 km the accuracy was within 0.80 m. Application of the extrapolated SSR to positioning outside of the reference station network resulted in improvements in accuracy of 20~50%. However, considering that the positioning applied with the nearest lattice point correction data had the highest levels of accuracy, the effects of the extrapolation were considered to be small.
5. CONCLUSION
This study validated the accuracy of the K-SSR applied PPP-RTK algorithm based on code-pseudorange measurements outside of the network, by analyzing its positioning accuracy from the CHAN (China) and AIRA (Japan) reference stations. Before applying the algorithm to the outside network, positioning accuracy was checked domestically by undertaking positioning for 7 days using the Daejeon reference station. The results confirmed that the accuracy was improved by 45% compared with point positioning. In order to check the accuracy of the algorithm outside of the network, K-SSR correction data provided domestically in intervals of 1° longitude and latitude that account for errors due to the ionosphere and troposphere was extrapolated; its range of application was expanded to outside of the network to compare the accuracy between point positioning from AIRA (Japan) and CHAN (China), positioning using the algorithm that applied the extrapolated K-SSR, and positioning applied with nearest lattice point correction data. In the case of AIRA (Japan), use of the algorithm applied with the extrapolated K-SSR resulted in improvements in accuracy between 35~50%
compared with point positioning and resulted in similar improvements compared with positioning using nearest lattice point correction data. In the case of CHAN (China), use of the algorithm applied with the extrapolated K-SSR resulted in improvements in accuracy between 20~40%
compared with point positioning whereas use of the algorithm applied with nearest lattice point correction data was found to result in greater accuracy between 30~50%. The difference in accuracy found in the CHAN reference station between the positioning applied with
the extrapolated K-SSR and the positioning applied with nearest lattice point correction data was considered to have occurred due to an accumulation of errors in the extrapolated correction data as the baseline distance became greater.
This study confirmed improvements in positioning accuracy by 20~50% when applying K-SSR outside of the network. However greater baseline distances resulted in reduced accuracy of the extrapolated K-SSR applied positioning compared to nearest lattice point correction data applied positioning. This is considered to be the case due to the fact that the correction data extrapolation equation does not account for changes in distance, which results in accumulation of error. Further studies that account for estimation errors due to greater distances and studies to determine the scope of application of the K-SSR outside of its network are considered to be needed.
ACKNOWLEDGMENTS
This work has been supported by the National GNSS Research Center program of Defense Acquisition Program Administration and Agency for Defense Development.
REFERENCES
Boehm, J., Niell, A., Tregoning, P., & Schuh, H. 2006, Global mapping function (GMF): A new empirical mapping function based on numerical weather model data, GRL, 33, L07304. http://doi.org/10.1029/2005GL025546 Kim, M.-S. 2016, Development of PPP Algorithms based on
GPS Code Pseudoranges by Applying Real-Time SSR Corrections, M.S Dissertation, Inha University
Misra, P. & Enge, P. 2011, Global positioning system: Signals, measurements, and performance, 2nd ed. (Lincoln, MA: Ganga-Jamuna Press)
Vollath, U., Buecherl, A., Landau, H., Pagels, C., & Wagner, B. 2000, Multi-Base RTK Positioning Using Virtual Reference Stations, in Proceedings of ION GPS 2000, Salt Lake City, UT, pp.123-131
Won, J.-H. 2015, Development of PPP-RTK Algorithms for Moving Platforms Using Combined GPS/GLONASS Measurements, PhD Dissertation, Inha University Wubbena, G. 2012, RTCM State Space Representation (SSR)
Overall Concepts towards PPP-RTK, in Presented at the PPP-RTK & Open Standards Symposium, Frankfurt, Germany, 12-13 March 2012
Wubbena G., Schmitz, M., & Bagge, A. 2005, PPP-RTK: Precise
https://doi.org/10.11003/JPNT.2017.6.2.79
Point Positioning Using State-Space Representation in RTK Networks, in Proceedings of ION GNSS 2005, Long Beach, CA, pp.2584-2594
Woong-Jun Yoon received B.S. degrees in geoinformatic engineering from Inha University, Korea. He is currently working towards M.S. degree on geoinformatic engineering at the same university. His research interests include ionosphere analysis and PPP-RTK algorithm development.
Kwan-Dong Park received his Ph. D. degree f ro m t h e D e p a r t m e nt o f Ae ro s p a c e Engineering and Engineering Mechanics at the University of Texas at Austin, and he is currently at Inha University as a professor.
His research interests include DGNSS/PPP- RTK algorithm development and GNSS geodesy.
Hye-In Kim received her Ph. D. degree from the Geoinformatic Engineering at the Inha University, and she is currently working at Research Institute of PPSoln Inc. Her research interests include DGNSS/PPP-RTK algorithm development.
Seung Woo Seo is a senior researcher of Agency for Defense Development in Korea, Republic of. He received B.S. and M.S degree in electrical engineering at Korea University. His research interests include time synchronization system and GNSS augment system.
Junpyo Park received B.S. and M.S. degree in mechanical engineering at Pusan National Univ. and Ph.D. degree in aerospace engineering at Chung-nam National Univ. He is a principal researcher in the Agency for Defense Development, Korea. His research interests include integrity monitoring of GNSS signal, pseudolites, and GNSS-related engineering problems.