1. Introduction
Chalcopyrite Cu(In,Ga)Se
2(α-CIGS) and related films are gaining considerable interest for photovoltaic devices since their high optical absorption coefficient and adjustable band gap can enable to achieve a high conversion efficiency in α-CIGS solar cells. Technical advances in α-CIGS solar cells involving the co-evaporation of Cu, In, Ga, and Se elements through a three-stage process have reached the highest efficiency of over 20% in thin film solar cells
1).
According to Shockley-Queisser (SQ) limit, the estimated limiting efficiency for AM 1.5 solar radiation is highest with 31% at the band gap of 1.34 eV
2). The adjustment of band gap in CIGS phase can be done by adding more Ga. However, the solar cells with α-CIGS film show the highest efficiency with a relatively narrow band gap energy of 1.2 eV, which is below the optimum value of 1.34 eV. As the band gap of absorber materials increases, the open circuit voltage of cells deviates from being expected, resulting in the lower efficiency from theoretical values
3). It is known that the grain size became too small with too much Ga, causing poor performance.
From the band gap point of view, CuIn
3Se
5(β-CIGS) phase is a candidate for top cell absorber because the phase shows larger band gap (1.23 eV) than CuInSe
2(E
g=0.9 eV)
4). The CuIn
3Se
5phase contains more In than Cu, resulting in the increase of band gap because of stronger In-Se bonding than Cu-Se bonding. In β-CIGS, a small amount of Ga is necessary to find the band gap of 1.35 eV, suggesting that the morphology issue with small grains can be eliminated.
The β-CIGS phase is often found on the surface of α-CIGS film because of excess supply of In, Ga and Se during the three-stage co-evaporation process. The existence of this phase greatly enhances the device performance of CuInSe
2solar cell
5). It is believed that CuInSe
2phase on the CIGS surface can reduce the conduction band offset at the CdS/CIGS interface
6). Y.M Shin found that an intrinsic β-CIGS layer on surface plays a key role to improve cell performance by suppressing the hole injection from p-CIGS to CdS/CIGS interface due to the increase of valence band barrier
7).
Even though there were a few early work reported, the β -CIGS film has not been well characterized yet
8). It is worthwhile to revisit the film to improve the cell efficiency with β-CIGS film that can satisfy the highest efficiency from the SQ limit. It is seen that Se flux is very critical to the cell efficiency in the α -CIGS solar cells
9). In this research, β-CIGS films were prepared by three-stage co-evaporation process and the Se flux
Effect of Se Flux and Se Treatment on the Photovoltaic Performance of β–CIGS Solar Cells
Ji Hye Kim ․ Eun Seok Cha ․ Byong Guk Park ․ Byung Tae Ahn*
Dept. of Materials Science and Engineering, Korea Advanced Institute of Science and Technology, 291 Daehak-ro, Yuseong-gu, Daejeon 34141, Korea
ABSTRACT: Cu(In,Ga)
3Se
5( β-CIGS) has a band gap of 1.35 eV which is an optimum value for high solar-energy conversion efficiency.
However, β-CIGS film was not well characterized yet due to lower efficiency compared to Cu(In,Ga)Se
2(α-CIGS). In this work, β-CIGS films were fabricated by a three-stage co-evaporation of elemental sources with various Se fluxes. As the Se flux increased, the crystallinity of β-CIGS phase was improved from the analysis of Raman spectroscopy and a deep-level defect was reduced from the analysis of photoluminescence spectroscopy. A Se treatment of the β-CIGS film at 200°C increased Ga content and decreased Cu content at the surface of the film. With the Se treatment at 200°C, the cell efficiency was greatly improved for the CIGS films prepared with low Se flux due to the increase of short-circuit current and fill factor. It was found that the main reason of performance improvement was lower Cu content at the surface instead of higher Ga content.
Key words: CIGS solar cells, Cu(In,Ga)
3Se
5, β-CIGS, Deep-level defect, Surface modification
*Corresponding author: [email protected]
Received June 8, 2015; Revised June 10, 2015;
Accepted June 11, 2015
ⓒ 2015 by Korea Photovoltaic Society
This is an Open Access article distributed under the terms of the Creative Commons Attribution Non-Commercial License (http://creativecommons.org/licenses/by-nc/3.0)
which permits unrestricted non-commercial use, distribution, and reproduction in any medium, provided the original work is properly cited.
39
at 550°C in 5 min. At this stage, a CIGS film was formed in situ by interaction of the (In,Ga)
2Se
3film and the evaporated Cu and Se. In the third stage, In, Cu, and Se sources were co-evaporated on the CIGS films. The overall composition was controlled by adjusting the deposition time and evaporation rates. The details of CIGS fabrication with various Cu concentrations can be found in the literature
10). The thickness of the film was about 2 μm.
The CIGS films were characterized using x-ray diffraction (XRD), Raman spectroscopy, Auger electron spectroscopy (AES), and scanning electron microscopy (SEM). UV-spectroscopy measurements were performed to verify optical transmittance of films deposited in glass substrates. Defects in CIGS film were analyzed by photoluminescence (PL) at 10K.
Solar cells with ZnO/CdS/β-CIGS structure were fabricated on a Mo-coated soda-lime glass substrate. The Mo back contact layer with a thickness of 1 μm was deposited by dc magnetron sputtering. The CdS buffer layer with a thickness of 50 nm was deposited by chemical bath deposition. The ZnO window layer was deposited by rf magnetron sputtering and The ZnO layer consisted of 50-nm thick intrinsic ZnO and 400-nm thick Al-doped ZnO. The photovoltaic properties of solar cells were assessed at AM1.5, 100 mW/cm
2illumination.
3. Results
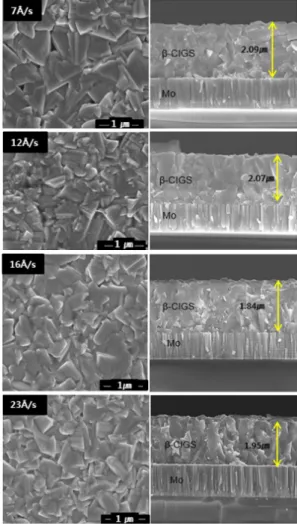
3.1 Film characterization with various Se fluxes Fig. 1 shows the plane and cross-sectional SEM images of β–
CIGS films with the Se fluxes of 7, 12, 16, and 25 Å/s in a three-stage co-evaporation process. For 7 Å/s Se flux, the shape of grains on the surface is triangle with grain size of 0.5 to 1 μm.
However, big pores are seen between grains. For 12 Å/s Se flux, the surface grains became smaller and more densely packed. For 16 and 23 Å/s, grain size increase again with more rectangular shape.
Fig. 2 shows the XRD patterns of β–CIGS films with various Se fluxes in a three-stage co-evaporation process. For low Se flux (4 Å/s), (112) orientation is clearly dominant, while the intensity of (112) plane is similar to that of (220/(204) plane for the Se flux of 7, 12, and 16 Å/s. As the Se flux increased, the intensity of (220)/(204) orientation tended to increase slowly.
For Se flux of 25 Å/s, (220)/(204) orientation is clearly dominant. In the surface morphology with the Se flux of 7 Å/s seen in Fig. 1, the morphology with triangle shaped-grains indicated the (112) orientation is dominant. Above 12 Å/s, the triangle-shaped grains disappeared due to the dominance of (200)/(204) orientation.
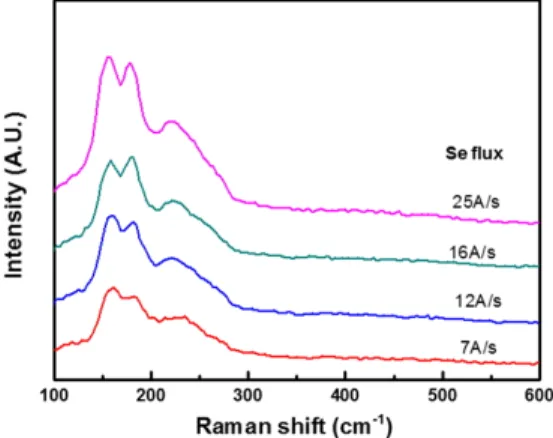
Fig. 3 shows the Raman spectra of Cu(In
0.6Ga
0.4)
3Se
5films with various Se fluxes in the three-stage co-evaporation process. The overall shape of the Raman spectra was similar.
However, the intensity of the Raman peaks gradually increased with the increase of the Se flux. Note that the peaks were much stronger for the Se flux of 25 Å/s. In overall, the crystallinity was
Fig. 1. SEM images of Cu(In0.6Ga0.4)3Se5 films with various Sefluxes in the three-stage co-evaporation process
improved as the Se flux increased.
Fig. 4 shows the AES depth profile of Cu(In
0.6Ga
0.4)
3Se
5films with various Se fluxes in the three-stage co-evaporation process. The V shape of In concentration is seen for low Se flux.
And the V shape became more flat as the Se flux increased. For low Se flux the In/Ga ratio is high at the surface and the ratio decreased as the Se flux increased.
Fig. 5 shows the PL emission spectra (a) of Cu(In
0.6Ga
0.4)
3Se
5films with various Se fluxes in the three-stage co-evaporation process and the schematics of possible recombination in the band gap (b). However, the exact understanding of the PL peaks in the β–CIGS is not well understood yet.
The four peaks are observed in the PL spectra. From our experimental conditions with possible defects including Cu vacancy (V
Cu), Se vacancy (V
Se), In-in-Cu antisite (In
Cu), Ga-in-Cu antisite (Ga
Cu) and Cu interstitial (Cu
i). The four peaks might be identified as follows. #1 corresponds to electron transition from Cu
ito V
Cu. #2 corresponds to the electron transition from V
Seto V
Cu. #3 and #4 peaks correspond to the electron transition from
In
Cuto valence band and V
Cu, respectively. Note that above 16 Å/s Se flux, the pea k #3 and #4 disappeared. With high Se flux, the #3 and #4 peaks disappeared. This suggests that the In
Cuantisite defects were eliminated at high Se flux.
Fig. 2. XRD patterns of Cu(In0.6Ga0.4)3Se5 films with various Se fluxes in the three-stage co-evaporation process
Fig. 3. Raman spectra of Cu(In0.6Ga0.4)3Se5 films with various Se fluxes in the three-stage co-evaporation process
Fig. 4. AES depth profile of Cu(In0.6Ga0.4)3Se5 films with various Se fluxes in the three-stage co-evaporation process
It has been known that high efficiency was obtained at higher Se flux in α–CIGS solar cells. We have seen here the same result in β–CIGS solar cells. We think that strong chemical bonding between In and Se attracts In to be seated to In lattice site instead of Cu site. However, too much Se supply made a rough surface on α–CIGS solar cells
10). There might be also an optimum Se flux for β-CIGS solar cell like α–CIGS solar cells.
3.2 Device performance with various Se fluxes Fig. 6 shows the Illuminated J-V curve (a0 and QE curve (b) of solar cells fabricated using the Cu(In
0.6Ga
0.4)
3Se
5films with various Se fluxes in a three-stage co-evaporation process.
The photovoltaic parameters such as cell conversion efficiency (η), open-circuit voltage (V
oc), short-circuit current (J
sc), fill factor (FF), shunt resistance (R
sh), series resistance (R
s), and diode ideality factor (A) were summarized in Table 1. The highest efficiency was obtained at the Se flux of 16 Å/s. Especially, the J
scof the β-CIGS solar cell was highest at the flux of 16 Å/s.
Fig. 7 shows the 1/C
2-V curves of solar cells fabricated using the Cu(In
0.6Ga
0.4)
3Se
5films with various Se fluxes in the three- stage co-evaporation process. The carrier concentration was in the range of 9.4∼10.1×10
15/ cm
3with an average value of 9.8×10
15/cm
3. It is considered that the bulk doping concentration is similar each other. The doping concentration near junction
(a)
(b)
Fig. 5. PL emission spectra of Cu(In0.6Ga0.4)3Se5 films with various Se fluxes in the three-stage co-evaporation process
(a)
(b)
Fig. 6. Illuminated J-V curve (a) and QE curve (b) of solar cells fabricated using the Cu(In0.6Ga0.4)3Se5 films with various Se fluxes in the three-stage co-evaporation process
Fig. 7. 1/C2-V curves of solar cells fabricated using the Cu(In0.6Ga0.4)3Se5 films with various Se fluxes in the three-stage co-evaporation process
Table 1. PV parameters of β-CIGS solar cells with various Se fluxes
Se flux
(Å/s) η
(%) Voc
(V) Jsc
(mA/cm2) FF (%)
7 6.23 0.575 20.08 54.02
12 9.1 0.638 22.00 64.89
16 10.3 0.636 24.81 65.32
25 9.2 0.619 21.83 68.09
region was not affected by the Se flux change.
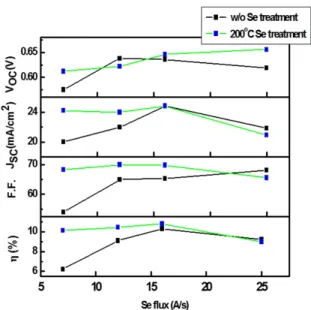
3.3 Effect of Se treatment of β-CIGS film
The β–CIGS film fabricated with the Se flux of 16 Å/s was treated at 200°C for 15 min in a Se environment. Our previous experiment showed that the Se treatment reduced Cu content and increased Ga content at the surface, resulting in a higher cell efficiency
7).
Fig. 8 shows the V
oc, J
sc, FF, and η of β–CIGS solar cells fabricated using the Cu(In
0.6Ga
0.4)
3Se
5films, before and after Se treatment at 200°C in a Se environment.
After the Se treatment of β–CIGS film, the efficiency was improved from 6 to above 10% in the low Se flux region (7∼16 Å/s), while the efficiency was not changed at the flux of 25 Å/s.
At the Se flux of 16 Å/s, the efficiency was improved 10.3 to 10.9% by the Se treatment. The reason of the efficiency increase was due to the improvement of J
scand FF. The main improvement was due the increase of FF from 0.65 to 0.70. The efficiency improvement in β–CIGS solar cell was not as big as that in α -CIGS solar cell even though large improvement was seen in the low Se flux region.
Fig. 9 shows the XPS spectra of Cu 2p, In 3d, Ga 2p, and Se 3d at the surface of the Cu(In
0.6Ga
0.4)
3Se
5film that was deposited with the Se flux of 16 Å/s, before and after Se treatment at 200°C in a Se environment.
As seen in the figures, the intensities of In, Ga and Se increased after the Se treatment, while that of Cu decreased. The
Fig. 8. Photovoltaic properties of β-CIGS solar cell fabricated using the Cu(In0.6Ga0.4)3Se5 films treated at 200°C in Se environment
Fig. 9. XPS spectra of the surface of the Cu(In0.6Ga0.4)3Se5 films treated at 200°C in Se environment
Ga/(In+Ga) ratio increased from 0.27 to 0.32 and the Cu/
(In+Ga) ratio decreased from 0.12 to 0.05. As a result, the Cu content was much lowered than that of β-phase composition.
The Ga/(In+Ga) ratio increased with the Se treatment at 200°C.
This is consistent with our previous result in Cu(In,Ga)Se
2films
7). With the increase of Ga, the band gap at the surface can be modified. Also note that the binding energies of In and Ga shifted to higher energy, suggesting that the surface became more stable state.
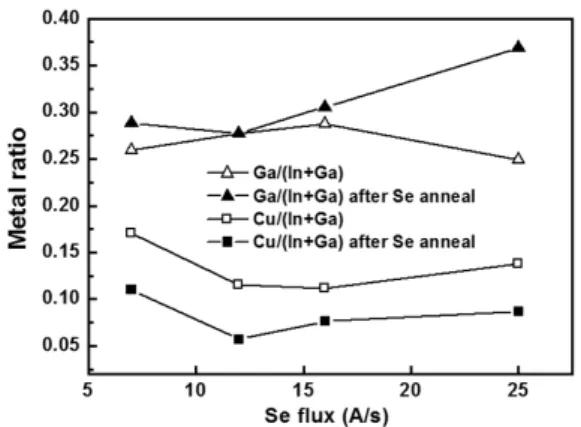
Fig. 10 shows the Cu/(In+Ga) ratio and Ga/(Ga+In) ratio at the surface of CIGS film before and after 200°C heat treatment in Se atmosphere.
After the Se treatment at 200°C, the Cu content at the surface decreased and the Ga content at the surface increased. Note that the large increase of the efficiency in low Se flux region is due to the reduction of Cu content. The large increase of Ga at the Se flux of 25 Å/s does not affected the cell efficiency. Therefore the reduction of Cu content is the key to improve the cell efficiency.
4. Conclusions
Cu(In,Ga)
3Se
5(β-CIGS) has a band gap of 1.35 eV which is an optimum value for high solar-energy conversion efficiency.
We fabricated β-CIGS solar cell with a three-stage co-evaporation process. The Se flux was varied for the experiment.
As the Se flux increased, the crystallinity of β-CIGS phase was improved from the analysis of Raman spectroscopy and an antisite deep-level defect was reduced from the analysis of photoluminescence spectroscopy. The efficiency was highest at the Se flux of 16 Å/s.
This work was supported by the Center for Inorganic Photovoltaic Materials (2014-001796) funded by the Korean Ministry of Science and Technology.
References
1. P. Jackson, D. Hariskos, E. Lotter, S. Paetel, R. Wuerz, R.
Menner, W. Wischmann, M. Powalla, “New world record effi- ciency for Cu(In,Ga)Se2 thin-film solar cells beyond 20%”, Prog. Photovolt: Res. Appl., 19, 894–897, 2011.
2. L. Yu and A. Zunger, Phys. Rev. Lett., 108, 068701, 2012.
3. M. Gloeckler, J. R. Sites, “Efficiency limitations for wide- band-gap chalcopyrite solar cells”, Thin Solid Films, 480-481, 241-245, 2005.
4. T. Negami, N. Kohara, M. Nishitani, T. Wada, “Preparation of ordered vacancy chalcopyrite-type CuIn3Se5 thin films”, Jpn. J.
Appl. Phys., 33, L1251 - L1253, 1994.
5. D. Y. Lee, J. J. Yun, K. H. Yoon, B. T. Ahn, “Characterization of Cu-poor surface on Cu-rich CuInSe2 film prepared by evapo- rating binary selenide compounds and its effect on solar effi- ciency”, Thin Solid Films, 410, 171-176, 2002.
6. L. Larina, D. Shin, J. H. Kim, B. T. Ahn, Energy Environ. Sci.,
“Alignment of energy levels at the ZnS/Cu(In,Ga)Se2 inter- face” 4, pp 3487-3493, 2011.
7. Y. M. Shin, C. S. Lee, D. H. Shin, H. S. Kwon, B. G. Park, B.
T. Ahn, “Surface modification of CIGS film by annealing and its effect on the band structure and photovoltaic properties of CIGS solar cells”, Curr. Appl. Phys. 15, 18-24 (2015).
8. T. Nakada, T. Mouri, Y. Okano, A. Kunioka, “Cu(In,Ga)3Se5- based thin film solar cells fabricated by a Na control technique”, 14th EU-PVSEC, pp. 2143, 1997.
9. K. H. Kim, K. H. Yoon, J. H. Yun, and B. T. Ahn, ‘Effects of Se flux on the microstructure of Cu(In,Ga)Se2 film deposited by a three-stage co-evaporation process’, Electrochem. Solid-State Lett., 9, A382-A385 (2006).
10. J. H. Kim, Y. M. Shin, S. T. Kim, B. T. Ahn, “Fabrication of wide-bandgap β-Cu(In,Ga)3Se5 thin films and their application to solar cells”, Current Photovoltaic Research, 1, 38 (2013).
Fig. 10. Change of Ga/(In+Ga) and Cu/(In+Ga) ratios on the surface of the Cu(In0.6Ga0.4)3Se5 films treated at 200°C in Se environment