INTRODUCTION
Erectile dysfunction (ED) has been an important cause of decreased quality of life in men [1]. In addi- tion, ED has been reported to be strongly associated
with a quadrupling of the prevalence of treated heart disease, a tripling of diabetes mellitus (DM) risk, and a doubling in chronic disease prevalence in smokers [2].
Therefore, ED is thought to be an important disease that not only deteriorates the quality of life [1], but is
Received: Jun 24, 2018 Revised: Sep 15, 2018 Accepted: Sep 17, 2018 Published online Dec 5, 2018 Correspondence to: Hwancheol Son https://orcid.org/0000-0001-5033-0153
Department of Urology, SMG-SNU Boramae Medical Center, 20 Boramae-ro 5-gil, Dongjak-gu, Seoul 07061, Korea.
Tel: +82-2-870-2391, Fax: +82-2-870-3863, E-mail: [email protected] Copyright © 2019 Korean Society for Sexual Medicine and Andrology
pISSN: 2287-4208 / eISSN: 2287-4690 World J Mens Health 2019 May 37(2): 199-209 https://doi.org/10.5534/wjmh.180054
Changes in the Prevalence and Risk Factors of
Erectile Dysfunction during a Decade: The Korean Internet Sexuality Survey (KISS), a 10-Year-Interval Web-Based Survey
Won Hoon Song1 , Juhyun Park1,2 , Sangjun Yoo2 , Sohee Oh3 , Sung Yong Cho2 , Min Chul Cho2 , Hyeon Jeong1,2 , Hwancheol Son1,2
1Department of Urology, Seoul National University College of Medicine, Departments of 2Urology and 3Biostatistics, SMG-SNU Boramae Medical Center, Seoul, Korea
Purpose: Although the prevalence of erectile dysfunction (ED) can be affected by social changes, this association has not been well evaluated. We aimed to evaluate the prevalence and risk factors of ED through a 10-year-interval web-based sur- vey using the previous database of same group of panels, with same methodology.
Materials and Methods: We sent e-mails and surveyed the panels registered in the Internet survey agency.
Results: In total, 900 participants were recruited in 2016. The age-adjusted overall prevalences of self-reported ED (self-ED) and International Index of Erectile Function-5-assessed ED (IIEF-5-ED; score ≤21) in the 2016 study were 3.2% and 44.8%, respectively, which were lower than the prevalences of 8.1% (p=0.036) and 51.4% (p=0.323), respectively, in the 2006 study. The risk factors of IIEF-5-ED in their 20s and 30s in 2016 were psycho-social factors such as depression, low frequency of conversation about sex with sexual partner. The risk factors of IIEF-5-ED in their 40s to 60s in 2016 were organic factors, such as hypertension, diabetes mellitus, smoking, alcohol use, and self-reported premature ejaculation.
Conclusions: Although the age-adjusted overall prevalence of self-ED has decreased during a decade, there was no differ- ence in the age-adjusted overall prevalence of IIEF-5-ED. Psycho-social support may be important for young men with ED and overall healthcare can be helpful for elderly men with ED.
Keywords: Erectile dysfunction; Internet; Prevalence; Risk factors
This is an Open Access article distributed under the terms of the Creative Commons Attribution Non-Commercial License (http://creativecommons.org/licenses/by-nc/4.0) which permits unrestricted non-commercial use, distribution, and reproduction in any medium, provided the original work is properly cited.
also closely related to various disease groups and may be affecting an estimated 30 million men in the United States [3].
Since the Massachusetts Men’s Aging Study, a large epidemiological investigation, discovered a high ED prevalence of 52% in the general population of men aged 40 to 70 years from 1987 to 1994 [4], related stud- ies have been conducted [5,6]. In addition to increasing interest in ED and changes in the awareness about the disease, our research group also reported on the prevalence and risk factors of ED in Korean adult men based on an Internet questionnaire survey in 2006 [7].
In these studies, systemic chronic diseases and related characteristics such as aging, DM, and hypertension (HTN) have been reported as well-known risk factors of ED [4,8]. However, some studies reported that not only chronic diseases but also lifestyle changes, socio- cultural and socio-psychological phenomena, such as obesity, physical activity, marital status, and anxiety have been known to affect ED [9,10].
Although many studies have investigated the prevalence and risk factors of ED, most previous stud- ies were carried out through a cross-sectional survey [3,8,11,12]. Even if some cohort studies have provided useful information [4], few longitudinal studies have been conducted because of the time and cost problems associated with following up the same subjects [3,5,6,8].
However, because social changes could have an impact on the prevalence of ED [3], longitudinal studies are required in elucidating this issue. In addition, age has been a well-known important risk factor of ED.
This study was a 10-year-interval survey about the prevalence and risk factors of ED. Moreover, the prev- alence and risk factors of ED were estimated according to age groups, because the prevalence of ED has been strongly associated with age and/or age-related diseases [5]. We aimed to elucidate the changes in ED preva- lence according to age groups associated with a socio- cultural transition and the alterations in risk factors accompanying them, through a 10-year survey target- ing the same previous group of panel participants with the same methodology.
MATERIALS AND METHODS
1. Study design
This study was based directly on the same methodol- ogy of the web-based survey used in the 2006 study [7],
and was conducted for the panels registered with the same company. This nationwide survey included men in their 20s to 60s, who had 1 or more sexual encoun- ters per month in the last 6 months. Only those men who answered all questionnaire items were included in the results. We recruited participants by e-mailing 100,000 panel members extracted using the propor- tional quota sampling method, and finally selected 2,569 men who expressed interest in participating. When the maximum response loading time of 1 frame of ques- tionnaires exceeded 8 minutes, the questionnaire prog- ress was automatically terminated. As with previous studies, data with a minimal mean response time of 10% were excluded automatically, to exclude unfaith- ful answers. The final number of subjects was 900 and the total response rate was 35.0% (900 of the total 2,569 respondents). Among them, 200 men were in their 20s, 200 in their 30s, 200 in their 40s, and 200 in their 50s.
For the 60s age group, only 100 participants were re- cruited owing to the small number of eligible Internet users. The investigation period was from December 8, 2016, to January 7, 2017.
The survey consisted of 111 questions in Korean. First, general demographics, such as smoking status, drinking status, age, body mass index (BMI; normal <23.0 kg/m2, overweight 23.0–24.9 kg/m2, obese ≥25.0 kg/m2, according to the Asian criteria [13]), social history, sexual history, and general health problems were surveyed. Then, the International Index of Erectile Function-5 (IIEF-5; nor- mal 22–25, mild 17–21, mild to moderate 12–16, moder- ate 8–11, severe 5–7) and International Prostate Symp- tom Score (IPSS) were assessed. Self-reported ED (self- ED) was determined using a single question: “Do you have ED?” IIEF-5-ED was defined as an IIEF-5 score of
≤21 [8,14]. The primary end point was the prevalence of IIEF-5-ED, which is known to be a more objective assessment than self-ED [11,15], and the secondary end point was the prevalence of self-ED.
2. Calculation for determining the number of target participants
The number of target subjects per age group was determined based on the prevalence determined in our previous study. The number of target participants was calculated by applying the following prevalence model:
N (sample size)=(Zα/2×P [1-P])/(D/2)2, where P is preva- lence, Zα/2=1.96, D=0.1, and α=0.05 [16]. On the basis of the prevalences of self-ED and IIEF-5-ED of 6.7% and
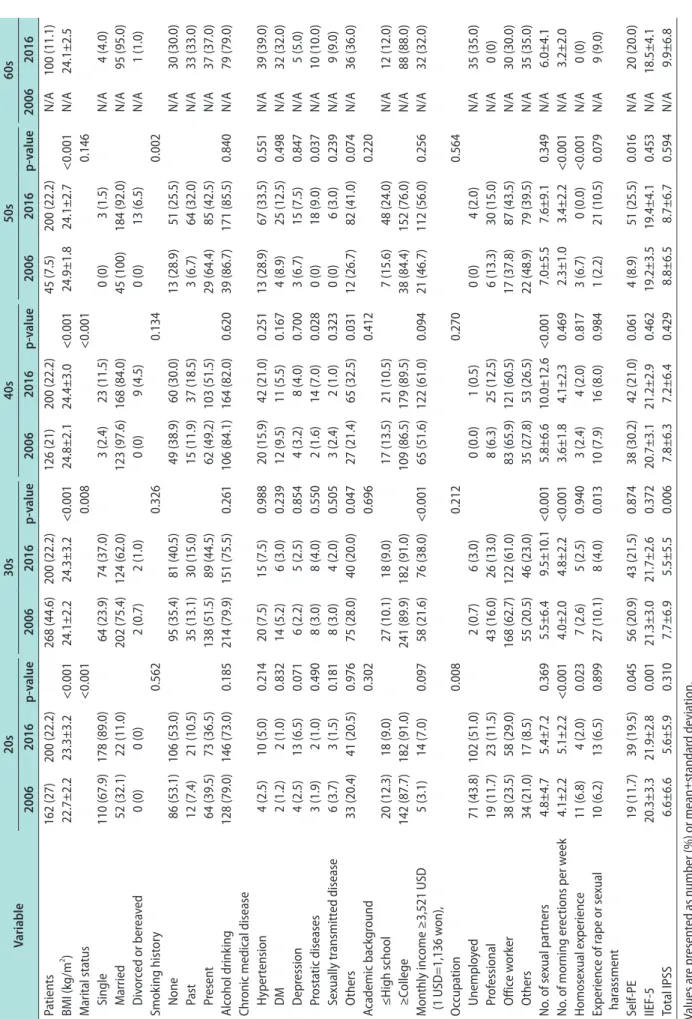
Table 1. Demographics and clinical characteristics in the 2006 and 2016 studies Variable20s30s40s50s60s 20062016p-value20062016p-value20062016p-value20062016p-value20062016 Patients162 (27)200 (22.2)268 (44.6)200 (22.2)126 (21)200 (22.2)45 (7.5)200 (22.2) N/A100 (11.1) BMI (kg/m2 )22.7±2.223.3±3.2<0.001 24.1±2.224.3±3.2<0.001 24.8±2.124.4±3.0<0.001 24.9±1.824.1±2.7<0.001 N/A24.1±2.5 Marital status<0.001 0.008 <0.001 0.146 Single110 (67.9)178 (89.0)64 (23.9)74 (37.0)3 (2.4)23 (11.5)0 (0)3 (1.5)N/A4 (4.0) Married52 (32.1)22 (11.0)202 (75.4)124 (62.0)123 (97.6)168 (84.0)45 (100)184 (92.0)N/A95 (95.0) Divorced or bereaved0 (0)0 (0)2 (0.7)2 (1.0)0 (0)9 (4.5)0 (0)13 (6.5)N/A1 (1.0) Smoking history0.562 0.326 0.134 0.002 None86 (53.1)106 (53.0)95 (35.4)81 (40.5)49 (38.9) 60 (30.0)13 (28.9)51 (25.5)N/A30 (30.0) Past12 (7.4)21 (10.5)35 (13.1) 30 (15.0)15 (11.9)37 (18.5)3 (6.7)64 (32.0)N/A33 (33.0) Present64 (39.5)73 (36.5)138 (51.5)89 (44.5)62 (49.2)103 (51.5)29 (64.4)85 (42.5)N/A37 (37.0) Alcohol drinking128 (79.0)146 (73.0)0.185 214 (79.9)151 (75.5)0.261 106 (84.1)164 (82.0)0.620 39 (86.7)171 (85.5)0.840 N/A79 (79.0) Chronic medical disease Hypertension4 (2.5)10 (5.0)0.214 20 (7.5)15 (7.5)0.988 20 (15.9)42 (21.0)0.251 13 (28.9)67 (33.5)0.551 N/A39 (39.0) DM2 (1.2)2 (1.0)0.832 14 (5.2)6 (3.0)0.239 12 (9.5)11 (5.5)0.167 4 (8.9)25 (12.5)0.498 N/A32 (32.0) Depression4 (2.5)13 (6.5)0.071 6 (2.2)5 (2.5)0.854 4 (3.2)8 (4.0)0.700 3 (6.7)15 (7.5)0.847 N/A5 (5.0) Prostatic diseases3 (1.9)2 (1.0)0.490 8 (3.0)8 (4.0)0.550 2 (1.6)14 (7.0)0.028 0 (0)18 (9.0)0.037 N/A10 (10.0) Sexually transmitted disease6 (3.7)3 (1.5)0.181 8 (3.0)4 (2.0)0.505 3 (2.4)2 (1.0)0.323 0 (0)6 (3.0)0.239 N/A9 (9.0) Others33 (20.4)41 (20.5)0.97675 (28.0)40 (20.0)0.04727 (21.4)65 (32.5)0.03112 (26.7)82 (41.0)0.074N/A36 (36.0) Academic background0.302 0.696 0.412 0.220 ≤High school20 (12.3)18 (9.0)27 (10.1)18 (9.0)17 (13.5)21 (10.5)7 (15.6)48 (24.0)N/A12 (12.0) ≥College142 (87.7)182 (91.0)241 (89.9) 182 (91.0)109 (86.5)179 (89.5)38 (84.4)152 (76.0)N/A88 (88.0) Monthly income ≥3,521 USD (1 USD=1,136 won),5 (3.1)14 (7.0)0.097 58 (21.6)76 (38.0)<0.001 65 (51.6)122 (61.0)0.094 21 (46.7)112 (56.0)0.256 N/A32 (32.0) Occupation0.008 0.212 0.270 0.564 Unemployed71 (43.8)102 (51.0)2 (0.7)6 (3.0)0 (0.0)1 (0.5)0 (0)4 (2.0)N/A35 (35.0) Professional19 (11.7)23 (11.5)43 (16.0)26 (13.0)8 (6.3)25 (12.5)6 (13.3)30 (15.0)N/A0 (0) Office worker38 (23.5)58 (29.0)168 (62.7)122 (61.0)83 (65.9)121 (60.5)17 (37.8)87 (43.5)N/A30 (30.0) Others34 (21.0)17 (8.5)55 (20.5)46 (23.0)35 (27.8)53 (26.5)22 (48.9)79 (39.5)N/A35 (35.0) No. of sexual partners4.8±4.75.4±7.20.369 5.5±6.49.5±10.1<0.001 5.8±6.610.0±12.6<0.001 7.0±5.57.6±9.10.349 N/A6.0±4.1 No. of morning erections per week4.1±2.25.1±2.2<0.001 4.0±2.04.8±2.2<0.001 3.6±1.84.1±2.30.469 2.3±1.03.4±2.2<0.001 N/A3.2±2.0 Homosexual experience11 (6.8)4 (2.0)0.0237 (2.6)5 (2.5)0.9403 (2.4)4 (2.0)0.8173 (6.7)0 (0.0)<0.001N/A0 (0) Experience of rape or sexual harassment10 (6.2)13 (6.5)0.899 27 (10.1)8 (4.0)0.013 10 (7.9)16 (8.0)0.984 1 (2.2)21 (10.5)0.079 N/A9 (9.0) Self-PE19 (11.7)39 (19.5)0.045 56 (20.9)43 (21.5)0.874 38 (30.2)42 (21.0)0.061 4 (8.9)51 (25.5)0.016 N/A20 (20.0) IIEF-520.3±3.321.9±2.80.001 21.3±3.021.7±2.60.372 20.7±3.121.2±2.90.462 19.2±3.519.4±4.10.453 N/A18.5±4.1 Total IPSS6.6±6.65.6±5.90.310 7.7±6.95.5±5.50.006 7.8±6.37.2±6.40.429 8.8±6.58.7±6.70.594 N/A9.9±6.8 Values are presented as number (%) or mean±standard deviation. BMI: body mass index, DM: diabetes mellitus, USD: US dollar, Self-PE: self-reported premature ejaculation, IIEF-5: International Index of Erectile Function-5, IPSS: International Prostate Symptom Score, N/A: not available.
41%, respectively, in the 2006 study [7], the sample size was calculated using the above formula, which indi- cated the need for 197 participants. Thus, we targeted 200 participants as the maximum number for each age group.
3. Statistical analysis
All numerical data were expressed as means and standard deviations. For comparison between 2 groups, the independent t-test for continuous variables and chi-square test for categorical variables were used. The age-adjusted prevalence of ED was calculated after ad- justing for 10-year age groups, according to the direct standardization method used for the 2006 male popula- tion from Statistics Korea.
As total IPSS was an important risk factor of ED in the 2006 study, we examined the relationship between ED severity according to IIEF-5 scores and total IPSS by using a chi-square test. Because self-reported pre- mature ejaculation (self-PE), determined using a single question, was the significant risk factor of ED in the 2016 study, we determined the relationship between ED and self-PE using a chi-square test.
Univariate and multivariable logistic regression analyses were done to determine the odds ratios and 95% confidence intervals to find the ED risk factors.
Variables with a p-value of <0.05 in univariate analysis were included in the multivariable model. IBM SPSS ver. 23.0 (IBM Co., Armonk, NY, USA) and R ver. 3.4.2 (http://www.r-project.org) were used in statistical analy- ses.
4. Ethics statement
The present study protocol was reviewed and ap- proved by the institutional review board of SMG- SNU Boramae Medical Center (Reg. No. 16-2016-108).
Informed consent was submitted by all subjects when they were enrolled.
RESULTS
1. Participant characteristics
The different characteristic regardless of age group, between the 2006 and 2016 study groups, was BMI (p<0.001), and the number of subjects with BMI ≥23.0 kg/m2 in the 2016 study was higher than that in the 2006 study (Table 1). In 2016, the number of subjects in their 20s and 40s with single marital status was higher than that in the same age group in 2006 (p<0.001). In 2016, the number of subjects in their 20s and 30s with large numbers of sexual partners and morning erec- tions was higher than that in the same age group in 2006 (p<0.001).
2. Prevalence of erectile dysfunction during a decade
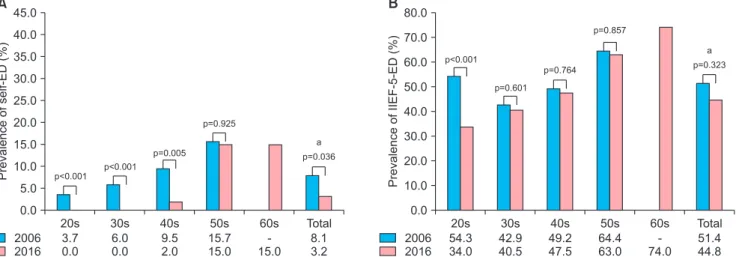
Similar to the finding of the 2006 study, the preva- lence of ED in the 2016 study was found to increase with age. Although the overall prevalence of IIEF-5- ED in 2016 without adjusting for age was lower than that in 2006, the age-adjusted overall prevalence of IIEF-5-ED in 2016 was comparable to that in 2006 (Fig.
1; 2016: 44.8% vs. 2006: 51.4%, p=0.323). However, when
45.0 40.0 35.0 30.0 25.0 20.0 15.0 10.0 5.0
Prevalenceofself-ED(%)
0.0 2006 2016
20s 30s 40s 50s 60s Total
3.7 0.0
6.0 0.0
9.5 2.0
15.7 15.0
- 15.0
8.1 3.2 p<0.001
p<0.001 p=0.005
p=0.925
p=0.036 a
80.0 70.0 60.0 50.0 40.0 30.0 20.0 ofPrevalenceIIEF-5-ED(%) 10.0
0.0 2006 2016
20s 30s 40s 50s 60s Total
54.3 34.0
42.9 40.5
49.2 47.5
64.4 63.0
- 74.0
51.4 44.8 p<0.001
p=0.601 p=0.764
p=0.857
p=0.323 a
A B
Fig. 1. Comparison of age-adjusted prevalence of self-reported erectile dysfunction (self-ED) and International Index of Erectile Function-5–as- sessed erectile dysfunction (IIEF-5-ED) between the 2006 and 2016 studies. (A) Age-adjusted prevalence of self-ED between 2006 and 2016. (B) Age-adjusted prevalence of IIEF-5-ED between 2006 and 2016. aFor comparison with the 2006 study, the age-adjusted overall prevalence was calculated excluding the 60s age group.
compared by age group, the prevalence of IIEF-5-ED for the 20s age group in 2016 was lower than that in 2006 (p<0.001), although there was no difference in other age groups. However, not only the age-adjusted overall prevalence of self-ED in 2016 (p=0.036) but also the prevalence of self-ED in all age groups except for the 50s was lower than that in 2006 (p<0.005).
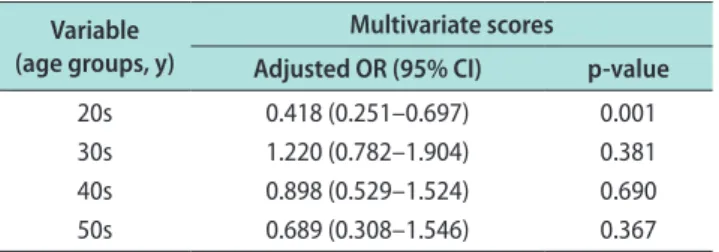
Table 2 shows the difference by age group at evalua- tion on the prevalence of ED according to age group af- ter adjusting for other variables. There was no differ- ence in the prevalence of IIEF-5-ED in subjects beyond their 30s between the 2006 and 2016 studies; however, there was a significant difference in IIEF-5-ED in the 20s age group only (p=0.001).
3. Risk factors of erectile dysfunction
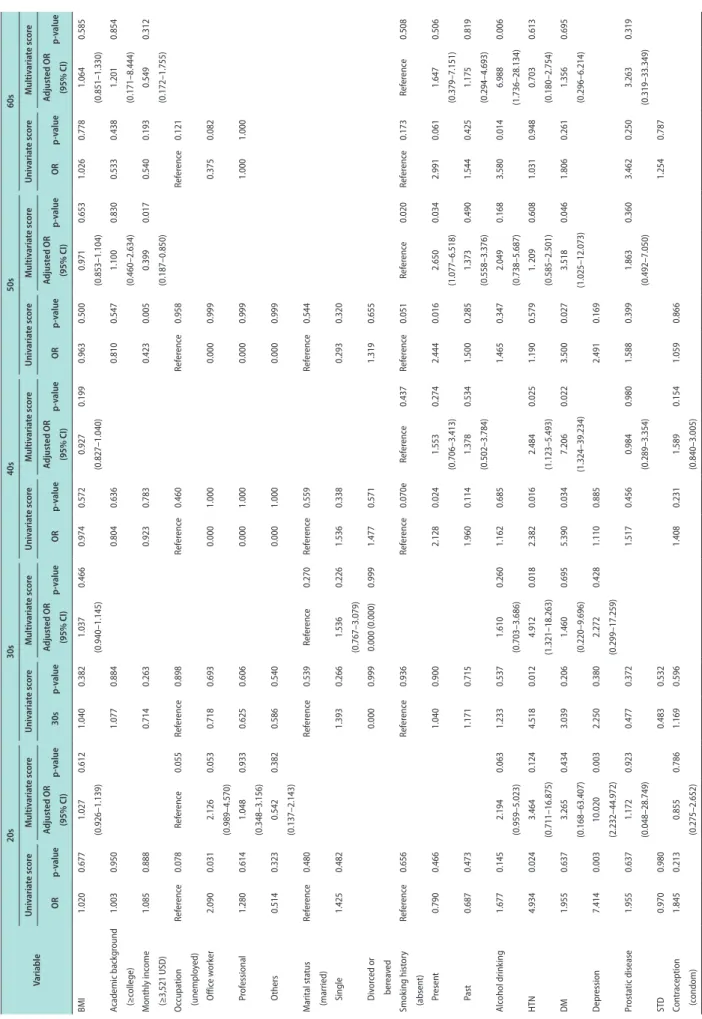
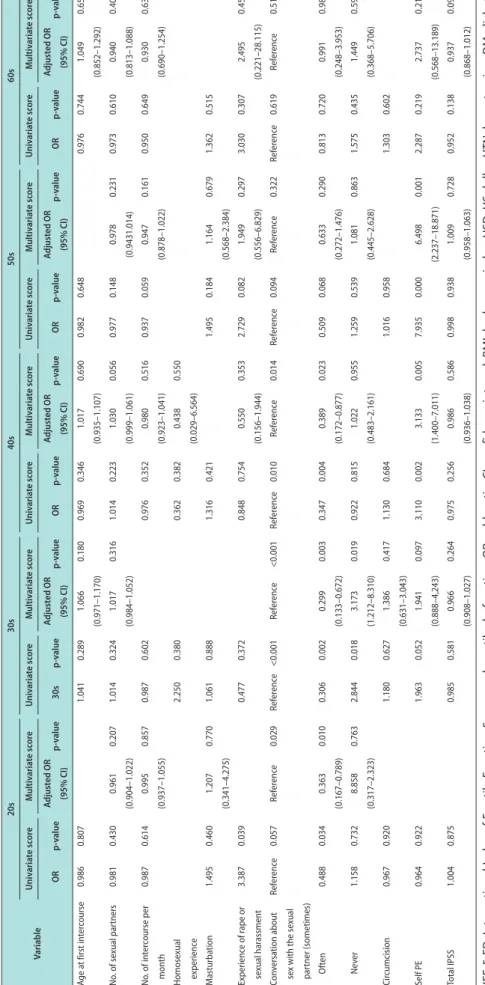
The ED risk factors for the 20s age group in the 2016 study were psycho-social risk factors such as de- pression and lack of conversation about sex with the sexual partner (Table 3). The ED risk factors for the 30s age group were HTN and lack of conversation about sex with the sexual partner. The ED risk factors for the 40s age group were lack of conversation about sex with the sexual partner and systemic risk factors such as HTN, DM, and self-PE. The ED risk factors for the 50s age group were lower monthly income, present smoking, DM, and self-PE. The ED risk factor for the 60s age group was alcohol drinking. The risk factors of IIEF-5-ED for all age’s subjects were aging, lower income, smoking, HTN, DM, depression, homosexual experience, lack of conversation about sex with the sex-
ual partner, self-PE, and total IPSS (Supplement 1). As total IPSS was one of the important risk factors of ED in the 2006 study, we also examined the relationship between total IPSS and ED in this study. The mean total IPSS for the normal, mild, mild to moderate, mod- erate, and severe IIEF-5-ED groups was 6.9±0.3, 6.8±0.3, 8.3±0.7, 9.4±1.6, and 12.0±4.1, respectively (p=0.081, Fig.
2). There was no statistically significant difference, although they were related to each other. Additionally, the prevalence of self-PE in the non-self-ED and self- ED groups was 19.9% and 53.1%, respectively (p<0.001, Supplement 2). The prevalence of self-PE in the non- IIEF-5-ED and IIEF-5-ED groups was 14.7% and 28.8%, respectively (p<0.001).
DISCUSSION
ED has been reported to be an important cause of decreased quality of life in men [1] and is strongly as- sociated with systemic chronic diseases [4]. In this re- gard, many studies have investigated the prevalence and risk factors of ED as the interest in the disease increased. However, most previous studies were cross- sectional in nature, and only a few longitudinal stud- ies have been conducted. As socio-cultural changes can have an impact on the prevalence and risk factors of ED [3], longitudinal studies are needed. Furthermore, although age was reported to be an important risk fac- tor of ED [5], studies on risk factors according to age groups have been uncommon. Some previous longitudi- nal studies have reported the importance of age-related ED and its medical and psycho-social relationships [4].
In this study, we assessed the changes in the preva- lence and risk factors of ED according to age groups during the last decade through a web-based survey, and attempted to obtain sincere and truthful answers on sensitive sexual issues.
The prevalence of ED was reported to be widely vari- able, which might be due to the different definitions for ED, different methodologies, and different characteris- tics of the study populations among studies. In addition, racial differences might be another reason for the wide variation in ED prevalence [17]. The prevalences of self- ED and IIEF-5-ED (IIEF-5≤21) based on an online survey were reported to be 7.0% and 45.1% in the United States, respectively [8]. In a European study, the prevalences of self-ED and IIEF-5-ED (IIEF-5<20) based on interviews were reported to be 25% and 31.6%, respectively [14]. In Table 2. Change in prevalence of IIEF-5-ED during a decade accord-
ing to age groups after adjusting for other variablesa Variable
(age groups, y)
Multivariate scores
Adjusted OR (95% CI) p-value
20s 0.418 (0.251–0.697) 0.001
30s 1.220 (0.782–1.904) 0.381
40s 0.898 (0.529–1.524) 0.690
50s 0.689 (0.308–1.546) 0.367
IIEF-5-ED: International Index of Erectile Function-5–assessed erectile dysfunction, OR: odds ratio, CI: confidence interval.
aOther variables: body mass index, academic background, monthly income, occupation, marital status, smoking, alcohol, hypertension, diabetes mellitus, depression, prostatic disease, sexually transmitted disease, contraception, age at first intercourse, no. of sexual partners, no. of intercourse per month, homosexual experience, masturbation, experience of rape or sexual harassment, conversation about sex with the sexual partner, circumcision, self-reported premature ejaculation, and total International Prostate Symptom Score.
Table 3. Risk factors according to age groups for IIEF-5-ED in the 2016 study Variable
20s30s40s50s60s Univariate scoreMultivariate scoreUnivariate scoreMultivariate scoreUnivariate scoreMultivariate scoreUnivariate scoreMultivariate scoreUnivariate scoreMultivariate score ORp-valueAdjusted OR (95% CI)p-value30sp-valueAdjusted OR (95% CI)p-valueORp-valueAdjusted OR (95% CI)p-valueORp-valueAdjusted OR (95% CI)p-valueORp-valueAdjusted OR (95% CI)p-value BMI1.020 0.677 1.027 (0.926–1.139)0.612 1.040 0.382 1.037 (0.940–1.145)0.466 0.974 0.572 0.927 (0.827–1.040)0.199 0.963 0.500 0.971 (0.853–1.104)0.653 1.026 0.778 1.064 (0.851–1.330)0.585 Academic background (≥college)1.003 0.950 1.077 0.884 0.804 0.636 0.810 0.547 1.100 (0.460–2.634)0.830 0.533 0.438 1.201 (0.171–8.444)0.854 Monthly income (≥3,521 USD)1.085 0.888 0.714 0.263 0.923 0.783 0.423 0.005 0.399 (0.187–0.850)0.017 0.540 0.193 0.549 (0.172–1.755)0.312 Occupation (unemployed)Reference0.078Reference0.055Reference0.898Reference0.460Reference0.958Reference0.121 Office worker2.090 0.031 2.126 (0.989–4.570)0.053 0.718 0.693 0.000 1.000 0.000 0.999 0.375 0.082 Professional1.280 0.614 1.048 (0.348–3.156)0.933 0.625 0.606 0.000 1.000 0.000 0.999 1.000 1.000 Others0.514 0.323 0.542 (0.137–2.143)0.382 0.586 0.540 0.000 1.000 0.000 0.999 Marital status (married)Reference0.480Reference0.539Reference0.270Reference0.559Reference0.544 Single1.425 0.482 1.393 0.266 1.536 (0.767–3.079)0.226 1.536 0.338 0.293 0.320 D ivorced or bereaved0.000 0.999 0.000 (0.000)0.999 1.477 0.571 1.319 0.655 Smoking history (absent)Reference0.656Reference0.936Reference0.070eReference0.437Reference0.051Reference0.020Reference0.173Reference0.508 Present0.790 0.466 1.040 0.900 2.128 0.024 1.553 (0.706–3.413)0.274 2.444 0.016 2.650 (1.077–6.518)0.034 2.991 0.061 1.647 (0.379–7.151)0.506 Past0.687 0.473 1.171 0.715 1.960 0.114 1.378 (0.502–3.784)0.534 1.500 0.285 1.373 (0.558–3.376)0.490 1.544 0.425 1.175 (0.294–4.693)0.819 Alcohol drinking1.677 0.145 2.194 (0.959–5.023)0.063 1.233 0.537 1.610 (0.703–3.686)0.260 1.162 0.685 1.465 0.347 2.049 (0.738–5.687)0.168 3.580 0.014 6.988 (1.736–28.134)0.006 HTN4.934 0.024 3.464 (0.711–16.875)0.124 4.518 0.012 4.912 (1.321–18.263)0.018 2.382 0.016 2.484 (1.123–5.493)0.025 1.190 0.579 1. 209 (0.585–2.501)0.608 1.031 0.948 0.703 (0.180–2.754)0.613 DM1.955 0.637 3.265 (0.168–63.407)0.434 3.039 0.206 1.460 (0.220–9.696)0.695 5.390 0.034 7.206 (1.324–39.234)0.022 3.500 0.027 3.518 (1.025–12.073)0.046 1.806 0.261 1.356 (0.296–6.214)0.695 Depression7.414 0.003 10.020 (2.232–44.972)0.003 2.250 0.380 2.272 (0.299–17.259)0.428 1.110 0.885 2.491 0.169 Prostatic disease1.955 0.637 1.172 (0.048–28.749)0.923 0.477 0.372 1.517 0.456 0.984 (0.289–3.354)0.980 1.588 0.399 1.863 (0.492–7.050)0.360 3.462 0.250 3.263 (0.319–33.349)0.319 STD0.970 0.980 0.483 0.532 1.254 0.787 Contraception (condom)1.845 0.213 0.855 (0.275–2.652)0.786 1.169 0.596 1.408 0.231 1.589 (0.840–3.005)0.154 1.059 0.866
Table 3. Continued Variable
20s30s40s50s60s Univariate scoreMultivariate scoreUnivariate scoreMultivariate scoreUnivariate scoreMultivariate scoreUnivariate scoreMultivariate scoreUnivariate scoreMultivariate score ORp-valueAdjusted OR (95% CI)p-value30sp-valueAdjusted OR (95% CI)p-valueORp-valueAdjusted OR (95% CI)p-valueORp-valueAdjusted OR (95% CI)p-valueORp-valueAdjusted OR (95% CI)p-value Age at first intercourse0.986 0.807 1.041 0.289 1.066 (0.971–1.170)0.180 0.969 0.346 1.017 (0.935–1.107)0.690 0.982 0.648 0.976 0.744 1.049 (0.852–1.292)0.654 No. of sexual partners0.981 0.430 0.961 (0.904–1.022)0.207 1.014 0.324 1.017 (0.984–1.052)0.316 1.014 0.223 1.030 (0.999–1.061)0.056 0.977 0.148 0.978 (0.9431.014)0.231 0.973 0.610 0.940 (0.813–1.088)0.408 No. of intercourse per month0.987 0.614 0.995 (0.937–1.055)0.857 0.987 0.602 0.976 0.352 0.980 (0.923–1.041)0.516 0.937 0.059 0.947 (0.878–1.022)0.161 0.950 0.649 0.930 (0.690–1.254)0.635 Homosexual experience2.250 0.380 0.362 0.382 0.438 (0.029–6.564)0.550 Masturbation1.495 0.460 1.207 (0.341–4.275)0.770 1.061 0.888 1.316 0.421 1.495 0.184 1.164 (0.568–2.384)0.679 1.362 0.515 Experience of rape or sexual harassment3.387 0.039 0.477 0.372 0.848 0.754 0.550 (0.156–1.944)0.353 2.729 0.082 1.949 (0.556–6.829)0.297 3.030 0.307 2.495 (0.221–28.115)0.459 Conversation about sex with the sexual partner (sometimes)
Reference0.057Reference0.029Reference<0.001Reference<0.001Reference0.010Reference0.014Reference0.094Reference0.322Reference0.619Reference0.512 Often0.488 0.034 0.363 (0.167–0.789)0.010 0.306 0.002 0.299 (0.133–0.672)0.003 0.347 0.004 0.389 (0.172–0.877)0.023 0.509 0.068 0.633 (0.272–1.476)0.290 0.813 0.720 0.991 (0.248–3.953)0.989 Never1.158 0.732 8.858 (0.317–2.323)0.763 2.844 0.018 3.173 (1.212–8.310)0.019 0.922 0.815 1.022 (0.483–2.161)0.955 1.259 0.539 1.081 (0.445–2.628)0.863 1.575 0.435 1.449 (0.368–5.706)0.596 Circumcision0.967 0.920 1.180 0.627 1.386 (0.631–3.043)0.417 1.130 0.684 1.016 0.958 1.303 0.602 Self PE0.964 0.922 1.963 0.052 1.941 (0.888–4,243)0.097 3.110 0.002 3.133 (1.400–7.011)0.005 7.935 0.000 6.498 (2.237–18.871)0.001 2.287 0.219 2.737 (0.568–13.189)0.210 Total IPSS1.004 0.875 0.985 0.581 0.966 (0.908–1.027)0.264 0.975 0.256 0.986 (0.936–1.038)0.586 0.998 0.938 1.009 (0.958–1.063)0.728 0.952 0.138 0.937 (0.868–1.012)0.097 IIEF-5-ED: International Index of Erectile Function-5–assessed erectile dysfunction, OR: odds ratio, CI: confidence interval, BMI: body mass index, USD: US dollar, HTN: hypertension, DM: diabetes mellitus, STD: sexually transmitted disease, Self-PE: self-reported premature ejaculation, IPSS: International Prostate Symptom Score.
this study, the prevalences of IIEF-5-ED (IIEF-5≤21) in 2006 and 2016 were 51.4% and 44.8%, respectively, whereas those of self-ED in 2006 and 2016 were 8.1%
and 3.2%, respectively. In the previous Korean study, the prevalence of IIEF-5-ED (IIEF-5≤17) was 32.4%
[18], which was almost similar to that in the current study (i.e., 28.0%). In addition, the prevalence of self-ED was also comparable to that in other studies, and the results of the current study were considered to be reli- able. However, as mentioned above, the prevalence of self-ED was considerably lower than the prevalence of IIEF-5-ED. The suggested reason for this finding was that the prevalence of self-ED might be underestimat- ed and undisclosed in the absence of life-threatening conditions and because it is considered a sensitive issue [19].
This interval study on the prevalence of ED made it possible to understand the relationship between age- related ED and socio-cultural changes. According to the current study, the overall prevalence of IIEF-5-ED has not changed (p=0.323), but the prevalence of self- ED has changed throughout the last decade (p=0.036).
Although a statistical significance was not achieved among other age groups, the prevalence of IIEF-5-ED in young men in their 20s has slightly decreased. Even if other variables were adjusted, there was a differ- ence in the prevalence of IIEF-5-ED only in the 20s age group during a decade (p=0.001). In addition, the preva- lence of self-ED considerably decreased from 8.1% to
3.2%, and the prevalence of self-ED in young men has more clearly decreased. Unlike IIEF-5-ED, which can be objectively assessed by physicians, self-ED is likely to be influenced by psycho-social factors at the time of assessment. The increase in the prevalence of single marital status, the decrease in the number of times ED was mentioned in mass media, and the assessment of ED according to strict medical guidelines through multimedia information including the Internet in 2016 compared with 2006 when sildenafil had just been launched could have been the cause of self-ED decline (Table 1) [20,21]. However, IIEF-5-ED will be more use- ful and reliable than self-ED when evaluating and diagnosing ED. The prevalence of IIEF-5-ED in the 20s age group in the 2006 study was also higher than that in the 30s or 40s age group. The reason for this is be- lieved to be the tendency of young men to show off and overestimate their sexual abilities. Although they did not have self-ED, they had IIEF-5-ED when checked for each item of the objective IIEF-5-questionnaire.
However, these results need to be interpreted with cau- tion because the characteristics of the study population were slightly different between the groups, although age was adjusted before the comparison.
To investigate the causes and relevance of the dif- ference in ED prevalence according to age during 10 years, we analyzed the risk factors of ED in each age group. Psycho-social factors such as depression, age at first intercourse, homosexual experience, and conver- sation about sex with the sexual partner were risk factors of ED in young ages, whereas systemic factors such as smoking and DM were risk factors in old ages, which were similar to the findings of a previous study [22]. Compared with the 2006 study, although some risk factors changed (Supplement 3, 4), there was still no change in the prevalence of ED. This was prob- ably because systemic chronic diseases are still crucial risk factors of ED in old ages, although socio-cultural and socio-psychological factors are more important in younger ages. Supplement 5 shows the risk factors of self-ED for all ages between 2006 and 2016 study. Ag- ing was still risk factor for self-ED, but chronic medi- cal diseases such as DM, prostatic disease, and self-PE were emerging risk factors of self-ED in 2016. In 2006 study, only the 20s to 50s were included, and the ratio between 40s and 50s was low. However, in the 2016 study, 20s to 60s were included, and 20s to 50s were the same rate. Therefore, chronic diseases would have been
16.0 14.0 12.0 10.0 8.0 6.0 4.0 2.0
TotalIPSS
0.0
Normal
(IIEF-5:
22
25) Mild ED
(IIEF-5:
17 21)
Mild tomoderat
eED
(IIEF-5:
12 16)
Moderat eED
(IIEF-5:
8 11) Sever
eED
(IIEF-5:
57)
6.9 6.8
8.3
9.4
12.0
Fig. 2. Total International Prostate Symptom Score (IPSS) according to the severity of International Index of Erectile Function-5 (IIEF-5)–
assessed erectile dysfunction (score ≤21) in the 2016 study.
a risk factors of ED because more elderly subjects were included. In addition, the prevalence of chronic medical diseases has recently been increased in Korea.
Smoking was a risk factor of IIEF-5-ED in subjects beyond their 40s in this study. Clinical studies have provided strong indirect evidence that smoking may affect erectile function by causing impairment of endothelium-dependent smooth muscle relaxation [23].
The association of ED with risk factors such as coro- nary artery diseases and HTN appears to be amplified by cigarette smoking [23]. Smoking may double the likelihood of moderate or complete ED [23]. Therefore, even if a young man who smokes has no ED, clinicians should positively recommend avoiding smoking to young people.
PE, which has been recently focused on as an im- portant comorbidity of ED, was determined as another risk factor of ED in the current study. In the previ- ous study, men with PE showed lower levels of libido, frequency of sexual intercourse, and satisfaction after sexual intercourse, and more ED than men without PE. Moderate or severe IIEF-5-ED was found more frequently in men with PE [24], which is in accordance with the findings of the current study. Furthermore, moderate ED diagnosed according to the Sexual Health Inventory for Men was reported to be present in 10%
of men with self-reported acquired PE, 10% of men with lifelong PE, and 3% of men who self-reported as not having PE [25].
Moreover, total IPSS was a risk factor of IIEF-5-ED in the 20s and 30s age groups during a decade. There have been only a few studies on the association be- tween total IPSS and ED. Reports on the pathophysiol- ogy of lower urinary tract symptoms (LUTS) showed a close relationship with ED and an independent re- lationship with comorbidities such as DM and HTN [26]. In such studies, combined treatment for LUTS and ED with type-5 inhibitor (phosphodiesterase type 5 inhibitor) has been presented [27]. Egan et al [28]
reported that the co-occurrence of ED and benign pros- tatic hyperplasia was evident in about 10% of men ≥40 years of age and was associated with significant clini- cal correlates. On the basis of the results of this study, clinicians may consider these issues when evaluating patients with ED.
This study has several limitations. Although it was similar to the cohort study conducted on the same panel group registered with the same Internet survey
company, there might be a selection bias in the inclu- sion criteria. This study excluded men with no sexual experience because we applied the same inclusion cri- teria for comparison with previous study. Therefore, this study can be applied only to men who regularly engage in sexual intercourse. Also, a web-based survey study may have a selection bias [11,12]. The ratio of total population is only an estimate. The maximum ac- ceptable standard error in this study was ±3.3% in 95%
confidence interval, which needs to be noted. Neverthe- less, this study was a relatively large-scale Internet- based survey with the same questionnaires and re- search methodology, and with a 10-year follow-up. The low response rate and representativeness of population were still a big limitation of every internet-based sur- vey studies [11,12,29]. There are many methodological disputes such as the representative of the sample, the non-response error, and the measurement error in in- ternet survey study [30]. Securing the representative is in a probabilistic sampling. For this, there should be no discrepancy between the target population and the frame population. These discrepancies are closely related to the internet penetration rate. Although the internet penetration rate has increased compared to 10 years ago and the probabilistic sample extraction through the Proportionate Quota Sampling method has been carried out to overcome the limitation of rep- resentativeness, it still has the limitation. This study did not include questionnaires on experience of treat- ing ED with PDE5i administration. However, because there has been no other large-scale longitudinal study, we believe that our study is valuable and useful to cli- nicians.
CONCLUSIONS
This 10-year-interval web-based survey showed that there was no difference in the age-adjusted overall prevalence of IIEF-5-ED, although the age-adjusted overall prevalence of self-ED considerably decreased.
Generally, psycho-social factors were relatively impor- tant in young men with ED younger than 40 years, and systemic factors were more associated with ED as age increased. Therefore, a psycho-social approach needs to be considered in healthy young patients with ED; in older patients with ED, a focus on chronic dis- eases is required. Further longitudinal studies on these issues are warranted.
Disclosure
The authors have no potential conflicts of interest to disclose.
Author Contribution
Conceptualization: Son H, Song WH, Park J. Data curation:
Son H, Song WH, Yoo S. Formal analysis: Oh S, Song WH.
Funding acquisition: Son H. Investigation: Son H, Song WH, Cho SY. Methodology: Cho MC, Jeong H. Project administration: Son H, Cho SY, Cho MC, Jeong H. Software: Oh S, Song WH, Yoo S.
Supervision: Son H. Validation: Oh S, Song WH, Yoo S. Writing–
original draft: Song WH, Park J, Yoo S. Writing–review & edit- ing: Song WH, Yoo S, Son H.
Supplementary Materials
Supplementary materials can be found via https://doi.
org/10.5534/wjmh.180054.
REFERENCES
1. Choi WS, Song SH, Son H. Epidemiological study of com- plementary and alternative medicine (CAM) use for the improvement of sexual function in young Korean men: the Korean Internet Sexuality Survey (KISS), part II. J Sex Med 2012;9:2238-47.
2. Cho SY, Son H, Kim SW, Paick JS. Should men with mild erectile dysfunction be closely evaluated for cardiovascular diseases in the Korean population? Aging Male 2014;17:81-6.
3. Laumann EO, Paik A, Rosen RC. Sexual dysfunction in the United States: prevalence and predictors. JAMA 1999;281:
537-44.
4. Feldman HA, Goldstein I, Hatzichristou DG, Krane RJ, McKinlay JB. Impotence and its medical and psychosocial correlates: results of the Massachusetts Male Aging Study. J Urol 1994;151:54-61.
5. Braun M, Wassmer G, Klotz T, Reifenrath B, Mathers M, En- gelmann U. Epidemiology of erectile dysfunction: results of the ‘Cologne Male Survey’. Int J Impot Res 2000;12:305-11.
6. Tan HM, Low WY, Ng CJ, Chen KK, Sugita M, Ishii N, et al.
Prevalence and correlates of erectile dysfunction (ED) and treatment seeking for ED in Asian Men: the Asian Men’s Atti- tudes to Life Events and Sexuality (MALES) study. J Sex Med 2007;4:1582-92.
7. Kim M, Shin GH, Ryoo S, Ko S, Kim H, Song SH, et al. The prevalence and risk factors for erectile dysfunction in Korean young men: a web-based survey. Korean J Androl 2006;24:76-
83.
8. Shaeer O, Shaeer K. The Global Online Sexuality Survey (GOSS): the United States of America in 2011. Chapter I:
erectile dysfunction among English-speakers. J Sex Med 2012;
9:3018-27.
9. Esposito K, Giugliano F, Di Palo C, Giugliano G, Marfella R, D’Andrea F, et al. Effect of lifestyle changes on erectile dys- function in obese men: a randomized controlled trial. JAMA 2004;291:2978-84.
10. Shabsigh R, Broderick GA, Althof S, Natanegara F, Wong DG.
Daily patterns of sexual intercourse attempts by men with erectile dysfunction treated with tadalafil: influence of age and marital status. Int J Impot Res 2009;21:285-91.
11. Son H, Song SH, Kim SW, Paick JS. Self-reported premature ejaculation prevalence and characteristics in Korean young males: community-based data from an internet survey. J An- drol 2010;31:540-6.
12. Son H, Song SH, Lee JY, Paick JS. Relationship between pre- mature ejaculation and depression in Korean males. J Sex Med 2011;8:2062-70.
13. Choo V. WHO reassesses appropriate body-mass index for Asian populations. Lancet 2002;360:235.
14. Giuliano F, Chevret-Measson M, Tsatsaris A, Reitz C, Murino M, Thonneau P. Prevalence of erectile dysfunction in France:
results of an epidemiological survey of a representative sam- ple of 1004 men. Eur Urol 2002;42:382-9.
15. Malavige LS, Jayaratne SD, Kathriarachchi ST, Sivayogan S, Fernando DJ, Levy JC. Erectile dysfunction among men with diabetes is strongly associated with premature ejaculation and reduced libido. J Sex Med 2008;5:2125-34.
16. Nicolosi A, Moreira ED Jr, Shirai M, Bin Mohd Tambi MI, Glasser DB. Epidemiology of erectile dysfunction in four countries: cross-national study of the prevalence and corre- lates of erectile dysfunction. Urology 2003;61:201-6.
17. Laumann EO, West S, Glasser D, Carson C, Rosen R, Kang JH. Prevalence and correlates of erectile dysfunction by race and ethnicity among men aged 40 or older in the United States: from the male attitudes regarding sexual health survey.
J Sex Med 2007;4:57-65.
18. Ahn TY, Park JK, Lee SW, Hong JH, Park NC, Kim JJ, et al.
Prevalence and risk factors for erectile dysfunction in Korean men: results of an epidemiological study. J Sex Med 2007;4:
1269-76.
19. Al Naimi A, Majzoub AA, Talib RA, Canguven O, Al Ansari A.
Erectile dysfunction in qatar: prevalence and risk factors in 1,052 participants-a pilot study. Sex Med 2014;2:91-5.
20. NIH Consensus Conference. Impotence. NIH consensus de- velopment panel on impotence. JAMA 1993;270:83-90.
21. Morgentaler A. Male impotence. Lancet 1999;354:1713-8.
22. Nguyen HMT, Gabrielson AT, Hellstrom WJG. Erectile dys- function in young men: a review of the prevalence and risk factors. Sex Med Rev 2017;5:508-20.
23. McVary KT, Carrier S, Wessells H; Subcommittee on Smoking and Erectile Dysfunction Socioeconomic Committee, Sexual Medicine Society of North America. Smoking and erectile dysfunction: evidence based analysis. J Urol 2001;166:1624- 32.
24. Lee SW, Lee JH, Sung HH, Park HJ, Park JK, Choi SK, et al.
The prevalence of premature ejaculation and its clinical char- acteristics in Korean men according to different definitions.
Int J Impot Res 2013;25:12-7.
25. McMahon CG, Lee G, Park JK, Adaikan PG. Premature ejaculation and erectile dysfunction prevalence and attitudes in the Asia-Pacific region. J Sex Med 2012;9:454-65.
26. Rosen R, Altwein J, Boyle P, Kirby RS, Lukacs B, Meuleman E, et al. Lower urinary tract symptoms and male sexual dysfunc- tion: the multinational survey of the aging male (MSAM-7).
Eur Urol 2003;44:637-49.
27. Kim SW, Park NC, Lee SW, Yang DY, Park JK, Moon DG, et al. Efficacy and safety of a fixed-dose combination therapy of tamsulosin and tadalafil for patients with lower urinary tract symptoms and erectile dysfunction: results of a randomized, double-blinded, active-controlled trial. J Sex Med 2017;14:
1018-27.
28. Egan KB, Burnett AL, McVary KT, Ni X, Suh M, Wong DG, et al. The co-occurring syndrome-coexisting erectile dys- function and benign prostatic hyperplasia and their clinical correlates in aging men: results from the National Health and Nutrition Examination Survey. Urology 2015;86:570-80.
29. Manana PN, Kuonza L, Musekiwa A, Koornhof H, Nanoo A, Ismail N. Feasibility of using postal and web-based surveys to estimate the prevalence of tuberculosis among health care workers in South Africa. PLoS One 2018;13:e0197022.
30. Couper MP. Web surveys: a review of issues and approaches.
Public Opin Q 2000;64:464-94.