INTRODUCTION
The prevalence of type 2 diabetes mellitus (T2DM), is increasing worldwide and has now become a truly global epidemic. Because of the severity of its complications and its high costs to control them, preven- tion of this chronic disease is demanding much attention.
Metabolic syndrome is a clinical disorder that increases the risk of dia-
betes mellitus, cardiovascular morbidity, and mortality. Furthermore, cardiovascular complications are the major cause of death of T2DM pa- tients and metabolic syndrome increases the risk for cardiovascular dis- ease even more.1) Elevated plasma glucose levels are one component of the current definition of metabolic syndrome, with other risk factors includ- ing abdominal obesity, hypertension, and dyslipidemia.2) Therefore, dia- betes, obesity and metabolism are interrelated medical conditions.
Original Article
2011-2012 국민건강영양조사 자료에 기초한 제2형 당뇨가 있는 성인에서의 대사건강 상태와 비타민 D의 연관성
진로사1, 정상아1, 석상아1, 이경나1, 김선미1,*, 한경도2
1고려대학교 의과대학 고려대학교구로병원 가정의학과, 2가톨릭대학교 의과대학 생물통계학과
Association between Vitamin D Levels and Metabolic Health in Adults with Type 2 Diabetes:
The Korea National Health and Nutrition Examination Survey 2011–2012
Rosa Jin1, Sang-Ah Jung1, Sang-Ah Sok1, Kyung-Na Lee1, Seon Mee Kim1,*, Kyung Do Han2
¹Department of Family Medicine, Korea University Guro Hospital, Korea University College of Medicine; ²Department of Biostatistics, The Catholic University of Korea College of Medicine, Seoul, Korea
Background: Low levels of serum 25-hydroxy vitamin D (25(OH)D) have been associated with diabetes and metabolic syndrome. This study aimed to evaluate the association between 25(OH)D levels and metabolic health in Korean adults with type 2 diabetes.
Methods: We used data from 2011–2012 Korean National Health and Nutrition Examination Survey V. A total of 1,353 adults with type 2 diabetes were included. The association between metabolic health and type 2 diabetes was assessed by multivariate logistic regression analysis with adjustment for potential confounders.
Results: Serum 25(OH) levels were lower in diabetic patients with metabolically poor health than in diabetic patients with metabolically normal health.
As the serum 25(OH)D level increased in the metabolically unhealthy group, waist circumference and triglyceride levels tended to significantly decrease. An inverse relationships was observed between 25(OH)D and the total number of components of metabolic syndrome (P=0.029). The adjusted odd ratios in the metabolically unhealthy group and the high triglyceride group, respectively, showed a decreasing tendency to have metabolic syndrome (P for trend = 0.013, 0.01, respectively).
Conclusion: Low serum 25(OH)D concentration is associated with poor metabolic health in diabetic adults in Korea, and is related to increased total triglycerides, which is a metabolic risk factor.
Keywords: Vitamin D; Metabolic Syndrome; Type 2 Diabetes
http://dx.doi.org/10.21215/kjfp.2016.6.1.14 pISSN 2233-9019 · eISSN 2233-9116 Korean J Fam Pract. 2016;6(1):14-19
KJFP
Korean Journal of Family PracticeReceived February 27, 2015 Accepted October 8, 2015 Corresponding author Seon Mee Kim
Tel: +82-2-2626-1540, Fax: +82-2-837-3966 E-mail: [email protected]
Copyright © 2016 The Korean Academy of Family Medicine
This is an open-access article distributed under the terms of the Creative Commons At- tribution Non-Commercial License (http://creativecommons.org/licenses/by-nc/4.0) which permits unrestricted noncommercial use, distribution, and reproduction in any medium, provided the original work is properly cited.
진로사 외. 제2형 당뇨가 있는 성인에서의 대사건강 상태와 비타민 D의 연관성 Korean Journal of Family Practice
KJFP
Original Article
Korean Journal of Family Practice However, not every obese patient has these metabolic derangements.3) Approximately 30% of obese individuals do not have metabolic syn- drome and are thus at a lower risk of developing T2DM and cerebrovas- cular disease;4) they are thought to exhibit metabolically healthy obesity, which is an obese phenotype free of any met¬abolic complications.5)
Primary care physicians frequently treat patients with diabetes who present with metabolic syndrome or other comorbidities. Vitamin defi- ciency is one of the possible comorbidities that are often overlooked in diabetes, such as vitamin D and B12 deficiency.
Serum 25-hydroxyvitamin D (25(OH)D) is considered the best bio- marker of vitamin D status.6) Aside from the classic actions of vitamin D on bone metabolism and calcium homeostasis, experts postulate that it may play an important role in cellular proliferation and differentiation and survival of cells in disorders of immunity.7,8) Serum 25(OH)D is the most commonly investigated circulating vitamin D metabolite measured by epidemiological studies and it is proposed to have an inverse relation- ship with metabolic syndrome.9) Evidence suggests that vitamin D insuf- ficiency may lead to abnormal glucose metabolism; thus, maintaining vi- tamin D levels is important in the prevention of metabolic syndrome and its sequelae.10)
The aim of this study was to evaluate the association between vitamin D levels and metabolic health in the diabetic Korean adult population. In addition, we related the vitamin D level to the number of components of metabolic syndrome.
METHODS
1. Study Population
This study was based on data from the Korean National Health and Nutrition Examination Survey V (KNHANES V)-2, 3 conducted by the Korean Ministry of Health and Welfare.11) KNHANES is a cross-section- al and nationally representative survey of the health and nutritional sta- tus of the Korean population. It is composed of a health-questionnaire survey, a health examination, and a nutrition survey. We used the data from the participants of the 2011–2012 KNHANES, who were selected using proportional systematic sampling with multi-stage stratification (age, sex, and region).
In the 5th KNHANES (2011–2012), 16,576 individuals aged ≥19 year were sampled for the survey. Of these 16,576 individuals, we limited the analysis to adults aged ≥19 years (Figure 1). We excluded 11,478 people who were not diabetics, and 28 people whose data were missing impor- tant analytic variables such as serum 25(OH)D levels. Ultimately, 1,353 subjects were included in the statistical analysis. The KNHANES was ap- proved by the institutional review board of the Centers for Disease Con- trol and Prevention in Korea (201102CON-06-C, 201201EXP-01-2C). All participants in the survey signed an informed written consent form.
2. Variable Measurements
Information on age, education, smoking history, alcohol intake, and exercise was collected during the health interview. People were classified as current smokers if they had smoked at least one cigarette per day dur-
Fifth Korean National Health and Nutrition Examination Survey 2, 3 (n=16,576)
Subjects under 19 years of age (n=3,717) were excluded
Subjects over the age of 19 (n=12,859)
Subjects who are not diabetes (n=11,478) were excluded
Subjects who have diabetes (n=1,381)
Subjects who didn t have data of the 25(OH)D level (n=28) were excluded
Diabetic subjects who have data of the 25(OH)D level (n=1,353) Figure 1. Flow chart of study popula- tion. 25(OH)D, 25-hydroxyvitamin D.
Rosa Jin, et al. Vitamin D Levels and Metabolic Health in Type 2 Diabetes
Korean Journal of Family Practice
KJFP
ing the previous 12 months. Alcohol consumption was categorized into heavy drinkers if respondents drank >30 g/d for the previous 12 months.
Based on the International Physical Activity Questionnaire, physical ac- tivity levels were divided into three categories as low, moderate, or high.12)
3. Anthropometric Measurements
Body weight and height were measured to the nearest 0.1 kg and 0.1 cm, respectively, with the participants wearing light, indoor clothing without shoes. Body mass index (BMI) was calculated using the formula:
weight (kg)/height (m2). Waist circumference (WC) was measured at the narrowest point between the lower border of the rib cage and the iliac crest. To measure systolic blood pressure (SBP) and diastolic blood pres- sure (DBP), a standard mercury sphygmomanometer (Baumanometer;
WA Baum Co. Inc., Copiague, NY, USA) was used on the right arm. SBP and DBP were measured twice at 5-minute intervals, and the average val- ues were used in the analysis.
4. Vitamin D Levels
There has been no definite consensus on the optimal serum levels of 25(OH)D in the literature. Although there was previous data defining vi- tamin D deficiency as serum 25(OH)D less than 20 ng/mL,7) we classified vitamin D levels into the four groups in order to determine the associa- tion between serum 25(OH)D levels and metabolic risk factors.
5. Definitions of Metabolically Healthy Group and Meta
bolically Unhealthy Group
The metabolically healthy group was defined to have 1 or fewer of the metabolic syndrome criteria. Thus, they are free of criteria besides abnor- mal glucose levels. The metabolically unhealthy group was defined to have 2 or more of the metabolic syndrome criteria.
Metabolic syndrome was diagnosed if subjects met any 3 of 5 criteria set by the American Heart Association/National Heart, Lung, and Blood Institute.13) The criteria were as follows: (1) WC ≥102 cm for men, ≥88 cm in women; (2) triglyceride (TG) ≥150 mg/dL or taking medication for hy- perlipidemia; (3) high density lipoprotein cholesterol (HDLC) <40 mg/dL for men, <50 mg/dL for women; (4) blood pressure ≥130/85 mm Hg or taking anti-hypertension medication; and (5) fasting blood sugar ≥110 mg/dL or taking medication for diabetes.
6. Statistical Analysis
All statistical analysis was performed using SAS software ver. 9.3 for Windows (SAS Institute Inc., Cary, NC, USA) and SAS SURVEYPRE- CESURE was used for complex sample design. The subjects were divided into two groups depending on whether or not they had metabolic syn- drome. Continuous variables are described as means±standard errors and categorical variables are expressed as numbers and percentages of subjects. Each variable was then analyzed using t-test and chi-square test.
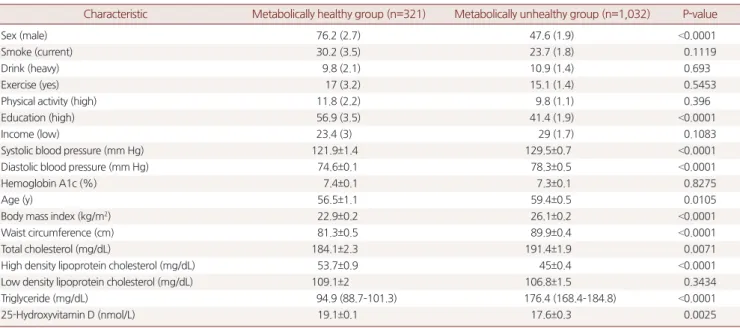
Table 1. Baseline characteristics of study subjects
Characteristic Metabolically healthy group (n=321) Metabolically unhealthy group (n=1,032) P-value
Sex (male) 76.2 (2.7) 47.6 (1.9) <0.0001
Smoke (current) 30.2 (3.5) 23.7 (1.8) 0.1119
Drink (heavy) 9.8 (2.1) 10.9 (1.4) 0.693
Exercise (yes) 17 (3.2) 15.1 (1.4) 0.5453
Physical activity (high) 11.8 (2.2) 9.8 (1.1) 0.396
Education (high) 56.9 (3.5) 41.4 (1.9) <0.0001
Income (low) 23.4 (3) 29 (1.7) 0.1083
Systolic blood pressure (mm Hg) 121.9±1.4 129.5±0.7 <0.0001
Diastolic blood pressure (mm Hg) 74.6±0.1 78.3±0.5 <0.0001
Hemoglobin A1c (%) 7.4±0.1 7.3±0.1 0.8275
Age (y) 56.5±1.1 59.4±0.5 0.0105
Body mass index (kg/m2) 22.9±0.2 26.1±0.2 <0.0001
Waist circumference (cm) 81.3±0.5 89.9±0.4 <0.0001
Total cholesterol (mg/dL) 184.1±2.3 191.4±1.9 0.0071
High density lipoprotein cholesterol (mg/dL) 53.7±0.9 45±0.4 <0.0001
Low density lipoprotein cholesterol (mg/dL) 109.1±2 106.8±1.5 0.3434
Triglyceride (mg/dL) 94.9 (88.7–101.3) 176.4 (168.4–184.8) <0.0001
25-Hydroxyvitamin D (nmol/L) 19.1±0.1 17.6±0.3 0.0025
Values are presented as number (%), mean±standard error, or mean (range).
진로사 외. 제2형 당뇨가 있는 성인에서의 대사건강 상태와 비타민 D의 연관성 Korean Journal of Family Practice
KJFP
Multivariate logistic regression analysis were conducted to evaluate the association between metabolic risk factors and serum 25(OH)D concen- tration; odd ratios (ORs) and confidence intervals (CIs) were estimated.
Multivariate analyses were adjusted for age, sex, BMI category (normal,
<25.0 kg/m2; overweight, 25.0 to 29.9 kg/m2; or obese, ≥30.0 kg/m2), alco- hol consumption, and physical activity. P-values less than 0.05 were con- sidered significant.
RESULTS
1. Baseline Characteristics of the Study Population The characteristics of the 1,353 adult study subjects are presented in Table 1. In total, 321 subjects were assigned to the metabolically healthy group, and 1,032 subjects were assigned to the metabolically unhealthy group. The metabolically unhealthy group had a higher BMI, WC, TG count, blood pressure and lower education levels (P<0.001) compared to the metabolically healthy group. Moreover, men and older subjects were more likely to be metabolically unhealthy. Mean serum 25(OH)D con- centration in the metabolically healthy group with diabetes was 19.1 nmol/L and it was significantly higher (P=0.002) than in the metaboli- cally unhealthy group with diabetes. The rate of hypertensive and lipid- lowering medication use was 39% among the study subjects. However, there were no differences in smoking, alcohol consumption, lower house- hold income, or exercise.
2. Association between Serum 25Hydroxyvitamin D Levels and Metabolic Risk Factors
In Figure 2, the proportion of the metabolically unhealthy group and the components of metabolic syndrome are presented according to the serum 25(OH)D levels. As the serum 25(OH)D level increases in the metabolically unhealthy group, waist circumference and TG levels tend to significantly decrease. Most importantly, the metabolically unhealthy group showed statistically significant differences with the metabolically healthy group (P=0.001).
Figure 3 shows vitamin D level in relation to the number of risk factors for metabolic syndrome. As the number of components increases, 25(OH)D concentration significantly decreases (P=0.029).
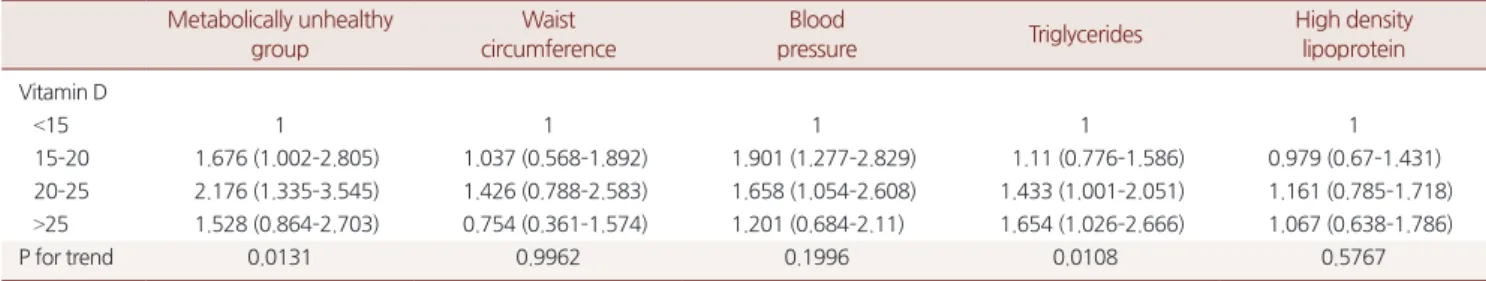
Age, sex, BMI, alcohol, smoking, and exercise-adjusted OR for the metabolically unhealthy group and its risk factors were analyzed accord- ing to serum levels of 25(OH)D (Table 2). The OR for prevalence of poor metabolic health and elevated TG showed a tendency to decrease as se- rum levels of 25(OH)D decreased (P for trends=0.013 and 0.01, respec- tively).
DISCUSSION
In this study, we investigated whether circulating levels of 25(OH)D are associated with metabolic health in adults with T2DM. Primary care
Metabolically unhealthy
group 90 80 70 60 50 40 30 20 10
High density lipoprotein Proportionofmetabolically unhealthygroupandits components(%)
Metabolically unhealthy group and its components 0
<15 15 20 20 25
>25
Waist circumference
Blood pressure
Triglycerides
*
* *
Figure 2. Proportion of the metabolic unhealthy group and the com- ponents of metabolic syndrome is presented according to the serum 25(OH)D levels. Serum 25(OH)D levels are indicated by different col- ors. 25(OH)D, 25-hydroxyvitamin D. *P-value <0.05 by chi-square test.
0, 1 2 3 4 5
100
75
50
25 Proportionofmetabolicrisk factors(%)
No. of risk factors of metabolic syndrome 0
20 25
>25 15 20 <15
10.1
30.6
33.6
25.7
16.8
27.1
33.4
22.7
11.9
18.1
33.8
36.2
12.4
21.8
29.5
36.4
11.0 14.2
34.2
40.5
Figure 3. Proportion of the metabolic risk factors in metabolically un- healthy group according to the number of metabolic risk factors with distribution of serum 25(OH)D concentration among Korean adults (n=1,345) aged older than 19 years, Korea National Health and Nutri- tion Examination Survey 2011–2012. Serum 25(OH)D levels are indi- cated by different colors. 25(OH)D, 25-hydroxyvitamin D.
Rosa Jin, et al. Vitamin D Levels and Metabolic Health in Type 2 Diabetes
Korean Journal of Family Practice
KJFP
physicians often meet diabetic patients with comorbidities and vitamin deficiency. Our results show that lower serum 25(OH)D was associated with an increase in the number of metabolic risk factors, i.e., increased WC and elevated TG.
Vitamin D is a multifunctional hormone that is synthesized from sun exposure and obtained from the diet. Although its main role is calcium and phosphorus maintenance in the blood, recent findings show that lower vitamin D levels are associated with an increased risk of various diseases, such as cancer, hypertension, and cardiovascular disease.14)
Several studies have demonstrated that vitamin D is associated with glucose homeostasis, which could be mediated by its direct action on b–
cell function.15) In another study, a significant inverse association be- tween serum 25(OH)D and T2DM was observed.16) BMI was the key confounding factor since obesity correlated with low vitamin D and high T2DM risk.16-18) Other previous studies have found an inverse association between vitamin D status and metabolic syndrome.19) This study hy- pothesized that vitamin D may not be inversely related with diabetes if the key confounding factor, BMI, is not included, and the study is de- signed to measure the relationships as the number of metabolic risk fac- tors increase.
Our study showed that two metabolic risk factors (WC and TG) were inversely associated with 25(OH)D levels. Moreover, as metabolic risk factors increased, vitamin D levels tended to decrease. Smoking, alcohol consumption, lower household income, and exercise had in influence on metabolic health in this study. In the total study population after adjust- ing for confounding variables such as age, sex, BMI, smoking, alcohol and exercises, an inverse relationship was observed between serum 25(OH)D and prevalence of poor metabolic health and TG levels. Levels of serum 25(OH)D were significantly associated with the metabolically
unhealthy group, with ORs (95% CIs) of 1.676 (1.002–2.805) and 1.528 (0.864–2.703) for subjects who had the lowest and highest serum 25(OH) D, respectively (P for trends=0.013 and 0.01, respectively). Furthermore, the adjusted OR for elevated TGs increased as serum 25(OH)D increased.
Vitamin D’s role within the pathogenesis of dyslipidemia is not known, but few studies have shown serum 25(OH)D to be positively associated with HDLC.20) However, our results showed that vitamin D status was not associated with HDLC.
This study had several strengths. First, the study used representative data of the general South Korean population. Second, rigorous quality controls were applied to the study procedure in KNHANES.
Our study also had several limitations. First, it is difficult to clarify cause-and-effect relationships because this was a cross-sectional designed study. Second, vitamin levels from 20 to 25 nmol/L showed a better meta- bolic profile than vitamin levels over 25 nmol/L. We could not consider factors that caused this result, but this may be due to the effect of vitamin D supplementation. The number of adults taking vitamin supplementa- tion should have been collected. Second, we did not consider participants’
amount of sunlight exposure, which may have affected serum 25(OH)D levels. Serial measurement over a year would be required for more accu- rate studies in the future.
In summary, low serum 25(OH)D concentration is associated with poor metabolic health in diabetic adults in Korea. Specifically, one com- ponent, total TG levels, significantly increased as serum 25(OH)D levels increased.
Table 2. ORs of not having metabolic syndrome with increasing serum 25(OH)D levels analyzed by multinomial logistic regression, adjusted for vari- ables associated with metabolic risk factors
Metabolically unhealthy group
Waist circumference
Blood
pressure Triglycerides High density
lipoprotein Vitamin D
<15 1 1 1 1 1
15–20 1.676 (1.002–2.805) 1.037 (0.568–1.892) 1.901 (1.277–2.829) 1.11 (0.776–1.586) 0.979 (0.67–1.431) 20–25 2.176 (1.335–3.545) 1.426 (0.788–2.583) 1.658 (1.054–2.608) 1.433 (1.001–2.051) 1.161 (0.785–1.718) >25 1.528 (0.864–2.703) 0.754 (0.361–1.574) 1.201 (0.684–2.11) 1.654 (1.026–2.666) 1.067 (0.638–1.786)
P for trend 0.0131 0.9962 0.1996 0.0108 0.5767
Values are presented as OR (95% confidence interval) with serum 25(OH)D <15 as the reference for having metabolic syndrome. For example, a person with serum 25(OH)D >25 in the metabolically unhealthy group is 1.528 times less likely to have metabolic syndrome. Adjusted for age, sex, body mass index, alcohol, smoking, and exercise.
OR, odds ratio; 25(OH)D, 25-hydroxyvitamin D.
진로사 외. 제2형 당뇨가 있는 성인에서의 대사건강 상태와 비타민 D의 연관성 Korean Journal of Family Practice
KJFP
요 약
연구배경: 비타민 D (25(OH)D) 의 결핍은 당뇨 및 대사증후군과 연
관성이 있는 것으로 나타났다. 본 연구는 제2형 당뇨가 있는 성인에
서 비타민 D의 수치와 대사건강 상태를 평가하였다.
방법: 본 연구는 국가자료인 제5기 국민건강영양조사 자료(2011-
2012)를 이용하여 제2형 당뇨를 가진 성인(n=1,353)에서 다변수 로지 스틱회귀분석을 사용하였으며 중첩변수를 조정하였다.
결과: 대사건강 상태가 나쁜 당뇨환자에서 정상 대사를 가진 당뇨
환자군 보다 혈중 25(OH)D 수치가 낮게 측정되었다. 대사가 건강하
지 않은 환자에서 혈중 25(OH)D 수치가 증가할수록 허리둘레와 중 성지방 수치가 유의하게 낮게 측정되었다. 25(OH)D 수치와 대사증 후군의 요소의 수는 역관계를 보였다(P=0.029). 또한 대사건강이 나 쁜 환자군과 중성지방이 높은 환자군 각각에서 조정된 오즈비의 분
석 결과 25(OH)D 수치가 높을수록 대사증후군이 있을 확률이 낮았
다(P for trend=0.013, 0.01, respectively).
결론: 낮은 25(OH)D 수치는 나쁜 대사건강을 가지고 있는 당뇨 환자
와 연관성이 있었으며, 이는 대사증후군의 위험인자인 중성지방의 상승과 관련있었다.
중심단어: 비타민 D; 대사증후군; 제2형 당뇨 REFERENCES
1. Isomaa B, Almgren P, Tuomi T, Forsen B, Lahti K, Nissen M, et al. Cardiovas- cular morbidity and mortality associated with the metabolic syndrome. Di- abetes Care 2001;24:683-9.
2. Grundy SM, Cleeman JI, Daniels SR, Donato KA, Eckel RH, Franklin BA, et al. Diagnosis and management of the metabolic syndrome: an American Heart Association/National Heart, Lung, and Blood Institute Scientific Statement. Circulation 2005;112:2735-52.
3. Solomon CG, Manson JE. Obesity and mortality: a review of the epidemio- logic data. Am J Clin Nutr 1997;66(4 Suppl):1044S-1050S.
4. Arnlov J, Sundstrom J, Ingelsson E, Lind L. Impact of BMI and the metabolic syndrome on the risk of diabetes in middle-aged men. Diabetes Care 2011;34:61-5.
5. Ruderman NB, Schneider SH, Berchtold P. The “metabolically-obese,” nor-
mal-weight individual. Am J Clin Nutr 1981;34:1617-21.
6. Bischoff-Ferrari HA, Giovannucci E, Willett WC, Dietrich T, Dawson- Hughes B. Estimation of optimal serum concentrations of 25-hydroxyvita- min D for multiple health outcomes. Am J Clin Nutr 2006;84:18-28.
7. Holick MF. Vitamin D deficiency. N Engl J Med 2007;357:266-81.
8. Langman CB. New developments in calcium and vitamin D metabolism.
Curr Opin Pediatr 2000;12:135-9.
9. Cheng S, Massaro JM, Fox CS, Larson MG, Keyes MJ, McCabe EL, et al. Adi- posity, cardiometabolic risk, and vitamin D status: the Framingham Heart Study. Diabetes 2010;59:242-8.
10. Chowdhury TA, Boucher BJ, Hitman GA. Vitamin D and type 2 diabetes: Is there a link? Prim Care Diabetes 2009;3:115-6.
11. The Fifth Korea National Health and Nutrition Examination Survey (KNHANES V-2, 3). Cheongju: Korea Centers for Disease Control and Pre- vention; 2011-2012.
12. International Physical Activity Questionnaire Core Group. Guidelines for data processing and analysis of the International Physical Activity Ques- tionnaire-short and long forms [Internet]. [place unknown]: International Physical Activity Questionnaire Core Group; 2005 [cited 2013 Oct 25].
Available from: http://www.ipaq.ki.se/scoring.pdf.
13. Expert Panel on Detection, Evaluation, and Treatment of High Blood Cho- lesterol in Adults. Executive summary of the third report of the National Cholesterol Education Program (NCEP) Expert Panel on Detection, Evalu- ation, and Treatment of High Blood Cholesterol in Adults (Adult Treatment Panel III). JAMA 2001;285:2486-97.
14. Rosen CJ, Adams JS, Bikle DD, Black DM, Demay MB, Manson JE, et al. The nonskeletal effects of vitamin D: an Endocrine Society scientific statement.
Endocr Rev 2012;33:456-92.
15. Kayaniyil S, Vieth R, Retnakaran R, Knight JA, Qi Y, Gerstein HC, et al. Asso- ciation of vitamin D with insulin resistance and beta-cell dysfunction in subjects at risk for type 2 diabetes. Diabetes Care 2010;33:1379-81.
16. Isaia G, Giorgino R, Adami S. High prevalence of hypovitaminosis D in fe- male type 2 diabetic population. Diabetes Care 2001;24:1496.
17. Mattila C, Knekt P, Mannisto S, Rissanen H, Laaksonen MA, Montonen J, et al. Serum 25-hydroxyvitamin D concentration and subsequent risk of type 2 diabetes. Diabetes Care 2007;30:2569-70.
18. Grimnes G, Emaus N, Joakimsen RM, Figenschau Y, Jenssen T, Njolstad I, et al. Baseline serum 25-hydroxyvitamin D concentrations in the Tromso Study 1994-95 and risk of developing type 2 diabetes mellitus during 11 years of follow-up. Diabet Med 2010;27:1107-15.
19. Awad AB, Alappat L, Valerio M. Vitamin d and metabolic syndrome risk factors: evidence and mechanisms. Crit Rev Food Sci Nutr 2012;52:103-12.
20. Hypponen E, Boucher BJ, Berry DJ, Power C. 25-hydroxyvitamin D, IGF-1, and metabolic syndrome at 45 years of age: a cross-sectional study in the 1958 British Birth Cohort. Diabetes 2008;57:298-305.