ABSTRACT
Traumatic brain injury (TBI) is a major health and socio-economic problem worldwide that mainly affects young adults. Neuroimaging plays a critical role in the diagnosis and evaluation of patients with TBI. Some patients with mild TBI have variable neurological symptoms. In such patients, computed tomography and magnetic resonance imaging (MRI) can present normal findings. Advanced imaging techniques, such as diffusion tensor imaging, magnetic resonance spectroscopy, perfusion weighted imaging, or functional MRI, can reveal abnormalities that are not detected using conventional imaging methods. Here, I briefly review current neuroimaging for TBI and survey advanced imaging techniques in terms of structural and functional aspects, which include a few promising areas of TBI research.
Keywords: Head injury; Neuroimaging; Trauma; Diffusion tensor imaging;
Functional neuroimaging
INTRODUCTION
Traumatic brain injury (TBI) is a major health and socio-economic problem worldwide, affecting around 1.7 million Americans each year.17-25) TBI is also the leading cause of mortality and morbidity among young people,19) including sport-related head injuries25) and rotational acceleration, which can cause cerebral concussion.25)
Imaging plays a crucial role in the evaluation, diagnosis, and triaging of patients with TBI.
Recent studies have also suggested that imaging helps predict patient outcomes. In mild TBI (mTBI), computed tomography (CT) and conventional magnetic resonance imaging (MRI) often present normal findings, without anatomical lesions.4,17) Therefore, advanced neuroimaging techniques are needed to diagnose mTBI and predict prognosis.
The commonly used neuroimaging methods for the clinical evaluation of TBI include non- contrast CT and brain MRI sequences (T1-weighted, T2-weighted, fluid-attenuated inversion recovery [FLAIR], diffusion-weighted, and often T2* imaging including gradient-echo imaging or susceptibility weighted imaging [SWI]), which can also detect acute or recent intracranial damage, and the chronic sequelae of TBI, such as encephalomalacia or chronic hemorrhage.
Review Article
Received: Apr 2, 2020 Accepted: Apr 14, 2020 Address for correspondence:
A Leum Lee
Department of Radiology, Soonchunhyang University Bucheon Hospital, 170 Jomaru-ro, Bucheon 14584, Korea.
E-mail: [email protected]
Copyright © 2020 Korean Neurotraumatology Society
This is an Open Access article distributed under the terms of the Creative Commons Attribution Non-Commercial License (https://
creativecommons.org/licenses/by-nc/4.0/) which permits unrestricted non-commercial use, distribution, and reproduction in any medium, provided the original work is properly cited.
ORCID iDs A Leum Lee
https://orcid.org/0000-0001-7662-4264 Conflict of Interest
The author has no financial conflicts of interest.
A Leum Lee
Department of Radiology, Soonchunhyang University Bucheon Hospital, Korea
Advanced Imaging of Traumatic Brain
Injury
Advanced neuroimaging techniques have shown the potential for evaluating mTBI. However, as yet, they do not play a standardized role in the diagnosis and management of mTBI diagnosis because they require further validation. Currently, there is little evidence to support the routine clinical use of advanced neuroimaging techniques for diagnosis and prediction at an individual patient level (class IIb recommendation).38) Current neuroimaging recommendations for patients with TBI are summarized in TABLE 1. Advances in MRI-based neuroimaging techniques, such as diffusion tensor imaging (DTI), functional MRI, magnetic resonance spectroscopy (MRS), and perfusion imaging, have shown potential.34) Advanced imaging techniques are considered an active research and development area, as they target the 2 main concerns of evaluating mTBI and obtaining the prognostic information of TBI severity.38) The recent advanced neuroimaging methods for TBI are categorized as structural or functional biomarker techniques. This article reviews advanced traumatic neuroimaging regarding these 2 categories.
STRUCTURAL IMAGING
Microhemorrhage SWI
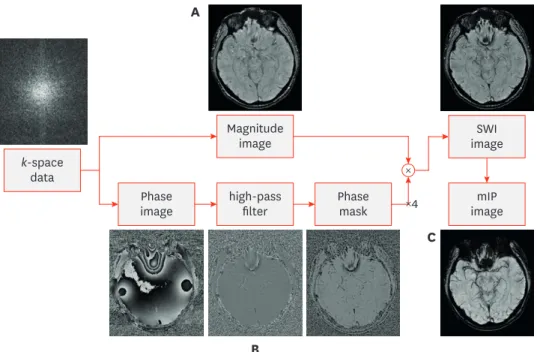
The detection of microhemorrhages is considered important because hemorrhages frequently accompany diffuse axonal injury (DAI). It is well known that SWI reinforces susceptibility effects by manipulating magnitude images with phase information (FIGURE 1). The susceptibility effect that is induced by gradient-recalled echo and SWI sequences causes microhemorrhages to appear more conspicuous relative to other pulse sequences. This technique is 3-to-6 times more sensitive than conventional T2*-GRE sequences in detecting hemorrhagic lesions.29) The phase images are sensitive to regions of local magnetic field alterations (i.e., susceptibility) caused by various substances, such as iron and other metals, as well as hemorrhages. Therefore, SWI is expected to be sensitive to detecting microhemorrhages 12)
Quantitative susceptibility mapping (QSM)
QSM is used to quantify total magnetic susceptibility changes in brain tissue composition that reflect the actual spatial extent of lesions. This technique can also non-invasively measure total iron accumulation in micro-hemorrhages and other lesions including neurodegenerative change (FIGURE 2). As a quantitative extension of SWI, QSM uses TABLE 1. Recommendations for neuroimaging in traumatic brain injury
Neuroimaging modality
or sequence TBI indication or specific situation Recommendation
Non-contrast head CT First-line examination for acute mild, moderate, and severe TBI Class I
Non-contrast head CT Repeat evaluation in acute TBI with neurological decline Class I
Non-contrast head CT Careful use in mild pediatric TBI Class I
Non-contrast head CT Repeat assessment of mild TBI with negative initial NCCT results Class III
CTA of the brain Suspected vascular injury/trauma Class IIa
Brain MRI without contrast Acute or subacute TBI and initial or follow-up NCCT is negative with remained neurologic findings Class I
T2
*
and SWI Acute, early subacute, and chronic stages of diffuse axonal injury Class IIaBrain MRI with contrast Can benefit in visualizing subacute brain contusions Class IIb
Advanced neuroimaging* Mild TBI with negative conventional CT and MRI Class IIb
CT: computed tomography, CTA: computed tomography angiography, NCCT: non-contract computed tomography, SWI: susceptibility-weighted imaging, TBI:
traumatic brain injury, MRI: magnetic resonance imaging.
*Advanced neuroimaging: MRI diffusion tensor imaging, blood oxygen level-dependent functional MRI, magnetic resonance spectroscopy, perfusion imaging, positron emission tomography/single-photon emission CT, and magnetoencephalography (discussed in reference 37).
information extracted from multi-echo MRI acquisitions to assess an isotropic magnetic susceptibility tensor for each tissue voxel (FIGURE 3)22) Quantification of the isotropic brain magnetism can reveal changes in components such as ferritin, hemosiderin, water, myelin, and calcium in each brain tissue and QSM also resolves the blooming artifacts of SWI and
Magnitude image k-space
data
high-pass filter
imageSWI
imagemIP Phase
Phase mask image
× A
B
C
×4
FIGURE 1. Acquisition and post-processing of susceptibility weighted imaging. (A) Magnitude image, acquisition of T2
*
-weighted sequence to enhance the visibility of susceptibility differences using high-resolution three- dimensional gradient echo. (B) Phase image, accumulation of phase information and filtering to accentuate the signal change. (C) Post-processing.SWI: susceptibility weighted imaging.
A B
FIGURE 2. Quantitative susceptibility map. (A) Healthy control, note normally detected ion deposition in bilateral basal ganglia. (B) Vascular dementia patient in a 69-year old male with microhemorrhages: well visualization of prominent iron accumulation in bilateral basal ganglia and several iron depositions in bilateral thalamus and subcortical white matter, suggestive of microhemorrhage.
may potentially offer improved visualization of susceptibility variations.8) Nevertheless, still limitation of expensive post-processing cost and process, as well as conventional SWI, QSM has potential to recognize regions of focal tissue injury in TBI patients8)
Brain contusion
Three-dimensional (3D) thin section T2/T2-FLAIR imaging
As MRI hardware and techniques have advanced, thin section imaging techniques have become possible through 3D T2-FLAIR and T2WI acquisitions, which are also useful for detailed contusion evaluations.
In the recently established Imaging Common Data Elements,14) the use of the term traumatic axonal injury (TAI) is reserved for one-to-3 axonal injury foci as identified upon brain imaging, and the use of DAI is reserved for the identification of 4 or more such foci. Of course, these and other definitions will continue to evolve as current advanced neuroimaging techniques, such as T2-FLAIR and T2WI 3D thin section acquisitions, allow greater
sensitivity for non-hemorrhagic lesions that are occult to the current routine MRI techniques (FIGURE 4). Characteristic locations for TAI lesions include the gray-white matter junction.
Strich,32) building on the early classic work by Mäkelä,24) proposed that such white matter injuries result from rotational acceleration due to shear-strain deformation of the brain at interfaces between tissues of different densities. Previously, it was thought based on postmortem studies of patients with fatal TBI that axonal injury was generally diffuse and associated with high morbidity and mortality.7) It is now known that TAI is extremely common and is by no means limited to only patients with moderate and severe TBI. Furthermore, TAI is observed frequently in mTBI.39) In early pathologic studies, TAI has been reported to occur commonly in the lobar white matter, particularly in the frontal and temporal lobes (approximately 50% of TAI detected by conventional MRI sequences), corpus callosum (approximately 22% of lesions, with most lesions in the splenium), corona radiata (19%), internal capsule (8%), and dorsolateral midbrain and rostral pons (<8%).12) Many recent DTI studies have complemented these historical results and expanded upon the locations that are typical for TAI.12).
CT has extremely poor sensitivity for TAI, virtually no sensitivity for non-hemorrhagic TAI, and only limited sensitivity for hemorrhagic TAI, compared with MRI.33) Among the current
A B C
GRE SWI QSM
+1,000 ppb
−1,000 ppb
FIGURE 3. (A) GRE, (B) SWI, and (C) QSM images in a patient with TBI. The arrows indicate a CMH that is visible on SWI, GRE, and QSM images. The arrowheads indicate another CMH that is visible on SWI and QSM images, but not the GRE image. Figure reproduced permission from reference 22.
GRE: gradient-echo, TBI: traumatic brain injury, SWI: susceptibility weighted imaging, QSM: quantitative susceptibility mapping, CMH: cerebral microhemorrhage, ppb = parts per billion.
structural MRI sequences, T2*-weighted gradient-echo and SWI have the highest sensitivity for hemorrhagic shear injuries.35)
In a recent study of TBI in military personnel from blast exposures, the most common pathologic magnetic resonance (MR) finding was T2-weighted hyperintense areas in the white matter, which was observed in 51.8% of participants (432 of 834; odds ratio [OR], 1.75). In contrast, microhemorrhages were only present in a small percentage of the patients with chronic TBI (7.2% [60 of 834]; OR, 6.64), and the T2-weighted hyperintense areas and cerebral microhemorrhages did not collocate in this cohort.22)
Diffusion weighted imaging (DWI)
DWI is sensitive in the acute-to-early subacute stage (within one to a few days after injury).
This technique evaluates the microscopic motion of water molecules in the brain tissue and is complementary to T2*-weighted gradient-echo and SWI, as it can depict non- hemorrhagic axonal injury foci that are otherwise invisible to T2*-weighted imaging.18) DWI has a high sensitivity for acute TAI, the lesions of which present as foci with reduced diffusion, although the diffusion coefficient normalizes within hours to a few days and elevates in the chronic stage.
Acutely, and beyond the acute time frame during which DWI is sensitive for TAI/DAI, shear injury foci may be visible on FLAIR and T2-weighted images (FIGURE 5). However, unless the foci are seen in a location that is relatively specific for TAI (e.g., the corpus callosum, which is uncommonly affected by chronic small vessel ischemic disease), they are often indistinguishable from the small areas of gliosis due to other causes, particularly chronic small vessel ischemic disease that is common after middle age. Shear injuries are also indistinguishable from white matter lesions that are due to other, less common etiologies, such as remote infection, demyelinating disease, migraine headaches, and vasculitides.
A B
FIGURE 4. 3D-T2WI is useful in demonstrating post-traumatic encephalomalacia. Compare and note this focal cerebromalacic lesion with gliosis in left frontal lobe on both axial T2 weighted image (A) and 3D-T2 weighted turbo-spine echo image (B).
3D: three-dimensional.
Brain atrophy 3D isotopic T1WI
MRI is an excellent modality for assessing global and regional atrophies in mTBI and following their longitudinal evolution. To date, only a few studies have investigated atrophy in mTBI. Notably, Zhou et al.40) suggested that measurable atrophy in mTBI occurred around 1 year after the insult. Regional atrophy was also observed in the anterior cingulate, cingulate gyrus, and the right precuneus gray matter.
Recently, the development of 3D isotropic short-echo time spoiled gradient-recalled echo and magnetization-prepared rapid gradient-echo sequence imaging have been used to acquire brain volume data and assess TBI-related brain atrophy. Many studies have reported post-TBI associated brain atrophy correlates with the severity of the injury, combined with initial Glasgow Coma Scale score, Glasgow Outcome Scale score, or coma duration. These factors, in addition to changes in global brain volume, have been considered quantitative markers of cellular loss and axonal degeneration and have been found to correlate with coma length and outcomes14) (FIGURE 6).5) Recently development of volumetric analysis software analyzes brain MRI to improve the early
A B C D
FIGURE 5. DAI in a 48-year-old male with nonaccidental trauma. (A) DAI on T2 fluid-attenuated inversion recovery image demonstrates several high SI lesions in corpus callosum. (B-D) Diffuse axonal injury lesion in corpus callous splenium is shown high SI on T2WI and diffusion restriction on diffusion weighted imaging and apparent diffusion coefficient map.
DAI: diffuse axonal injury, SI: signal intensity.
A B
FIGURE 6. (A) T1-weighted coronal images of a TBI patient on the left and an age-matched control on the right, both young adolescent males. Upper left-hand arrows point to a prominent interhemispheric fissure and cortical sulci, reflective of whole brain volume loss and generalized cerebral atrophy in the TBI patient.
The lower arrow indicates to an atrophic hippocampus and enlarged temporal horn, bilaterally in the TBI patient. (B) Anterior-posterior view of the three- dimensional reconstructed brain of the individual with TBI showing global frontal atrophy with noticeably wider cortical sulci compared to the age-match control subject on the right. Reproduced with permission from reference 5.
TBI: traumatic brain injury.
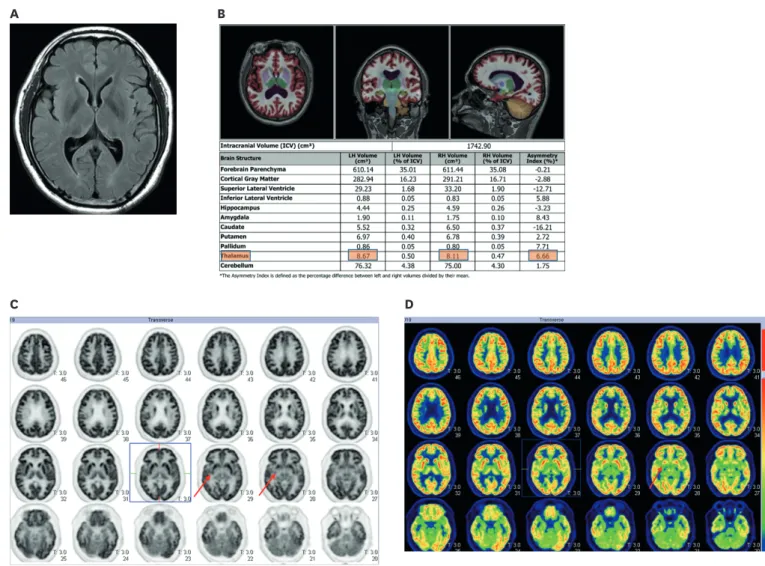
detection of brain atrophy in TBI as well as, neurodegenerative disease and other disease entities (e.g., dementia, Alzheimer's disease, multiple sclerosis and epilepsy) (FIGURE 7).
ADVANCED IMAGING
The role of advanced imaging techniques
Currently, the research and development of advanced imaging techniques is a key area, with 2 main goals: evaluating mTBI and obtaining prognostic information for all levels of TBI severity. While promising, the clinical applications of these techniques are currently limited.
Presently, none of these advanced MR techniques are recommended by the American College of Radiology appropriateness guidelines for the routine evaluation of patients with TBI.37) However, familiarity with these modalities and their new application is meaningful, as they may benefit subgroups of current patients, and their use is likely to increase in the future.
C
A B
D
FIGURE 7. Volume segmentation and analysis through computer automated brain volume analysis software (NeuroQuant, an Food and Drug Administration- cleared method for measuring brain magnetic resonance volume) and PET-CT image in a 44-year-old male traumatic brain injury patient. (A) Axial T2 fluid- attenuated inversion recovery image demonstrates no obvious lesion in brain. (B) On volume analysis report, slight asymmetrical atrophy in right thalamus, compared to left side. (C, D) On PET-CT, slight decreased metabolism in related right thalamus is noted.
PET-CT: positron emission tomography-computed tomography, ICV: intracranial volume, LH: left hemisphere, RH: right hemisphere.
DTI
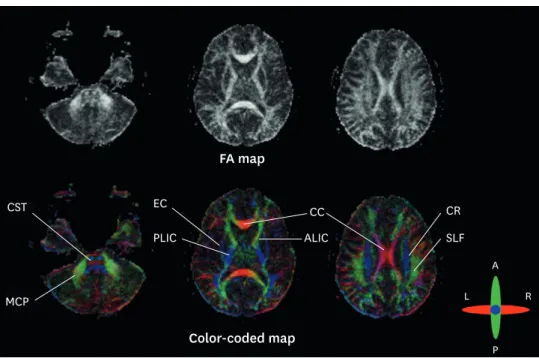
DTI is a more advanced technique that is based on DWI and enables the characterization of water diffusion directionality in 3D space.28) Within normal white matter tracts with their parallel fiber bundles, water diffuses more freely along the direction of the white matter fibers than transverse to the fibers. Generally, normal myelinated white matter tracts exhibit highly directional diffusion, whereas damaged white matter tracts are thought to demonstrate more isotropic diffusion,28) possibly because of a local decrease in longitudinally focused microstructural elements, such as the myelin sheath and axolemma. This property allows DTI to be utilized as a biomarker for white matter pathologies, including TBI. DTI builds upon conventional DWI by adding the ability to determine the 3D directionality and magnitude (tensor) of water motion. This is accomplished by acquiring at least 6 non-collinear diffusion gradient directions. DTI can quantify diffusion using a variety of parameters, the most common of which are fractional anisotropy (FA), which calculates the anisotropy within a voxel, and mean diffusivity (MD), which quantifies the average magnitude of diffusivity over all sampled directions. This is well illustrated in FIGURE 8.
TBI-associated changes in DTI scalar metrics have been well-documented, especially for
FA.3,31) In addition to measuring a variety of DTI metrics, data processing, and analysis
techniques have been developed to inspect data for visualization abnormalities in gray matter and white matter tracts.31) With regards to white matter tracts, the diffusion tensor model is not capable of resolving multiple fiber orientations within a voxel, and improved diffusion models and analysis methods are under active development. Diffusion kurtosis imaging20) uses a minimum of 3 b-values (instead of the typical 2 for DTI, e.g., 0, 1,000, 3,000), which provides additional metrics related to non-Gaussian (kurtosis) diffusion that to allow more
FA map CST
MCP
EC
PLIC
CR SLF CC
ALIC
Color-coded map
A
P R L
FIGURE 8. Diffusion tensor imaging parameter: FA map and color-coded map. On FA map, CC or CST demonstrate high FA value, with high directionality. Color DTI anisotropy map overlaid onto a T1 post-contrast image. The color DTI anisotropy is based on the composite of multiple diffusion-sensitizing gradient images. Note that there are multiple colors within the white matter map with red indicating transverse direction (e.g., CS and CST), blue indicating superior–inferior direction (CR) and green indicating anterior-posterior direction (e.g., SLF).
FA: fractional anisotropy, CC: corpus callosum, SLF: superior longitudinal fiber, CS: centrum semiovale, CST:
corticospinal tract, CR: corona radiata, DTI: diffusion tensor imaging.
physiologic bases for white matter modeling,9) resolving fiber crossings,21) Q-ball imaging36) (which assumes a Gaussian model), and constrained spherical deconvolution (which creates a model based on the actual diffusion acquisition that is used for deconvolution and produces very sharp fiber-orientation distribution functions). However, further studies are needed to determine if one of these approaches is more advantageous than the others.
The improvement of data quality through high-order eddy current correction, distortion correction, and high-order seaming should increase data fidelity and increase the reliability of subsequent data processing.37)
Most TBI studies have reported decreases in FA and increases in MD, thought to be secondary to demyelination or interruption of tissue microstructural peculiarities.21,31,36) In acute TBI, DTI parameter might aid to diagnosis and predict interruption of tissue integrity in brainstem (FIGURE 9); Kernohan's notch phenomenon.
A recent study reported limited MD changes, in particular regarding white matter tracts.15) According to Yuh et al.,39) the prognostic utility of DTI parameters was superior to CT, clinical, demographic, and socio-economic variables as predictors of 3- and 6-month outcomes at both group and individual patient levels. Such studies emphasize the diagnostic and prognostic potential of DTI for patients and may soon lead to consensus guidelines for the application of DTI parameters in TBI imaging.26)
A
B
C
D
E
F
FIGURE 9. Kernohan's notch phenomenon. (A, B) On pre-contrast brain computed tomography, diffuse acute epidural and subdural hematoma are noted along the bilateral frontal convexities, causing mild subfalcine and transtentorial herniation. Diffuse acute subarachnoid hemorrhage is obliterating the basal cistern. (C, D) On T2-weighted and T2-fluid-attenuated inversion recovery imaging, after the emergency epidural hemorrhage removal, there is a focal high SI lesion (white arrow) in the right cerebral peduncle, suggestive of a contusion.
(E, F) For assessment of Kernohan's notch phenomenon, we acquired a diffusion tractography imaging image of the corticospinal tract and brain stem structures. On the FA map (E), decreased FA value in right midbrain and weaker purple color in the right midbrain on color coded FA map (F).
FA: fraction anisotropy.
MRS
MR spectroscopy is governed by the same physical magnetism principles as MRI. While MRI data are investigated in the time domain to obtain T1 and T2 relaxation times and then processed to generate an anatomic image, MR spectroscopy data are converted to frequency domain information and managed to form a spectrum of the signal intensities of different brain metabolites, according to their Larmor resonance frequencies.37) The peaks for particular metabolites have characteristic locations along a spectrum (chemical shift), and their
concentrations can be measured as the area under their respective peak. MR spectroscopy can be achieved using single-voxel spectroscopy, or 2D or 3D multivoxel chemical shift techniques (MR spectroscopic imaging or chemical shift imaging). Single-voxel spectroscopy has a greater signal-to-noise ratio and is more robust, but only a single spectrum is obtained, and the volume of interest placement is crucial.37) The metabolites that are commonly measured in the brain, with intermediate (time to echo [TE]=144 ms) to long (TE=280 ms) TEs, include N-acetylaspartate (NAA) for neuronal viability, creatine (Cr) for cellular energy utilization, choline (Cho) for membrane turnover, and lactate for anaerobic metabolism. At shorter TEs (TE=35 ms), metabolites with shorter T2 relaxation times can be detected, such as glutamate/
glutamine (Glx), markers of excitatory neurotransmission, markers released after brain injury, and myo-inositol (mI), a marker of membrane turnover and possibly reactive gliosis.10) Spectroscopic studies that have been performed shortly after TBI have shown consistent imaging patterns that manifest as increased Cho and decreased NAA in regions of the adult brain that are known to be most susceptible to shear injuries16) (FIGURE 10). These metabolic changes are thought to suggest TAI, particularly when they occur in the absence of visible injury on conventional anatomic imaging.30) Longitudinal studies in patients with mTBI have shown these changes to be transient, upon normalization of NAA, Cho, and Glx peaks.
8 9 10 11 12
FIGURE 10. Multi-voxel-based spectroscopy after traumatic brain injury. Spectroscopy in ROI, #8 shows normally low Cho peak (blue arrow) and normal NAA peak, contrast to increased Cho and decreased NAA in ROI #12, correlating to shear injury or contusion.
ROI: region of interest, Cho: choline, NAA: N-acetylaspartate.
Interestingly, Cho and mI peaks remain elevated in the chronic stage, and these elevations have been attributed to proliferative astrogliosis.2) For severe TBI, Cho elevations that peak in the parietal white matter and Glx elevations that peak in the occipital gray matter, 7 days after injury, have been shown to have prognostic value with respect to clinical outcomes. In children, the presence of abnormal lactate, Cho, and NAA has been associated with poor long-term neuropsychological outcomes.2) However, correlations between MRS findings and mTBI outcomes have been more limited. A recent prospective study found that centrum semiovale Cr levels positively correlate with decreased neuropsychiatric metric performance, as assessed 6 months after injury.13) Clinical MRS applications for TBI have also been limited due to their significant overlap with the spectral changes that are seen in a number of other brain disorders, which lowers the specificity of MRS for TBI.26)
Perfusion weighted imaging (PWI)
TBI is associated with impaired cerebrovascular autoregulation, increased blood-brain barrier permeability, and vascular injuries, all of which can lead to altered cerebral blood flow (CBF), ischemia, and even infarction.6) For these reasons, cerebral perfusion has long been a target for imaging interrogation. Numerous techniques have been employed in the literature, including single-photon emission computed tomography (SPECT)1), positron emission tomography (PET) (FIGURE 7), xenon-enhanced computed tomography (Xe- CT), perfusion CT (CTP), and dynamic susceptibility contrast (DSC), and as mentioned above, arterial spin-labeling (ASL)13) perfusion MR.26) Each of these techniques has relative advantages and disadvantages. Specifically, SPECT and DSC perfusion studies only allow for qualitative comparisons between regions of the brain,37) while PET, Xe-CT, CTP, and ASL are quantitatively accurate. Few studies have evaluated the utility of perfusion-weighted MR techniques in TBI, and the most utilized MR perfusion technique is DSC imaging.
Using this technique, Garnett and colleagues11) measured reduced cerebral blood volume (CBV) in contusion areas, as well as in a subset of patients with normal brain parenchyma.
Interestingly, although the sample size was small, reduced CBV was noted on DSC MRI, even in patients with otherwise normal MRIs. These findings correlated with worse clinical outcomes.11) ASL is an alternative MR perfusion technique that does not require intravenous contrast. In patients with mTBI undergoing ASL imaging, decreased regional CBF in the thalamus was found to strongly correlate with neurocognitive impairment.13) While these studies were too underpowered to allow the prognostic capacity of ASL perfusion to be adequately evaluated in patients with mTBI, the findings were interesting.13) As with other advanced imaging techniques, more prospective and longitudinal studies are needed to determine the role of perfusion imaging in TBI evaluation.
Functional MRI
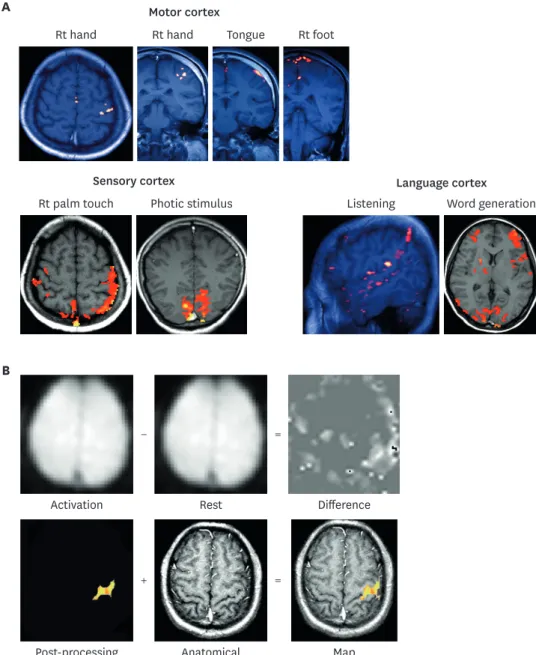
Functional MRI relies on blood oxygen level-dependent imaging and the coupling between CBF/metabolism and neuronal activity. As metabolic demand increases, there are local increases in CBF, as well as dynamic and related metabolic changes in glucose and oxygen metabolism.23,27) Basic physics of functional MRI is illustrated on FIGURE 11. Transient local increases in CBF and metabolism lead to changes in the ratio of oxygenated-to-deoxygenated hemoglobin, which, in turn, affects the MRI signal response.23,27) Blood oxygen level
dependent imaging offers millimeter-scale spatial resolution but poor temporal resolution, due to the relatively slow hemodynamic response associated with neural activity.
Although significant advances have recently been made in TBI imaging, further
improvements are needed. Advanced techniques such as DTI, MRS, PWI, and fMRI hold
great potential, and with more clinical validation and studies, they will likely move from primarily research modalities to routine clinical use. Several specific injuries show promise for future innovations, among which, mTBI and chronic traumatic encephalopathy (CTE) are of interest because of their high prevalence and lack of findings on conventional imaging modalities. The ability to glean prognostic information from imaging studies is another promising area of active research. As new neuro-therapeutic options for TBI are introduced, neuroimaging will likely guide which patients will benefit from these methods and help in evaluating their response to therapy.
Rt hand Rt hand Tongue Rt foot
Rt palm touch Photic stimulus Listening Word generation
Activation Rest Difference
Post-processing Anatomical Map
Motor cortex
Sensory cortex Language cortex
A
B
− =
+ =
FIGURE 11. Physics of functional magnetic resonance image acquisition. (A) Resting state functional MRI. (B) Task-based functional MRI. Functional MRI with blood oxygen level dependent contrast depends on the balance between O2 supply and consumption by the neural tissues.
Rt: right, MRI: magnetic resonance imaging.
CONCLUSIONS
TBI is a major health problem worldwide. In the future, the clinical use of advanced
neuroimaging methods that specialize in delineating hemorrhages, white matter fiber tracks, ischemia, and blood-brain barrier disruption should ensure standardized approaches to image acquisition and analysis, improve prognostic accuracy, and facilitate the development of new therapies.
ACKNOWLEDGMENTS
I wish to thank Professor Sun-Chul Hwang for his helpful suggestions in preparing this manuscript. This study was supported by the National Research Foundation of Korea (NRF- 2019R1G1A1099493) and the Soonchunhyang University Research Fund.
REFERENCES
1. Abu-Judeh HH, Singh M, Masdeu JC, Abdel-Dayem HM. Discordance between FDG uptake and technetium-99m-HMPAO brain perfusion in acute traumatic brain injury. J Nucl Med 39:1357-1359, 1998 PUBMED
2. Ashwal S, Holshouser B, Tong K, Serna T, Osterdock R, Gross M, et al. Proton spectroscopy detected myoinositol in children with traumatic brain injury. Pediatr Res 56:630-638, 2004
PUBMED | CROSSREF
3. Basser PJ, Mattiello J, LeBihan D. Estimation of the effective self-diffusion tensor from the NMR spin echo. J Magn Reson B 103:247-254, 1994
PUBMED | CROSSREF
4. Bazarian JJ, Zhong J, Blyth B, Zhu T, Kavcic V, Peterson D. Diffusion tensor imaging detects clinically important axonal damage after mild traumatic brain injury: a pilot study. J Neurotrauma 24:1447-1459, 2007 PUBMED | CROSSREF
5. Bigler ED. Traumatic brain injury, neuroimaging, and neurodegeneration. Front Hum Neurosci 7:395, 2013 PUBMED | CROSSREF
6. Bigler ED, Maxwell WL. Neuropathology of mild traumatic brain injury: relationship to neuroimaging findings. Brain Imaging Behav 6:108-136, 2012
PUBMED | CROSSREF
7. Cotran RS, Cotran RS, Kumar V, Robbins SL. Robbins' pathologic basis of disease, ed 4. Philadelphia, PA:
Saunders, 1989
8. DeQuesada IM 2nd, Chokshi FH. Neuroimaging of acute traumatic brain injury: emphasis on magnetic resonance imaging and prognostic factors. Semin Roentgenol 49:64-75, 2014
PUBMED | CROSSREF
9. Fieremans E, Benitez A, Jensen JH, Falangola MF, Tabesh A, Deardorff RL, et al. Novel white matter tract integrity metrics sensitive to Alzheimer disease progression. AJNR Am J Neuroradiol 34:2105-2112, 2013 PUBMED | CROSSREF
10. Garnett MR, Blamire AM, Rajagopalan B, Styles P, Cadoux-Hudson TA. Evidence for cellular damage in normal-appearing white matter correlates with injury severity in patients following traumatic brain injury: A magnetic resonance spectroscopy study. Brain 123:1403-1409, 2000
PUBMED | CROSSREF
11. Garnett MR, Blamire AM, Corkill RG, Rajagopalan B, Young JD, Cadoux-Hudson TA, et al. Abnormal cerebral blood volume in regions of contused and normal appearing brain following traumatic brain injury using perfusion magnetic resonance imaging. J Neurotrauma 18:585-593, 2001
PUBMED | CROSSREF
12. Gentry LR, Godersky JC, Thompson B. MR imaging of head trauma: review of the distribution and radiopathologic features of traumatic lesions. AJR Am J Roentgenol 150:663-672, 1988
PUBMED | CROSSREF
13. George EO, Roys S, Sours C, Rosenberg J, Zhuo J, Shanmuganathan K, et al. Longitudinal and prognostic evaluation of mild traumatic brain injury: a 1h-magnetic resonance spectroscopy study. J Neurotrauma 31:1018-1028, 2014
PUBMED | CROSSREF
14. Haacke EM, Duhaime AC, Gean AD, Riedy G, Wintermark M, Mukherjee P, et al. Common data elements in radiologic imaging of traumatic brain injury. J Magn Reson Imaging 32:516-543, 2010
PUBMED | CROSSREF
15. Hasan KM, Wilde EA, Miller ER, Kumar Patel V, Staewen TD, Frisby ML, et al. Serial atlas-based diffusion tensor imaging study of uncomplicated mild traumatic brain injury in adults. J Neurotrauma 31:466-475, 2014
PUBMED | CROSSREF
16. Henry LC, Tremblay S, Leclerc S, Khiat A, Boulanger Y, Ellemberg D, et al. Metabolic changes in concussed American football players during the acute and chronic post-injury phases. BMC Neurol 11:105, 2011
PUBMED | CROSSREF
17. Hughes DG, Jackson A, Mason DL, Berry E, Hollis S, Yates DW. Abnormalities on magnetic resonance imaging seen acutely following mild traumatic brain injury: correlation with neuropsychological tests and delayed recovery. Neuroradiology 46:550-558, 2004
PUBMED | CROSSREF
18. Huisman TAG. Diffusion-weighted imaging: basic concepts and application in cerebral stroke and head trauma. Eur Radiol 13:2283-2297, 2003
PUBMED | CROSSREF
19. Ilie G, Boak A, Adlaf EM, Asbridge M, Cusimano MD. Prevalence and correlates of traumatic brain injuries among adolescents. JAMA 309:2550-2552, 2013
PUBMED | CROSSREF
20. Jensen JH, Helpern JA. MRI quantification of non-Gaussian water diffusion by kurtosis analysis. NMR Biomed 23:698-710, 2010
PUBMED | CROSSREF
21. Jensen JH, Helpern JA, Tabesh A. Leading non-Gaussian corrections for diffusion orientation distribution function. NMR Biomed 27:202-211, 2014
PUBMED | CROSSREF
22. Liu W, Soderlund K, Senseney JS, Joy D, Yeh PH, Ollinger J, et al. Imaging cerebral microhemorrhages in military service members with chronic traumatic brain injury. Radiology 278:536-545, 2016
PUBMED | CROSSREF
23. Logothetis NK, Pauls J, Augath M, Trinath T, Oeltermann A. Neurophysiological investigation of the basis of the fMRI signal. Nature 412:150-157, 2001
PUBMED | CROSSREF
24. Mäkelä T. Mechanics of head injuries. Suom Laakaril 20:1869-1872, 1965.
PUBMED
25. Mizobuchi Y, Nagahiro S. A review of sport-related head injuries. Korean J Neurotrauma 12:1-5, 2016 PUBMED | CROSSREF
26. Mutch CA, Talbott JF, Gean A. Imaging evaluation of acute traumatic brain injury. Neurosurg Clin N Am 27:409-439, 2016
PUBMED | CROSSREF
27. Nair DG. About being BOLD. Brain Res Brain Res Rev 50:229-243, 2005 PUBMED | CROSSREF
28. Pierpaoli C, Barnett A, Pajevic S, Chen R, Penix L, Virta A, et al. Water diffusion changes in wallerian degeneration and their dependence on white matter architecture. Neuroimage 13:1174-1185, 2001 PUBMED | CROSSREF
29. Provenzale JM. Imaging of traumatic brain injury: a review of the recent medical literature. AJR Am J Roentgenol 194:16-19, 2010
PUBMED | CROSSREF
30. Signoretti S, Marmarou A, Fatouros P, Hoyle R, Beaumont A, Sawauchi S, et al. Application of chemical shift imaging for measurement of NAA in head injured patients in Czosnyka M, Pickard JD, Kirkpatrick PJ, Smielewski P, Hutchinson P (eds): Intracranial pressure and brain biochemical monitoring. Vienna:
Springer, pp373-375, 2002
31. Smith SM, Jenkinson M, Johansen-Berg H, Rueckert D, Nichols TE, Mackay CE, et al. Tract-based spatial statistics: voxelwise analysis of multi-subject diffusion data. Neuroimage 31:1487-1505, 2006
PUBMED | CROSSREF
32. Strich SJ. Diffuse degeneration of the cerebral white matter in severe dementia following head injury. J Neurol Neurosurg Psychiatry 19:163-185, 1956
PUBMED | CROSSREF
33. Sussman ES, Pendharkar AV, Ho AL, Ghajar J. Mild traumatic brain injury and concussion: terminology and classification. Handb Clin Neurol 158:21-24, 2018
PUBMED | CROSSREF
34. Tate DF, Shenton ME, Bigler ED. Introduction to the brain imaging and behavior special issue on neuroimaging findings in mild traumatic brain injury. Brain Imaging Behav 6:103-107, 2012 PUBMED | CROSSREF
35. Tong KA, Ashwal S, Holshouser BA, Shutter LA, Herigault G, Haacke EM, et al. Hemorrhagic shearing lesions in children and adolescents with posttraumatic diffuse axonal injury: improved detection and initial results. Radiology 227:332-339, 2003
PUBMED | CROSSREF
36. Tuch DS. Q-ball imaging. Magn Reson Med 52:1358-1372, 2004 PUBMED | CROSSREF
37. Wintermark M, Sanelli PC, Anzai Y, Tsiouris AJ, Whitlow CT; American College of Radiology Head Injury Institute. Imaging evidence and recommendations for traumatic brain injury: advanced neuro- and neurovascular imaging techniques. AJNR Am J Neuroradiol 36:E1-E11, 2015
PUBMED | CROSSREF
38. Wintermark M, Sanelli PC, Anzai Y, Tsiouris AJ, Whitlow CT; ACR Head Injury Institute. Imaging evidence and recommendations for traumatic brain injury: conventional neuroimaging techniques. J Am Coll Radiol 12:e1-e14, 2015
PUBMED | CROSSREF
39. Yuh EL, Mukherjee P, Lingsma HF, Yue JK, Ferguson AR, Gordon WA, et al. Magnetic resonance imaging improves 3-month outcome prediction in mild traumatic brain injury. Ann Neurol 73:224-235, 2013 PUBMED | CROSSREF
40. Zhou Y, Kierans A, Kenul D, Ge Y, Rath J, Reaume J, et al. Mild traumatic brain injury: Longitudinal regional brain volume changes. Radiology 267:880-890, 2013
PUBMED | CROSSREF