Effect of a Single Bout of Exercise on Autophagy Regulation in Skeletal Muscle of High-Fat
High-Sucrose Diet-Fed Mice
Didi Zhang
1, Ji Hyun Lee
1, Seong Eun Kwak
1, Hyung Eun Shin
1, Yanjie Zhang
1, Hyo Youl Moon
1, Dong Mi Shin
2, Je Kyung Seong
3,4, Liang Tang
5, Wook Song
1,3,6,*
1
Health and Exercise Science Laboratory, Institute of Sports Science,
2Department of Food and Nutrition, and
3Korea Mouse Phenotyping Center, Seoul National University, Seoul;
4Laboratory of Developmental Biology and Genomics, Research Institute for Veterinary Science, College of Veterinary Medicine, Seoul National University, Seoul, Korea;
5Institute of Sports Biology, Shaanxi Normal University, Xi’an, China;
6Institute on Aging, Seoul National University, Seoul, Korea
Background: Autophagy maintains metabolic homeostasis of muscles, and its impairment may cause muscle dysfunction. Exercise can improve muscle dysfunction induced by long-term high-fat diet. This study aimed to explore the association of autophagy with impaired muscle dysfunction in obese conditions and investigate its relationship with exercise-induced muscle function improvement.
Methods: Male C57BL/6 mice (n=24) were randomly assigned to four groups: low-fat diet+plain water feed- ing sedentary (CON) group, low-fat diet+plain water feeding exercise (CON+EX) group, high-fat high-sucrose (HFHS) diet-fed sedentary group, and HFHS diet-fed exercise (HFHS+EX) group, and subjected to a single bout of exhaustive exercise.
Results: HFHS diet resulted in shorter hanging time, reduced grip force, and lower exhaustion time and dis- tance, and decreased lean mass per body weight. Moreover, in the soleus, which is chosen as a representative red (oxidative) muscle, LC3II/LC3I ratio, P62, and Bnip3 levels were altered following the HFHS diet, and were negatively correlated with muscle performance parameters; exercise significantly decreased the LC3II/LC3 ratio while P62 increased with HFHS diet. Autophagy-related protein changes were not found in the white (glycolytic) gastrocnemius.
Conclusion: The study revealed that 20-week HFHS diet causes a significant increase in body weight and fat mass, along with a decrease in muscle function. Autophagy-related LC3 and P62 protein expression was nega- tively correlated with muscle function, and they were reduced when a single bout of exercise stimulated the so- leus of obese mice. However, no change of autophagy-related proteins was seen in the gastrocnemius.
Key words: Acute exercise, High-fat diet, Sucrose, Autophagy, Muscle, Obesity
Received April 24, 2019 Reviewed May 21, 2019 Accepted July 16, 2019
* Corresponding author Wook Song
https://orcid.org/0000-0002-8825-6259 Health and Exercise Science Laboratory, Institute of Sports Science, Seoul National University, 1 Gwanak-ro, Gwanak-gu, Seoul 08826, Korea Tel: +82-2-880-7791 Fax: +82-2-872-2867 E-mail: [email protected]
INTRODUCTION
Higher muscle mass is linked with better physical function, rep- resenting a better quality of life.
1An unhealthy diet (especially those which have a high content in fats, free sugars and salt) is a high-risk factor for causing metabolic diseases such as metabolic
syndrome, obesity, diabetes, and even increased mortality.
2,3Long- term high-fat diet contributes to the catabolism of muscle tissue, declined muscle fiber area, mitochondrial dysfunction, and affects exercise capacity and muscle growth, possibly leading to muscle fi- ber atrophy at an age preceding prevalent sarcopenia.
4-6Exercise has proven to be an effective intervention to reverse
Copyright © 2019 Korean Society for the Study of Obesity
This is an Open Access article distributed under the terms of the Creative Commons Attribution Non-Commercial License (http://creativecommons.org/licenses/by-nc/4.0/) which permits unrestricted non-commercial use, distribution, and reproduction in any medium, provided the original work is properly cited.
2017-03-16 https://crossmark-cdn.crossref.org/widget/v2.0/logos/CROSSMARK_Color_square.svg
metabolic syndrome.
7Growing evidence show that regular exercise could reduce abdominal fat deposits, change the body composi- tion, recover insulin resistance, and improve muscle function.
8,9Al- though mechanisms underlying some of these effects of exercise are well documented, that underlying muscle function improve- ment in obesity remains to be clarified.
10,11Studies have indicated that beneficial metabolic effects of exercise are related to activated autophagy through AMP-activated protein kinase (AMPK) and sestrin interaction.
12Autophagy has been documented to mediate chronic exercise-induced metabolic benefits and exercise-induced adaptations, such as improved glucose and lipid homeostasis, as well as enhanced endurance performance in multiple metabolically relevant organs (i.e., skeletal muscle).
13-15Autophagy, which means “self-devouring,” is the natural, regulat- ed, destructive mechanism of the cell that disassembles unneces- sary or dysfunctional components. It serves as a dynamic recycling system for cell regrowth and homeostasis; its damage or abnormal activation could contribute to disease pathogenesis,
16with clear ev- idence that autophagy regulation strongly affects skeletal muscle plasticity.
17Autophagy has been suggested to contribute to the pre- vention of accumulation of dysfunctional mitochondria during muscle contraction, and for maintaining exercise-dependent glu- cose homeostasis.
14,18Autophagy impairment could be induced by high-fat or high-sugar consumption.
14,19Mice lacking autophagy-re- lated proteins failed to show any improvement in skeletal muscle adaptation and exercise performance, induced by exercise.
15However, little is known on how nutrition might interact with acute exercise to modulate autophagy in obesity. Moreover, an acute bout of exercise is proven to activate autophagy through post- translational modifications, and more chronically by the enlistment of a transcriptional program.
13,20Furthermore, a single bout of en- durance exercise can increase the autophagy-related and -regulated gene expression and even lead to a prolonged adaptive response.
13,21Therefore, to verify the mechanism concerning the changes of muscle functions brought by exercise in obese condition, and the relation between the mechanism and autophagy, this study applied a single bout of exercise that can cause changes in autophagy to stimulate the long-term high-fat high-sucrose (HFHS)-fed obesity mice, and observed the changes of autophagy-related proteins in different fibers of obesity model, and the relationship between
changed autophagy proteins with the stimulation of exercise and the muscle function. This study hypothesized that the effect of ex- ercise on muscle function in obesity is related to autophagy.
METHODS Animals and diets
Male C57BL/6 mice (n= 24; Japan SLC Inc., Haruno & Oh-ha- ra Production Facility) were purchased from Central Lab. Animal Inc. (Seoul, Korea), at 8 weeks of age. After 1 week of acclimatiza- tion, all mice were individually caged and switched to either a 60%
fat (D12492; Research Diets Inc., New Brunswick, NJ, USA) diet with 30% sucrose (S5016; Sigma-Aldrich, St. Louis, MO, USA) liquid feed, or a normal diet and normal water feed, for 20 weeks, to induce obesity; they were randomly assigned to HFHS feeding groups (HFHS [sedentary], HFHS+EX [exercise]) and low-fat diet+plain water feeding groups (CON [sedentary], CON+ EX [exercise]). All groups were allowed to eat ad libitum, and food in- take and body weight were recorded twice a week over the dura- tion of the study. After 20-week diet intervention, all groups took the muscle function tests which consisted of whole-limb grip strength test and hanging time test. And one single bout of exhaustion exer- cise was performed in CON+EX and HFHS+EX groups 72 hours after the end of muscle function tests. The gastrocnemius (GAS) and soleus (SOL) muscles were examined to investigate the au- tophagic flux and mitophagy-related protein expression using West- ern blot analysis. The animals were housed under reverse light-dark cycle (lights on at 7:00 AM and off at 7:00 PM) at 21°C–23°C. All animal procedures were approved by the Institute of Animal Care and Use Committee, Seoul National University (No. SNU-170818- 1-2) (Fig. 1).
Whole-limb grip strength test
The maximum strength of whole-limb grip in mice was mea- sured in grams by a grip strength meter (Bioseb, Vitrolles, France).
The mouse was placed on a tension grid while restrained manually
by the scruff of the neck and base of the tail. After visual confirma-
tion of firm gripping, the mouse was gently pulled back, until it re-
leased its grip from the grid. Each mouse was allowed three trials,
and the greatest force was used for analysis. To adjust for potential
effects of body weight on test performance, results from the grip strength test were normalized to body weight.
22Hanging test
Balance, coordination, and muscle condition were assessed by testing the hanging time of each mouse, using a hanging device (made in-house). Mice were allowed to grasp the grid with all four paws; the grid was 40 cm above soft bedding to prevent any injury upon falling. The timer was started when the hanging grid (with the mouse) was inverted. The test session ended if the mouse could hang for a duration of 600 seconds. Mice that fell off the grid once, were allowed up to two more trials. The maximum hanging time (i.e., the longest of the trials) was used for future analysis. To adjust for potential effects of body weight on test performance, re- sults obtained from hanging tests were multiplied by body weight.
22Treadmill exhaustion exercise
At the end of the diet treatment, mice were acclimatized to and
trained for 2 days on a 12° uphill Exer-3/6 open treadmill (Colum- bus Instruments, Columbus, OH, USA) for 5 minutes at 8 m/min and/or followed by another 5 minutes at 10 m/min. On day 3, the mice were allowed to start at a speed of 10 m/min for 40 minutes, after which the treadmill speed was increased at a rate of 1 m/min every 10 minutes for a total of 30 minutes, and subsequently in- creased at the rate of 1 m/min every 5 minutes, until the mice were exhausted. Exhaustion was defined as the point at which the mice spent more than 5 seconds on hands without attempting to resume running. Total running time was recorded and the total distance run was calculated for each mouse.
14Body composition
Total body composition was determined immediately before sacrifice, using the Minispec Contrast Agent Analyzer (Bruker Op- tik, Ettlingen, Germany).
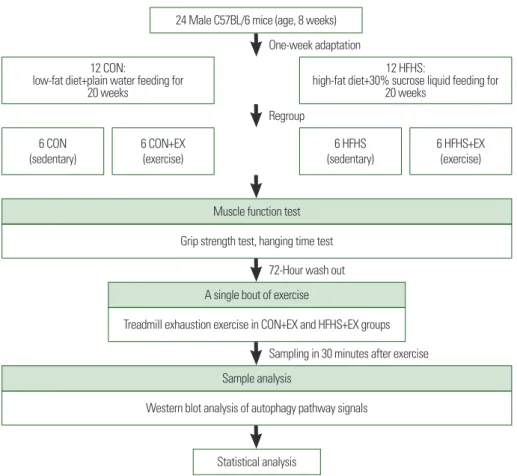
Figure 1. Schematic diagram of the experimental design.
72-Hour wash out
Sampling in 30 minutes after exercise Muscle function test
Grip strength test, hanging time test
A single bout of exercise
Treadmill exhaustion exercise in CON+EX and HFHS+EX groups
Sample analysis
Western blot analysis of autophagy pathway signals 6 CON
(sedentary) 6 HFHS
(sedentary) 6 CON+EX
(exercise) 6 HFHS+EX
(exercise) 12 CON:
low-fat diet+plain water feeding for 20 weeks
12 HFHS:
high-fat diet+30% sucrose liquid feeding for 20 weeks
One-week adaptation
Regroup
Statistical analysis
24 Male C57BL/6 mice (age, 8 weeks)
Western blot analyses
Mouse tissue extracts were prepared by homogenizing tissues in lysis buffer containing 50 mM Tris (pH 7.9), 150 mM NaCl, 1 mM ethylenediaminetetraacetic acid (EDTA), 1% Triton X-100, pro- teinase inhibitor cocktail (Roche Applied Sciences, Mannheim, Germany), and Halt phosphatase inhibitor cocktail (Roche Ap- plied Sciences), and then subjected to Western blot analysis with anti-LC3 (1:500, Sigma-Aldrich), anti-P62 (1:500; Cell Signaling Technology, Danvers, MA, USA), anti-Bnip3 (1:500, Cell Signal- ing Technology), anti-AMPK (1:500, Cell Signaling Technology), anti-p-AMPK (1:500, Cell Signaling Technology), anti-Beclin1 (1:500, Cell Signaling Technology), and anti-GAPDH (1:3,000, Cell Signaling Technology) antibodies. Activation of AMPK was expressed as the ratio of phosphorylated AMPK (pAMPK) to total AMPK (tAMPK).
Statistical analysis
Statistical analyses were performed using IBM SPSS version 23.0 (IBM Corp., Armonk, NY, USA) and GraphPad Prism 7 (Graph- Pad Software Inc., La Jolla, CA, USA), and data were presented as mean± standard deviation. The t-test was used to estimate the body weight, grip strength, hanging time, and speed and distance of exhaustion, for comparison between CON and HFHS groups, before or postintervention. Two-way analysis of variance was used for comparison of the magnitude of changes between sedentary and exercise groups in mice with two different diets. Values with P<0.05 were considered statistically significant. Association of au- tophagy-related protein level in SOL and GAS with muscle func- tion was calculated with Pearson’s correlation coefficient.
RESULTS
Chronic HFHS diet induced body weight, body composition, and tissue mass changes
As shown in Fig. 2A-C, HFHS-fed mice had significantly higher body weight (P<0.05) and average energy intake (P<0.05) com- pared to CON-fed mice, at all time-points, with more fat mass (P<
0.01), lean mass (P<0.05), and free body fluid (P<0.01) than CON (Fig. 2D). However, contrary to the fat mass per body weight induced by HFHS diet, lean mass per body weight in HFHS
groups were significantly decreased (Fig. 2E). In Fig. 2F, wet weight of liver, inguinal white adipose tissue, and interscapular brown adi- pose tissue were all found to be significantly (P<0.01) higher in HFHS than in CON, whereas muscle (SOL, GAS, quadriceps [QUAD], tibialis anterior [TA] muscle) mass had no difference between the two groups.
Chronic HFHS diet induced exercise performance changes
After the 20-week diet regime, hanging time was significantly (P<0.01) increased in CON-fed mice compared to baseline (Fig.
2G). The grip force of mice significantly decreased in both CON and HFHS groups (P<0.01) (Fig. 2H). At 20 weeks, both hang- ing time and grip strength of HFHS mice were significantly lower than those of CON mice (P<0.01). Twenty-week HFHS feeding regime induced significant reduction in both exercise exhaustion time (P<0.05) and exhaustion distance (P<0.05) (Fig. 2I).
A bout of exhaustive exercise induced autophagy- and mitophagy-related protein expression changes in SOL
Western blot analysis showed that, after a 20-week HFHS diet, there was no significant increase in pAMPK/tAMPK ratio com- pared to that in the control group (Fig. 3B). However, the expres- sion levels of autophagy-related proteins LC3I (P<0.01), LC3II (P<0.05), and LC3II/LC3I ratio (P<0.05) in HFHS group were all significantly increased compared to those in the CON group (Fig. 3D). Interestingly, P62 expression level was also increased (P<0.01) (Fig. 3F). This phenomenon also occurred in the mito- chondria, accompanied by an increase in the expression of BCL2/
adenovirus E1B 19-kDa interacting protein 3 (Bnip3, P<0.01) (Fig. 3E) while the expression of Beclin1 remained unchanged.
In response to a single acute exercise stimulation, the pAMPK/
tAMPK ratio increased significantly (P<0.01) in CON group, though not in HFHS group (Fig. 3B). The expression levels of LC3II, LC3II/LC3I ratio, and P62 were not affected by exercise in CON group, excepting for the increased LC3I expression level (Fig.
3D, F). On the contrary, the expression levels of LC3II, LC3II/
LC3I ratio, and P62 decreased, except for that of LC3I (P<0.05)
in HFHS group (Fig. 3D, F). Upon exercising, Bnip3 expression
was significantly increased in CON mice (P<0.05), but not in
A 60
50
40
30
20
Body weight (g)
0 3 6 9 12 15 18 21 Week
* CON HFHS
†
B 25
20
15
10
5
Energy intake (calorie/mouse/day)
0 3 6 9 12 15 18 21 Week
CON HFHS
C 25
20
15
10
5 Average energy intake (calorie/mouse/day) 0
CON HFHS
*
D 30
20
10
0
Body composition (g)
Fat mass Lean mass Free body fluid
*
†
†
E 0.5
0.4
0.3 0.2
0.1
0
0.8
0.6
0.4
0.2
0
Fat mass (g)/body weight (g) Lean mass (g)/body weight (g)
HFHS HFHS
CON CON
†
†
F 3.5 3.0 2.5 2.0 1.5 1.0 0.5 0
Mass of tissue (g)
SOL GAS TA QuadCardiac Liver Pancrease iWATeW AT iBAT
†
†
CON HFHS CON
HFHS
†
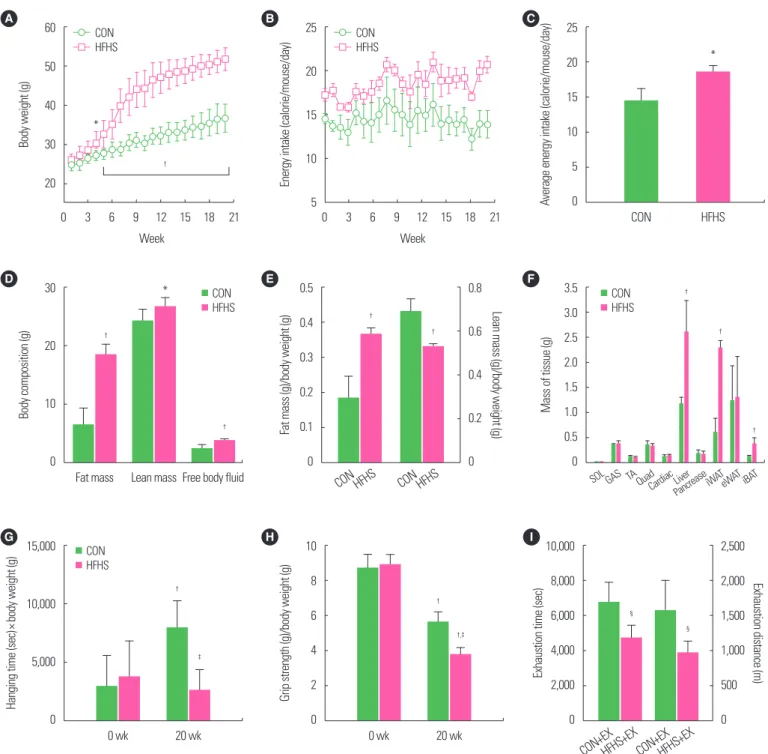
Figure 2. Chronic high-fat high-sucrose (HFHS) diet induced body weight, body composition, and tissue mass, and muscle function changes. HFHS diet-fed mice had sig- nificantly higher body weight (A), average energy intake (B, C), with more fat mass, lean mass, free body fluid (D), while a decreased lean mass per body weight (E), and more wet weight of liver, inguinal white adipose tissue (iWAT), and interscapular brown adipose tissue (iBAT) (F). After 20-week diet regime, hanging time was increased in control diet-fed mice (G), and the grip force of mice decreased in both two diet-fed groups (H) compared to baseline. At 20 weeks, 20-week HFHS feeding regime in- duced significant reduction in hanging time, grip strength, and both exercise exhaustion time and exhaustion distance (G-I). Values are presented as mean± standard devi- ation (A-C, G, H: n= 12; D-F, I: n= 6). *P< 0.05,
†P< 0.01 vs. CON groups (A-C) or CON groups at 0 week (G, H) or CON (D-F);
‡P< 0.01 vs. CON groups at 20 weeks;
§P< 0.05 vs. CON+EX (I). The t-test was used. CON, low-fat diet+plain water feeding group; HFHS; HFHS diet-fed sedentary group; CON+EX, CON exercise group; HFHS+EX, HFHS diet-fed exercise group; SOL, soleus; GAS, gastrocnemius; TA, tibialis anterior; QUAD, quadriceps; eWAT, epididymal white adipose tissue.
I 10,000
8,000
6,000
4,000 2,000
0
2,500 2,000
1,500
1,000 500
0
Exhaustion time (sec) Exhaustion distance (m)
HFHS+EX HFHS+EX CON+EX CON+EX
§
§
H 10
8
6
4 2
0
Grip strength (g)/body weight (g)
0 wk 20 wk
†
†,‡
G 15,000
10,000
5,000
Hanging time (sec) ×body weight (g) 0
0 wk 20 wk
†
‡
CON
HFHS
HFHS mice (Fig. 3E). Besides, the expression level of Beclin1 was not affected by either diet or exercise intervention (Fig. 3C).
A bout of exhaustive exercise induced autophagy- and mitophagy-related protein expression changes in GAS
Immunoblotting of GAS in all groups is shown in Fig. 4A. The 20-week HFHS diet was accompanied by a significant increase (P<0.05) in the levels of pAMPK/tAMPK ratio compared to the CON diet (Fig. 4B). Autophagy-related proteins LC3I, LC3II, LC3II/LC3I ratio, and P62 expression, and mitophagy-related pro- tein Bnip3, did not change following the intervention (Fig. 4C-F).
After a single bout of exhaustive exercise stimulation, the level of pAMPK/tAMPK ratio increased significantly in CON mice, but not in HFHS mice (Fig. 4B). Unlike the changes seen in SOL, a single exercise did not cause any change in autophagy pathway pro-
teins in GAS in both the groups.
Pearson’s correlation between muscle performance parameters and molecular expression level of autophagy in SOL
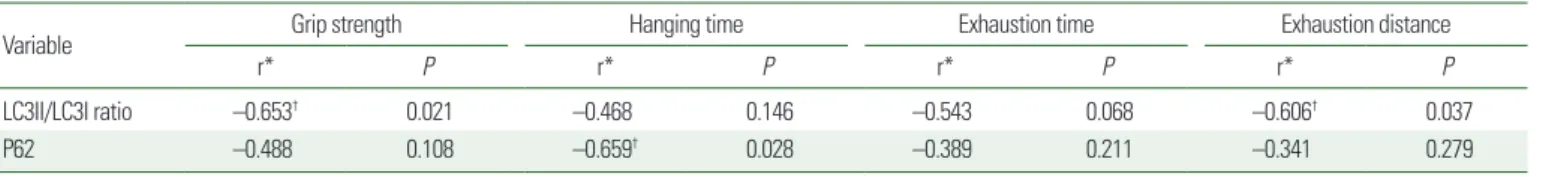
Correlations between muscle performance parameters and mo- lecular expression level of autophagy in SOL, after 20 weeks of treatment, are shown in Table 1. The expression of mitophagy-re- lated protein Bnip3 was negatively correlated with three muscle performance parameters, including grip strength (P<0.01), ex- haustion time, and distance (P<0.05). Hanging time also had a moderately negative relationship with the expression of P62 in the autophagy pathway (P<0.05), and LC3II/LC3I ratio was nega- tively correlated with grip strength (P<0.05) and exhaustion dis- tance (P<0.05) (Supplementary Fig. 1).
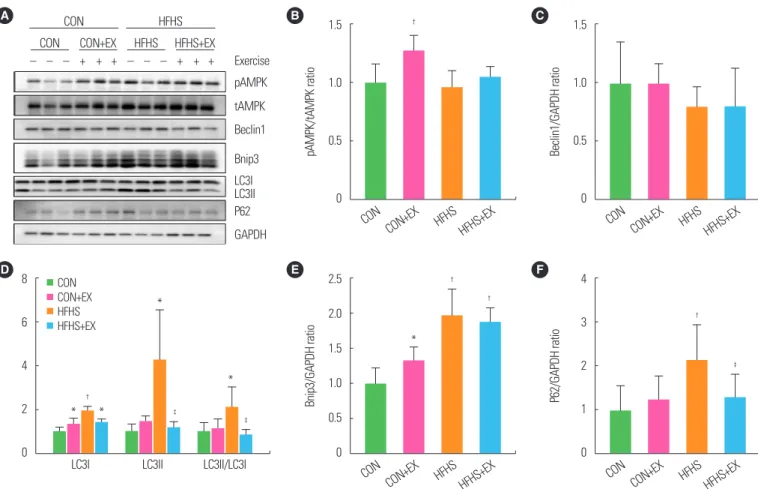
Figure 3. A bout of exhaustive exercise induced autophagy-related protein expression changes in soleus. Immunoblotting of soleus in all groups mice, using antibodies specific for phosphorylated AMP-activated protein kinase (pAMPK)/total AMPK (tAMPK) ratios, Beclin1, Bnip3, LC3, P62, and GAPDH (A). GAPDH, a loading control. West- ern blot results of pAMPK/tAMPK ratios (B), Beclin1 (C), LC3I, LC3II, LC3II/LC3I ratio (D), Bnip3 (E), and P62 (F) relative to GAPDH. Values are presented as mean± standard deviation (n= 6). *P< 0.05,
†P< 0.01 vs. CON;
‡P< 0.05 vs. HFHS. Two-way analysis of variance was used. CON, low-fat diet+plain water feeding group; HFHS; HFHS diet- fed sedentary group; CON+EX, CON exercise group; HFHS+EX, HFHS diet-fed exercise group.
A CON
– – – + + + – – – + + +
CON CON+EX HFHS HFHS+EX
HFHS
Exercise pAMPK tAMPK Beclin1 Bnip3 LC3I LC3II P62 GAPDH
B 1.5
1.0
0.5
0
pAMPK/tAMPK ratio
CON CON+EX HFHS HFHS+EX
†
E 2.5
2.0 1.5
1.0
0.5 0
Bnip3/GAPDH ratio
CON CON+EX HFHS HFHS+EX
*
†
†
D 8
6
4
2
0 LC3I LC3II LC3II/LC3I
†
‡ ‡
* *
*
*
F 4
3
2
1
0
P62/GAPDH ratio
CON CON+EX HFHS HFHS+EX
†
‡
C 1.5
1.0
0.5
0
Beclin1/GAPDH ratio
CON CON+EX HFHS HFHS+EX
CON
CON+EX
HFHS
HFHS+EX
DISCUSSION
Effect of HFHS diet on general parameters and muscle function
In this study, 20 weeks of HFHS feeding induced a significant in- crease in body weight, adipose tissue, liver mass, fat mass, as well as lean mass. However, long-term HFHS diet did not cause the same growth of skeletal muscle tissues in hind limbs, such as GAS and SOL, but has led to a decreased lean mass per body weight. The 20-week HFHS feeding sufficiently impaired functional perfor- mance, with reduced submaximal muscle grip strength, lower hanging time, and decreased distance and time of exhaustion.
These may be consistent with previous results that showed that prolonged HFHS diet leads to skeletal muscle atrophy with a de- crease in myofibrillar proteins, and phenotypically characterized by
loss of muscle mass and strength.
23-25Growing evidence support the role of fatty acids and their derived lipid intermediates in the regulation of skeletal muscle mass and function. Furthermore, con- tinuous glucose (15%) intake was suggested to contribute to intra- myocellular lipid accumulation and lead to the induction of au- tophagy.
19Inhibition/alteration of autophagy is proven to contrib- ute to myofiber degeneration and weakness in muscle-specific Atg7 knockout mice generation, thereby indicating that autophagy is re- quired to maintain muscle mass.
26While an essential role of au- tophagy in the maintenance of lipo-homeostasis has been revealed in recent years, whether muscle dysfunction is the result of im- paired autophagy regulation in obesity still remains speculative.
HFHS diet affects the autophagy pathway
In SOL, we observed HFHS feeding to increase both LC3II/
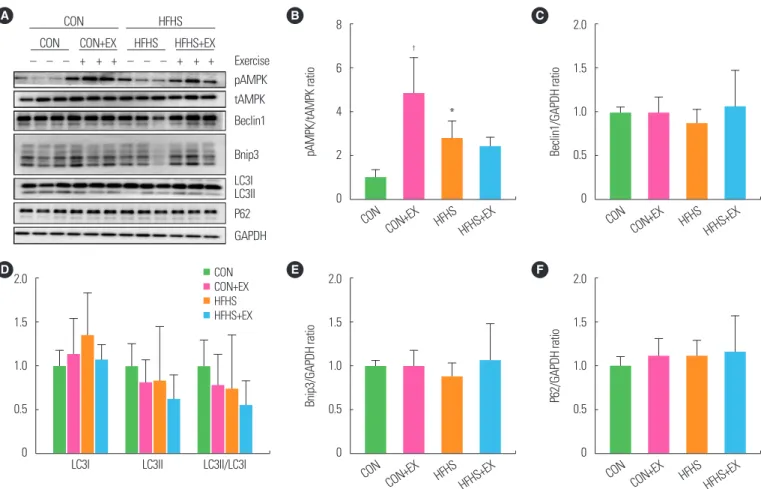
Figure 4. A bout of exhaustive exercise induced autophagy-related protein expression changes in gastrocnemius. Immunoblotting of gastrocnemius in all groups (A).
Western blot results of phosphorylated AMP-activated protein kinase (pAMPK)/total AMPK (tAMPK) ratios (B), Beclin1 (C), LC3I, LC3II, LC3II/LC3I ratio (D), Bnip3 (E), and P62 (F) relative to GAPDH. Values are presented as mean± standard deviation (n= 6). *P< 0.05,
†P< 0.01 vs. CON. Two-way analysis of variance was used. CON, low-fat diet+plain water feeding group; HFHS; HFHS diet-fed sedentary group; CON+EX, CON exercise group; HFHS+EX, HFHS diet-fed exercise group.
A CON
– – – + + + – – – + + +
CON CON+EX HFHS HFHS+EX
HFHS
Exercise pAMPK tAMPK Beclin1 Bnip3 LC3I LC3II P62 GAPDH
B 8
6
4
2
0
pAMPK/tAMPK ratio
CON CON+EX HFHS HFHS+EX
†
*
E 2.0
1.5
1.0
0.5
0
Bnip3/GAPDH ratio
CON CON+EX HFHS HFHS+EX D 2.0
1.5
1.0
0.5
0 LC3I LC3II LC3II/LC3I
F 2.0
1.5
1.0
0.5
0
P62/GAPDH ratio
CON CON+EX HFHS HFHS+EX C 2.0
1.5
1.0
0.5
0
Beclin1/GAPDH ratio
CON CON+EX HFHS HFHS+EX CON
CON+EX
HFHS
HFHS+EX
LC3I ratio as well as P62 expression (Fig. 3), which means that the long-term unhealthy diet promoted the formation of autophago- somes, but blocked their degradation. Intramyocellular lipid con- tent and ectopic fat storage, increased by excess lipid in skeletal muscle, had been proven to result in skeletal muscle dysfunction.
27Thus, the increased LC3II/LC3I ratio with HFHS diet may be an attempt to mitigate the associated metabolic result. However, the accumulation of P62 indicated a decrease of the combination of autophagosomes and lysosomes, thus leading to a decrease of ubiq- uitinated protein degradation or blockage of lipid droplet break- down, thereby influencing the homeostasis of muscle cells.
28,29The Pearson’s correlation coefficients, obtained in this study, showed a negative correlation between autophagy responses and muscle function parameters, under the regime of HFHS diet (Table 1).
Together, it indicated that the dynamics of autophagic flux (LC3 and P62) determined the muscle function of mice feeding on HFHS diet. However, our article lacks the determination of inter- cellular fat content.
As mentioned earlier, high-fat and high-sugar feeding induced the disequilibrium of autophagy, and the recovery of this disequi- librium seems to be the key to avoid loss of muscle function caused by diet. The improvement effects of muscle function of long-term exercise haven been well known. Moreover, an acute bout of exer- cise is proven to activate autophagy.
13,20In order to prove whether this autophagy disequilibrium caused by diet is interfered by exer- cise and restore muscle function, this study used a single exercise to stimulate different metabolic type muscle. Under exhaustive exer- cise, P62 expression decreased, in accord with the decrease of LC3II/LC3I ratio in HFHS+EX mice, which implied that acute endurance exercise accelerates autophagosome degradation while not facilitating LC3II generation (Fig. 5). For normal diet-fed mice, exercise increased LC3I expression. Therefore, the effect of long- term exercise on LC3II generation in obese mice was worth ex-
ploring. For the unchanged LC3II/LC3I ratio in CON+EX mice, a debatable reduction, or no change of LC3-II level, was reported af- ter less strenuous endurance exercise.
30,31Unlike P62 and LC3II conversion, upon exercise stimulation, the expression of Bnip3 had no response in HFHS-fed mice. It is, however, contrary to the study that reported autophagy to be important in preventing mito- chondrial damage during damaged muscle contraction.
18Consis- tent with the previous study that showed non-lipid substrates to be necessary for the activation of autophagy with exercise, in this study, Bnip3 was seen to change only by exercise in CON mice, thereby confirming that a low-lipid substrate is essential for the ac- tivation of autophagy with exercise.
32In this study, HFHS did not influence the expression of Beclin-1, same as in the previous report, indicating that more definitive studies would be required to deter- mine the role of Beclin-1 complex in the regulation of autophagy pathways.
33Autophagy pathway had no significant change owing to the Table 1. The association between muscle performance parameters and autophagy
Variable Grip strength Hanging time Exhaustion time Exhaustion distance
r* P r* P r* P r* P
LC3II/LC3I ratio –0.653
†0.021 –0.468 0.146 –0.543 0.068 –0.606
†0.037
P62 –0.488 0.108 –0.659
†0.028 –0.389 0.211 –0.341 0.279
*The association between muscle performance parameters and molecular biological expression level of autophagy in soleus of control diet-fed mice and high-fat high-sucrose diet- fed mice, calculated with Pearson’s correlation coefficient;
†P< 0.05 (n= 6).
Figure 5. Schematic illustrating of the mechanisms for a single bout of exercise in soleus of high-fat high-sucrose (HFHS) induced obese mice. HFHS feeding did not induce the change of phosphorylated AMP-activated protein kinase (pAMPK)/total AMPK (tAMPK) ratio, while increased both LC3II/LC3I ratio as well as P62 expres- sion. Under a single bout of exercise, both LC3II/LC3I ratio and P62 expression de- creased, while not facilitating LC3II generation in HFHS diet-fed exercise group mice. All the changes above implied that long-term unhealthy diet promoted the formation of autophagosomes, but blocked their combination with lysosome, and a single bout of exercise accelerates the autophagosome degradation.
HFHS feeding A single bout of exercise
Lysosome AMPK
Isolation Membrane Cargo
e.g., proteins, organelles etc.
Autophagosome Autolysosome LC3 P62
Bnip3