D I A B E T E S & M E T A B O L I S M J O U R N A L
This is an Open Access article distributed under the terms of the Creative Commons At- tribution Non-Commercial License (http://creativecommons.org/licenses/by-nc/3.0/) which permits unrestricted non-commercial use, distribution, and reproduction in any medium, provided the original work is properly cited.
Protective Effect of Heme Oxygenase-1 on High Glucose-Induced Pancreatic β-Cell Injury
Eun-Mi Lee, Young-Eun Lee, Esder Lee, Gyeong Ryul Ryu, Seung-Hyun Ko, Sung-Dae Moon, Ki-Ho Song, Yu-Bae Ahn
Division of Endocrinology and Metabolism, Department of Internal Medicine, The Catholic University of Korea College of Medicine, Seoul, Korea
Background: Glucose toxicity that is caused by chronic exposure to a high glucose concentration leads to islet dysfunction and induces apoptosis in pancreatic β-cells. Heme oxygenase-1 (HO-1) has been identified as an anti-apoptotic and cytoprotective gene. The purpose of this study is to investigate whether HO-1 up-regulation when using metalloprotophyrin (cobalt protopor- phyrin, CoPP) could protect pancreatic β-cells from high glucose-induced apoptosis.
Methods: Reverse transcription-polymerase chain reaction was performed to analyze the CoPP-induced mRNA expression of HO-1. Cell viability of INS-1 cells cultured in the presence of CoPP was examined by acridine orange/propidium iodide staining.
The generation of intracellular reactive oxygen species (ROS) was measured using flow cytometry. Glucose stimulated insulin secretion (GSIS) was determined following incubation with CoPP in different glucose concentrations.
Results: CoPP increased HO-1 mRNA expression in both a dose- and time-dependent manner. Overexpression of HO-1 inhib- ited caspase-3, and the number of dead cells in the presence of CoPP was significantly decreased when exposed to high glucose conditions (HG). CoPP also decreased the generation of intracellular ROS by 50% during 72 hours of culture with HG. However, decreased GSIS was not recovered even in the presence of CoPP.
Conclusion: Our data suggest that CoPP-induced HO-1 up-regulation results in protection from high glucose-induced apopto- sis in INS-1 cells; however, glucose stimulated insulin secretion is not restored.
Keywords: Cobalt protoporphyrin; Diabetes mellitus; Glucotoxicity; Heme oxygenase-1
Corresponding author: Yu-Bae Ahn
Division of Endocrinology and Metabolism, Department of Internal Medicine, St. Vincent’s Hospital, The Catholic University of Korea College of Medicine, 93 Ji-dong, Paldal-gu, Suwon 442-723, Korea
INTRODUCTION
Type 2 diabetes is a chronic metabolic disorder, and its patho- genesis is characterized by insulin resistance and β-cell dys- function [1]. Recently, there has been growing evidence that a functional defect of β-cells may be central to the development and progression of type 2 diabetes [2]. Pancreatic β-cells play a key role in maintaining normal glucose metabolism through adequate insulin secretion in response to hyperglycemia [3,4].
Glucose metabolism is normally maintained by oxidative phos- phorylation; however, chronic exposure to elevated glucose
concentrations can cause glucotoxicity that causes irreversible cellular damage, which then results in decreased β-cell mass and increased apoptosis. Glucotoxicity decreases insulin mRNA expression in β-cells, and one explanation for this is due to a marked reduction in posttranscriptional PDX-1 pro- cessing. Decreased pancreatic and duodenal homeobox-1 (PDX-1) expression results in diminished insulin content and impairment of glucose stimulated insulin secretion (GSIS).
The adverse effect of glucose toxicity that is mediated at least in part by generation of reactive oxygen species (ROS) also impairs insulin gene expression that is associated with β-cell pISSN 2233-6079 · eISSN 2233-6087
function.
ROS are known to cause cellular damage by oxidizing nu- cleic acid and are also involved in the activation of genes that are associated with the mechanisms of cell defense [5]. Previ- ous studies have demonstrated that high glucose can increase the accumulation of intracellular ROS that results in oxidative stress to the β-cells. However, the amount of antioxidant en- zyme needed to catabolize ROS in islets is very low compared to levels in other tissues [6,7]. A number of studies have report- ed that the overexpression of antioxidant genes helps to protect β-cells against oxidative stress [8-10].
Heme oxygenase-1 (HO-1) is a rate limiting enzyme in the heme degradative pathway and is up-regulated by various stim- ulants, such as oxidative stress, inflammation, and endotoxin [11-13]. HO-1 has several biological effects on antioxidant, anti-inflammatory and immune regulatory functions during times of cellular stress. Induction of HO-1 in islets results in protection from the detrimental effect that is mediated by cy- tokines [14]. Cobalt protoporphyrin (CoPP), a substrate of HO-1, is known to increase HO-1 expression and activity. Al- though several studies have indicated CoPP as a potent HO-1 inducer, the effect of CoPP on INS-1 cells exposed to a high glucose condition has not been determined.
We investigated whether HO-1 up-regulation by CoPP pro- tects INS-1 cells from hyperglycemia when induced by oxida- tive stress.
METHODS
Cell cultures and treatment
INS-1 cells were cultured in RPMI 1,640 medium (Sigma, St.
Louis, MO, USA) containing 11.1 mM glucose, 10% fetal bo- vine serum (FBS; Hyclone, Logan, UT, USA), 2 mM L-gluta- mine (Gibco BRL, Grand Island, NY, USA), 100 U/mL peni- cillin, 100 µg/mL streptomycin, and 250 ng/mL amphotericin B (WelGENE, Daegu, Korea). The cells were cultured in a hu- midified atmosphere containing 5% CO2 at 37°C. All of the studies were performed on INS-1 cells that were between the 21st and 29th passages.
After serum starvation with 60% of confluency for 12 hours, the INS-1 cells were incubated for either 24 hours or 72 hours with mannitol and at a low glucose (LG; 5.5 mM) or high glu- cose (HG; 27.7 mM) concentration, respectively. INS-1 cells were incubated with 500 nM of CoPP (Sigma, St. Louis, MO, USA) for 4 hours to induce HO-1.
Semi-quantitative reverse transcription-polymerase chain reaction (RT-PCR) analysis
The TRIZOL reagent (Invitrogen, Carsbad, CA, USA) was used to isolate the RNA from treated INS-1 cells. RNA was extract- ed with BCP (1-bromo-3-chloropropane; Molecular Research Center, Cincinnati, OH, USA) followed by centrifugation to separate the sample into aqueous and organic phases. RNA was recovered from the aqueous phase by an isopropyl alcohol precipitation and then suspended in diethylpyrocarbonate (DEPC)-treated water. After quantification by spectropho- tometer (UV/VIS Spectrophotometer ND-1000; Nanodrop, Silmington, DE, USA), 2 µg of RNA was subjected to 85°C for 3 minutes prior to the addition of 5X First-Strand buffer (Invi- trogen), 0.1 M dTT (Invitrogen), 50 µg/µL Random hexamer (Invitrogen), 10 mM dNTP (Invitrogen), RNaseOUTTM (40 U/
µL, Invitorogen), and SuperScripTM II Reverse Transcriptase (200 U/µL, Invitrogen). Reverse transcription (RT) reactions were 10 minutes at 25°C, 60 minutes at 42°C, and 10 minutes at 95°C. The resulting cDNA products were stored at -70°C.
The PCR reaction that was designed to amplify the cDNA fragments (Promega, Madison, WI, USA) contained 1 µL of each forward and reverse primer (10 pM), 6 µL of DEPC wa- ter, and 2 µL of cDNA template. Oligonucleotide primers for HO-1 (forward: 5′-TCAAGCACAGGGTGACA-3′; reverse:
5′-CATAAATTCCCACTGCCACG-3′) and cyclophilin (for- ward: 5′-AACCCCACCGTGTTCTTC-3′; reverse: 5′- TGCCTTCTTTCACCTTCCC-3′) were used. The PCR prod- ucts were separated by electrophoresis on 2% agarose gel, vi- sualized by ethidium bromide staining under ultraviolet light, and analyzed with the Quantity One program (Bio-Rad, Her- cules, CA, USA). The gene expression level of the cyclophilin was used to quantify the expression of a housekeeping gene.
Cytotoxicity assay
Highly sensitive water soluble tetrazolium salt (WST) was used as an indicator of cell viability as determined by mito- chondrion-dependent reduction to formazane. A total of 5×10⁵ INS-1 cells were seeded into each well of a 96-well plate.
The medium was then replaced with 100 µL of fresh culture medium that was then treated for 3 hours at 37°C and that contained 5% CO2 in the presence of 10 µL of CCk-8 solution (Cell counting kit-8; Dojindo, Kumamoto, Japan). The absor- bance of the supernatant was measured at 450 nm on an auto- mated microplate reader (Bio-Rad). The ratio of living cells was calculated by measuring the absorbance of the superna-
tant at each concentration divided by that of the control.
Acridine orange (AO)/propidium iodide (PI) staining For AO/PI staining, the cells were seeded at 1×10⁶ cells/well into a 6-well plate that was then treated with another glucose concentration and 500 nM CoPP for 24 hours and 72 hours, respectively. Afterward, the PBS-treated cells were then stained with both AO (100 µg/mL) and PI (500 µg/mL) at a 1:1 dilution and treated with 1 µL/mL. Cells were visualized using a fluo- rescence microscope (Zeiss, Oberkochen, Germany). The cell death rate of the β-cells according to the PI staining was calcu- lated relative to the percentage of all cells.
Hydrogen peroxide measurement
The INS-1 cells were labeled with 10 µM chloromethy-2’,7’-di- chlorofluorescein diacetate (CM-H2DCFDA; Molecular Probes, Carlsbad, CA, USA) for 30 minutes at 37°C. After 3 PBS wash- es, the cells were then harvested after incubation with trypsin- EDTA (Gibco BRL) for 1 minute at 37°C, followed by centrifu- gation at 1,200 rpm for 5 minutes. The cells were washed twice with PBS, resuspended in PBS, and 1 µg/mL of propidium io- dide was added. The cells were analyzed using a flow cytome- ter. A fluorescence microscope was used to observe the ROS.
The cells were labeled with 10 µM carboxy-H2DCFDA and washed 3 times with PBS. This was followed by the addition of 1 µg/mL propidium iodide and incubated for 10 minutes. Cells were visualized using a fluorescence microscope (Zeiss).
Western blotting analysis
INS-1 cells were collected in lysis buffer (25 mM Tris-HCl, pH 7.4, 0.1% SDS, 0.1% Triton X-100, 1% sodium deoxycholate, 150 mM NaCl, 1 mM EDTA, 1 mM Na3VO4, 1 mM PMSF, 10 µg/mL aprotinin, and 5 µg/mL leucopeptin) on ice and centri- fuged at 13,000 rpm for 30 minutes. The protein concentra- tions were then determined using the Bradford method. Total cell protein (30 µg) was separated using either 10% or 12% so- dium dodecyl sulfate-polyacrylamide gel electrophoresis (SDS- PAGE) and were then transferred to nitrocellulose membranes.
Membranes were blocked with 5% skim milk (BD Bioscience, San Diego, CA, USA) in Tris buffered saline containing 0.05%
Tween 20 (TBST) for 1 hour at room temperature. The cells were then incubated with the assigned primary antibody, HO-1 (1:2,000; Stressgen, Victoria, Canada), caspase-3 (1:200;
Santa Cruz Biotechnology, Santa Cruz, CA, USA), and β-actin (1:5,000; Abcam, Cambridge, MA, USA), which were all dilut-
ed in TBST containing 5% skim milk overnight at 4°C. The membrane was washed three times with TBST for 8 minutes each and incubated with a goat anti-rabbit HRP-conjugated antibody and anti-mouse antibody (1:3,000; Pierce Biotech- nology, Rockford, IL, USA) in TBST containing 5% BSA for 1 hour at room temperature. After washing, an X-ray of the membrane was developed using an ECL detection kit (GE Healthcare, Milwaukee, WI, USA).
Detection of apoptotic cells
Apoptotic cells were detected using the TUNEL (Tdt-mediat- ed dUTR nick-end labeling) technique. Following either the glucose or the CoPP treatment, cells were washed with PBS and fixed in 4% paraformaldehyde in PBS for 1 hour at room temperature. After washing, the cells were incubated in per- meabilization solution for 2 minutes on ice. The cells were la- beled according to the instructions provided by the manufac- turer of the TUNEL assay (Roche, Mannheim, Germany). The TUNEL-positive cells were visualized using confocal micros- copy (Zeiss).
GSIS
Treated INS-1 cells were incubated for 2 hours in 2 concentra- tions of Krebs-Ringer buffer (KRB) that contained 5.5 mM and 25 mM concentrations. After the incubation, the superna- tants were obtained and frozen at -70°C prior to the determi- nation of insulin secretion. The insulin secretion of the Krebs- Ringer buffer samples was measured using a radioimmunoas- say kit (Linco Research Immunoassay, St. Charles, MO, USA).
Statistical analysis
The experimental results are presented as mean±standard er- ror. Statistical analysis was performed using SPSS version 11.5 (SPSS Inc., Chicago, IL, USA). An independent sample t-test was used to compare the mean values of the continuous vari- ables between the two groups. One-way ANOVA with a Fish- er’s post hoc analysis was used for the comparison of data among the experimental groups. P values of less than 0.05 were considered to be statistically significant.
RESULTS
The optimal concentration and incubation time for CoPP The expression of HO-1 mRNA was measured in INS-1 cells at varying concentrations of CoPP (0 nM, 500 pM, 5 nM, 50
a a a a
a
nM, 500 nM, 5 µM) using semi-quantitative RT-PCR. HO-1 mRNA was increased in a dose-dependent manner (Fig. 1). It was determined that 500 nM of CoPP was the optimal con- centration for the experiment. The treated INS-1 cells were then incubated with 500 nM of CoPP for 1, 2, 4, 6, and 24 hours,
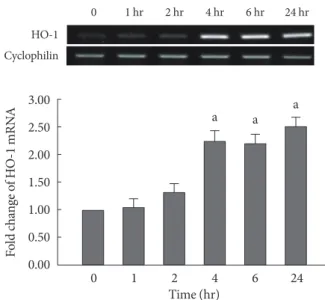
respectively. In the presence of 500 nM of CoPP, the expres- sion of the HO-1 mRNA was observed to increase in a time- dependent manner throughout the 24 hour period (Fig. 2).
Effect of CoPP on the INS-1 cell death rate by HG
We examined the cell protective effect of CoPP on INS-1 cells using a cytotoxicity assay. The cell viability was measured at varying concentrations of CoPP (0 nM, 500 pM, 5nM, 50nM, 500 nM, 5 µM, 50 µM). A significant diminishment of cell via- bility was observed at 5 µM and at 50 µM, and we found that maximum cell viability occurred at a concentration of 500 nM (Fig. 3). Subsequently we observed the cell death with AO/PI staining at LG and HG conditions in the presence or absence of CoPP. Cell death rate significantly increased under HG con- ditions compared with that of LG conditions (Fig. 4). Treat- ment of INS-1 cells with CoPP decreased cell death by approxi- mately 50% after 72 hours (Fig. 5).
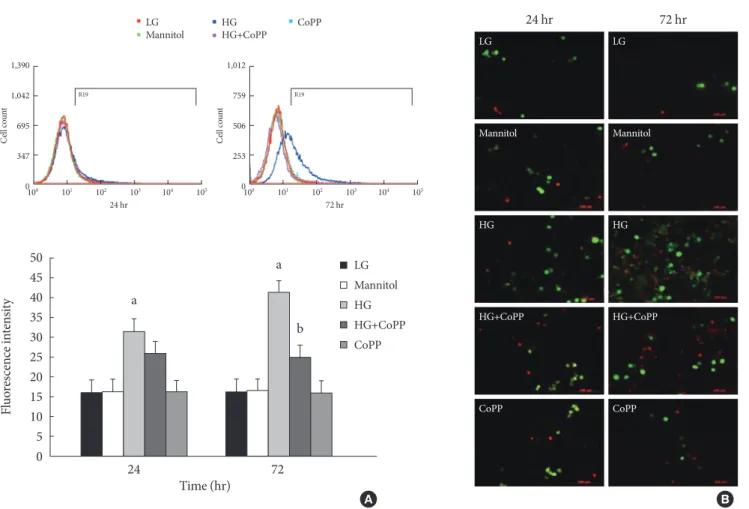
Generation of ROS at different glucose concentrations To observe the effect of CoPP on the generation of ROS in INS-1 cells exposed to HG, we measured ROS using flow cy- tometry with carboxy-H2DCFDA. The INS-1 cells were treat- ed with carboxy-H2DCFDA in 6-well plates and were observed by fluorescence microscopy. The INS-1 cells that were cultured for either 24 hours or 72 hours in HG had higher fluorescence intensity than that in the cells cultured in the LG condition.
Fluorescence intensity also decreased significantly after 72
0 nM 500 pM 5 nM 50 nM 500 nM 5 uM
0 nM 500 pM 5 nM 50 nM 500 nM 5 μM
CoPP concentration
HO-1 Cyclophilin
Fold change of HO-1 mRNA
2.50 2.00 1.50 1.00 0.50 0.00
Fig. 1. mRNA expression of heme oxygenase-1 (HO-1) in INS-1 cells after 24 hours treatment with different concentra- tion of cobalt protoporphyrin (CoPP) (0 nM, 500 pM, 5 nM, 50 nM, 500 nM, 5 µM, 50 µM). Data are mean±standard error of the 3 separate experiments. aP<0.01 vs. control (0 nM).
0 1 hr 2 hr 4 hr 6 hr 24 hr HO-1
Cyclophilin
0 1 2 4 6 24
Time (hr) Fold change of HO-1 mRNA 3.00
2.50 2.00 1.50 1.00 0.50 0.00
Fig. 2. Heme oxygenase-1 (HO-1) mRNA expression of INS-1 cells in the presence of 500 nM of cobalt protoporphyrin (CoPP) with different time course (1, 2, 4, 6, and 24 hours).
Data are mean±standard error of the 3 separate experiments.
aP<0.01 vs. control (0 nM).
2.50 2.00 1.50 1.00 0.50
0.00 0 24 72
Time (hr)
Relative ratio of living cells
a aa a
aa a
aa
0 nM 500 pM 5 nM 50 nM 500 nM 5 μM 50 μM
Fig. 3. Cytotoxicity assay of qualifying cell death in INS-1 cells. 5×10⁵ cells/well were seeded into a 96-well plate, and each well was treated with 10 µL of CCk-8 solution (Cell counting kit-8) for 3 hours at 37°C containing 5% CO2. Data are expressed as mean±standard error of the 3 separate exper- iments. aP<0.05 vs. control (0 nM).
hours in the presence of CoPP (Fig. 6A). However, there was no difference at 24 hours regardless of CoPP. Through fluores- cence microscopy, we found that increased ROS generation was observed at the HG condition at 72 hours. CoPP treatment was found to decrease ROS generation (Fig. 6B).
Changes in HO-1 and caspase-3 cleavage protein expression by HG
The expression levels of HO-1 and caspase-3 cleavage were also studied in INS-1 cells that were incubated for different dura- tions of time and glucose concentrations with or without CoPP.
The induction of HO-1 protein expression was clearly detected in INS-1 cells treated with CoPP independent of the culture Fig. 4. Cell death rate in cultured INS-1 cells according to ac- ridine orange (AO)/propidium iodide (PI) staining. (A) AO/
PI staining in the presence of mannitol, low glucose (LG; 5.5 mM/L), and high glucose (HG; 27.7 mM/L) concentrations in INS-1 cells. The red-stained cells are dead. (B) Time-depen- dent course of cell death rate. Image was obtained using a mi- croscope (×200). Data are expressed as mean±standard error of the 3 separate experiments. aP<0.05 vs. LG (72 hours).
24 hr
48 hr
72 hr
LG Mannitol HG
A
100 80 60 40 20
0 0 24 48 72
Time (hr)
Cell death (%)
a LG
Mannitol HG
B
time (Fig. 7A).
We did not find any differences in caspase-3 protein level among the groups with different glucose concentrations at 24 hours. However, incubation of INS-1 cells in HG for 72 hours significantly increased the expression of caspase-3. Treatment with CoPP significantly decreased the caspase-3 level by 50%, which indicates that CoPP ameliorates the HG-induced apop- tosis in INS-1 cells (Fig. 7B).
We also performed the TUNEL assay in order to observe INS-1 cell apoptosis under different culture conditions. High- er numbers of TUNEL-positive cells were found in INS-1 cells that were incubated in HG conditions for 72 hours. CoPP de- creases the number of apoptotic cells in INS-1 cells incubated in HG conditions (Fig. 7C).
GSIS in INS-1 cells
GSIS was performed in INS-1 cells after a 24- or 72-hour cul- ture period with different glucose concentrations, respectively.
At 24 hours of culture, the GSIS level showed no significant difference among the groups, which indicates no effect of HG on insulin secretion until 24 hours. However, at 72 hours, the insulin secretion in the HG condition had significantly de- creased compared to that of the LG condition. Moreover, GSIS was not restored even in the presence of CoPP (Fig. 8).
DISCUSSION
In this study, we found that the over-expression of HO-1 by CoPP resulted in the protection of INS-1 cells from HG-in- duced oxidative stress and apoptotic cell death.
Fig. 5. Effect of cobalt protoporphyrin (CoPP) on cell death rate in cultured INS-1 cells using acridine orange (AO)/prop- idium iodide (PI) staining. (A) AO/PI staining in the presence or absence of CoPP (500 nM) in INS-1 cells at different glu- cose concentrations. The red-stained cells represent dead cells.
(B) Effect of CoPP on cell death rate in cultured INS-1 cells using AO/PI staining. Imaging performed with a microscope (×200). Data are expressed as mean±standard error of the three separate experiments. aP<0.05 vs. low glucose (LG), bP<
0.01 vs. high glucose (HG).
A
B
24 hr 72 hr
LG LG
CoPP CoPP
HG HG
HG+CoPP HG+CoPP
24 72
Time (hr)
Cell death (%)
40 30 20
10 0
a LG
HG HG+CoPP Copp
b
a
Fig. 6. Intracellular peroxide level in INS-1 cells using flow cytometry. (A) The amount of reactive oxygen species (ROS) was measured to observe the effect of cobalt protoporphyrin (CoPP). (B) Fluorescence microscopy of ROS staining in INS-1 cells.
The green staining is DCFDA and the red staining is propidium iodide. Image obtained using a microscope (×200). Data are ex- pressed as mean±standard error of the three separate experiments. aP<0.01 vs. low glucose (LG), bP<0.05 vs. high glucose (HG).
A B
24 72
Time (hr)
Fluorescence intensity
50 45 40 35 30 25 20 15 10 5 0
a
b
LG Mannitol HG HG+CoPP CoPP
100 101 102 103 104 105 24 hr
Cell count
1,390 1,042 695 347 0
R19
100 101 102 103 104 105 72 hr
Cell count
1,012 759 506 253 0
R19
LGMannitol HG
HG+CoPP CoPP
LG LG
Mannitol Mannitol
HG HG
HG+CoPP HG+CoPP
CoPP CoPP
24 hr 72 hr
It is well established that chronic hyperglycemia in patients with type 2 diabetes mellitus causes progressive deterioration of β-cell function. In the present study, we investigated the ef- fect of HO-1 over-expression on β-cells that are exposed to high levels of glucose. We incubated INS-1 cells in a normal glucose condition for 48 hours, which did not result in cell death, as previously reported [15]. However, 72 hour exposure of INS-1 cells to HG media did increase the number of dead cells. HG in vitro is supposed to have a role in apoptosis in- duced by cytokines; however, it is of interest that our finding showed no difference in cytokine levels regardless of the glu- cose concentration of the culture media (data not shown). Our finding is not consistent with that of a previous study [16], but this can be explained by differences in the cell type, time course, and glucose concentrations that were used in cell culture.
Various studies have explored the mechanism by which
chronic elevation of glucose causes damage to β-cells. The oxi- dative stress that occurs in response to chronic exposure to HG can directly cause β-cell damage, which is mediated by an increased intracellular accumulation of ROS. The mechanisms of β-cell damage by ROS are enhanced by oxidizing nucleic acid, proteins, and membrane lipids [17]. Moreover, it has been proposed that ROS decreases the expression of genes that are associated with β-cell function and activates stress genes, such as HO-1, glutathione peroxidase, and A20, which are all in- volved in cell damage as well as cell defense [4,14,18].
The intracellular peroxide levels were detected using cyto- metric analysis to observe the effect of HO-1 up-regulation.
Our finding that HG, rather than lower glucose level, is capa- ble of generating more ROS in INS-1 cell lines is compatible with the findings published by Won et al. [19], which suggest that oxidative stress might be mediated by glucotoxicity. In
tion is known to be related to the up-regulation of HO-1. HO-1 is one of the antioxidant enzymes responsible for heme degra- dation, which catalyzes its oxidation into biliverdin, carbon monoxide (CO) and free iron [20]. The induction of HO-1 re- Fig. 7. Effect of cobalt protoporphyrin (CoPP) on protein level was determined using a Western blot analysis. (A) The level of heme oxygenase-1 (HO-1) protein. (B) The level of caspase-3 protein. (C) Confocal microscopy for TUNEL staining in INS- 1 cells at 72 hours. The green staining is TUNEL and the blue staining is DAPI. Imaging performed with a confocal micro- scope (×400). Data are expressed as mean±standard error for the 3 separate experiments. aP<0.05 vs. low glucose (LG), bP<
0.01 vs. high glucose (HG).
LG MN HG HG+CoPP CoPP PC
LG MN HG HG+CoPP CoPP PC β-acitn (45 kDa)
HO-1 (32 kDa)
β-acitn (45 kDa) HO-1 (32 kDa)
24 hr
72 hr
24 72
Time (hr)
Fold change of HO-1 protein
8.00 7.00 6.00 5.00 4.00 3.00 2.00 1.00 0.00
a
a
a
a
LG Mannitol HG HG+CoPP CoPP
LG MN HG HG+CoPP CoPP
LG MN HG HG+CoPP CoPP β-acitn (45 kDa)
Pro-caspase-3 (32 kDa) Cleavege-caspase-3
(20 kDa)
β-acitn (45 kDa) Pro-caspase-3
(32 kDa) Cleavege-caspase-3
(20 kDa)
24 hr
72 hr
24 72
Time (hr) Fold change of caspase-3 protein 14.00
12.00 10.00 8.00 6.00 4.00 2.00 0.00
b LG a
Mannitol HG HG+CoPP CoPP
A
B
LG
Mannitol
HG
HG+CoPP
CoPP
DAPI TUNEL Merge
this experiment, apoptosis was confirmed by the caspase-3 and TUNEL assay. Increased caspase-3 protein level and cell death rate in HG conditions were both decreased in parallel with the addition of CoPP. The effect of CoPP on cell protec-
C
sults in reduction of cytokine-mediated apoptosis in the βTC3 cell line and preservation of insulin release in vitro [21]. The mechanisms of action of HO-1 can be explained by the elevat- ed level of bilirubin, which has an antioxidant property via scavenging for ROS and the production of CO, both of which have an anti-inflammatory effect and inhibit apoptosis. In ad- dition, cellular free iron can lead to the formation of ferritin, which has an iron detoxifying effect [22].
Previous studies have shown that a marker for oxidative stress is elevated in an animal model of non-obese type 2 dia- betes [23]. However, antioxidant enzyme expression and activ- ity in insulin producing cells are known to be very low com- pared with those in other tissues [7]. Similarly, the results of our previous study, which observed gene expression in β-cell- rich tissue using laser capture microdissection, demonstrated that HO-1, an antioxidant enzyme, was not detected in endog- enous islets [24].
There is recent evidence that treatment of diabetic rats with antioxidants does protect β-cells against glucose toxicity. Anti- oxidants, such as NG-Methyl-l-arginine or aminoguanidine, have demonstrated recovery of insulin mRNA expression and release in HG conditions [25]. Also, over-expression of an an- tioxidant enzyme, such as superoxide dismutase or catalase, showed islet protection from oxidative stress in animal models [26,27].
Previous studies have demonstrated that CoPP has a cyto- protective effect, attributed to its ability to reduce inflamma- tion and cell damage via up-regulation of HO-1 [28]. Won et al. [19] has reported that hemin, another HO-1 inducer, in- creased HO-1 mRNA expression and insulin secretion was re-
stored at high glucose condition (30 mM). In terms of insulin secretion, our finding is different from that of Won et al. [19].
However, the direct effect of metaloporphyrin on insulin se- cretion is not fully elucidated. In addition, the glucose concen- tration in culture media and incubation time with metalopor- phyrin was different from those of our experiment. In the pres- ent experiment, HO-mRNA expression by CoPP increased in both a dose- and time-dependent manner. The optimal dose determined for HO-1 induction was different from that deter- mined in another experiment, and the higher concentration of CoPP leading to cell death in our study suggests that CoPP might have direct toxic effects on cultured islets even in lower glucose conditions. HO-1 protein levels were similar regard- less of the glucose concentration and culture time, but the augmented response after addition of CoPP was observed un- til 72 hours. This finding suggests that high glucose condition induces HO-1 induction but is not sufficient for cell protec- tion. In terms of insulin secretion, protophophyrin has been shown to enhance insulin secretion [14] and up-regulation of HO-1 increases GSIS under high glucose conditions. GSIS in INS-1 cells cultured in a high glucose condition for 72 hours was significantly decreased compared to cells in the LG condi- tion; in addition, it was not restored in the presence of CoPP. It is not clear whether HO-1 directly increases insulin secretion, but the insulin content was not measured in the present study.
The exact mechanism by which HO-1 up-regulation preserves insulin secretion from high glucose should be the subject of future research and elucidated. In summary, these results sug- gest that the induction of HO-1 in response to CoPP in a β-cell line provides a protective effect against HG-induced oxidative Fig. 8. The effect of cobalt protoporphyrin (CoPP) on glucose-stimulated insulin secretion at 24 hours and 72 hours in low glu- cose (LG; 5.5 mM/L) and high glucose (HG; 25 mM/L) concentrations. Data are expressed as mean±standard error of the 6 sep- arate experiments. aP<0.05 vs. LG.
5 mM 25 mM
24 hr 5 mM 25 mM
24 hr
Fold increase
2.50 2.00 1.50 1.00 0.50 0.00
a a
Fold increase
2.00 1.50 1.00 0.50 0.00 LG
Mannitol HG HG+CoPP CoPP
stress; however, the glucose stimulated insulin secretory re- sponse was not restored under HG condition.
CONFLICTS OF INTEREST
No potential conflict of interest relevant to this article was re- ported.
ACKNOWLEDGMENTS
This study was supported by the National Research Founda- tion of Korea Grant funded by the Korean government (NRF- 2011-0026129).
REFERENCES
1. Weyer C, Bogardus C, Mott DM, Pratley RE. The natural his- tory of insulin secretory dysfunction and insulin resistance in the pathogenesis of type 2 diabetes mellitus. J Clin Invest 1999;
104:787-94.
2. Kahn SE. The relative contributions of insulin resistance and beta-cell dysfunction to the pathophysiology of type 2 diabe- tes. Diabetologia 2003;46:3-19.
3. Hou ZQ, Li HL, Gao L, Pan L, Zhao JJ, Li GW. Involvement of chronic stresses in rat islet and INS-1 cell glucotoxicity induced by intermittent high glucose. Mol Cell Endocrinol 2008;291:
71-8.
4. Tanaka Y, Tran PO, Harmon J, Robertson RP. A role for gluta- thione peroxidase in protecting pancreatic beta cells against oxidative stress in a model of glucose toxicity. Proc Natl Acad Sci U S A 2002;99:12363-8.
5. Sumoski W, Baquerizo H, Rabinovitch A. Oxygen free radical scavengers protect rat islet cells from damage by cytokines. Di- abetologia 1989;32:792-96.
6. Busik JV, Mohr S, Grant MB. Hyperglycemia-induced reactive oxygen species toxicity to endothelial cells is dependent on paracrine mediators. Diabetes 2008;57:1952-65.
7. Tiedge M, Lortz S, Drinkgern J, Lenzen S. Relation between antioxidant enzyme gene expression and antioxidative defense status of insulin-producing cells. Diabetes 1997;46:1733-42.
8. Tiedge M, Lortz S, Munday R, Lenzen S. Protection against the co-operative toxicity of nitric oxide and oxygen free radicals by overexpression of antioxidant enzymes in bioengineered insulin-producing RINm5F cells. Diabetologia 1999;42:849-55.
9. Hohmeier HE, Thigpen A, Tran VV, Davis R, Newgard CB.
Stable expression of manganese superoxide dismutase (Mn- SOD) in insulinoma cells prevents IL-1beta-induced cytotox- icity and reduces nitric oxide production. J Clin Invest 1998;
101:1811-20.
10. Moriscot C, Pattou F, Kerr-Conte J, Richard MJ, Lemarchand P, Benhamou PY. Contribution of adenoviral-mediated superox- ide dismutase gene transfer to the reduction in nitric oxide-in- duced cytotoxicity on human islets and INS-1 insulin-secret- ing cells. Diabetologia 2000;43:625-31.
11. Maines MD. The heme oxygenase system: a regulator of sec- ond messenger gases. Annu Rev Pharmacol Toxicol 1997;37:
517-54.
12. Terry CM, Clikeman JA, Hoidal JR, Callahan KS. Effect of tu- mor necrosis factor-alpha and interleukin-1 alpha on heme oxygenase-1 expression in human endothelial cells. Am J Physiol 1998;274(3 Pt 2):H883-91.
13. Durante W, Kroll MH, Christodoulides N, Peyton KJ, Schafer AI. Nitric oxide induces heme oxygenase-1 gene expression and carbon monoxide production in vascular smooth muscle cells. Circ Res 1997;80:557-64.
14. Ye J, Laychock SG. A protective role for heme oxygenase ex- pression in pancreatic islets exposed to interleukin-1beta. En- docrinology 1998;139:4155-63.
15. Piro S, Anello M, Di Pietro C, Lizzio MN, Patane G, Rabuazzo AM, Vigneri R, Purrello M, Purrello F. Chronic exposure to free fatty acids or high glucose induces apoptosis in rat pancre- atic islets: possible role of oxidative stress. Metabolism 2002;
51:1340-7.
16. Mellado-Gil JM, Aguilar-Diosdado M. High glucose potenti- ates cytokine- and streptozotocin-induced apoptosis of rat islet cells: effect on apoptosis-related genes. J Endocrinol 2004;183:
155-62.
17. Halliwell B, Gutteridge JM. Free radical in biology and medi- cine. 2nd ed. Oxford: Clarendon Press; 1989.
18. Grey ST, Arvelo MB, Hasenkamp W, Bach FH, Ferran C. A20 inhibits cytokine-induced apoptosis and nuclear factor kap- paB-dependent gene activation in islets. J Exp Med 1999;190:
1135-46.
19. Won KC, Moon JS, Eun MJ, Yoon JS, Chun KA, Cho IH, Kim YW, Lee HW. A protective role for heme oxygenase-1 in INS-1 cells and rat islets that are exposed to high glucose conditions.
J Korean Med Sci 2006;21:418-24.
20. Maines MD. Heme oxygenase: function, multiplicity, regulato- ry mechanisms, and clinical applications. FASEB J 1988;2:
2557-68.
21. Pileggi A, Molano RD, Berney T, Cattan P, Vizzardelli C, Oli- ver R, Fraker C, Ricordi C, Pastori RL, Bach FH, Inverardi L.
Heme oxygenase-1 induction in islet cells results in protection from apoptosis and improved in vivo function after transplan- tation. Diabetes 2001;50:1983-91.
22. Ferris CD, Jaffrey SR, Sawa A, Takahashi M, Brady SD, Barrow RK, Tysoe SA, Wolosker H, Baranano DE, Dore S, Poss KD, Snyder SH. Haem oxygenase-1 prevents cell death by regulat- ing cellular iron. Nat Cell Biol 1999;1:152-7.
23. Ihara Y, Toyokuni S, Uchida K, Odaka H, Tanaka T, Ikeda H, Hiai H, Seino Y, Yamada Y. Hyperglycemia causes oxidative stress in pancreatic beta-cells of GK rats, a model of type 2 dia- betes. Diabetes 1999;48:927-32.
24. Ahn YB, Xu G, Marselli L, Toschi E, Sharma A, Bonner-Weir S, Sgroi DC, Weir GC. Changes in gene expression in beta cells
after islet isolation and transplantation using laser-capture mi- crodissection. Diabetologia 2007;50:334-42.
25. Tajiri Y, Moller C, Grill V. Long-term effects of aminoguani- dine on insulin release and biosynthesis: evidence that the for- mation of advanced glycosylation end products inhibits B cell function. Endocrinology 1997;138:273-80.
26. Chen H, Li X, Epstein PN. MnSOD and catalase transgenes demonstrate that protection of islets from oxidative stress does not alter cytokine toxicity. Diabetes 2005;54:1437-46.
27. Woo J, Iyer S, Mori N, Buelow R. Alleviation of graft-versus- host disease after conditioning with cobalt-protoporphyrin, an inducer of heme oxygenase-1. Transplantation 2000;69:623-33.
28. Chen X, Zhang Z, Su C, Gu W, Li H, Zhou G. Protective effect of heme oxygenase-1 to pancreas islet xenograft. J Surg Res 2010;164:336-43.