Spatiotemporal Gait Parameters That Predict Gait Function Based on Timed Up and Go Test Performance in the Hemiplegic Stroke Patients
Jeong-soo Kim1,2, MSc, PT, Jeong-ah Kim2, BHSc, PT, Hye-seon Jeon3,4, PhD, PT, Kyung-hoon Yu2,5, MSc, PT
1Dept. of Physical Therapy, Seoul Rehabilitation Hospital
2Dept. of Physical Therapy, The Graduate School, Yonsei University
3Dept. of Physical Therapy, College of Health Science, Yonsei University
4Dept. of Ergonomic Therapy, The Graduate School of Health and Environment, Yonsei University
5Dept. of Physical Therapy, Yonsei Madu Hospital
Abstract
1)The purpose of this study was to determine which spatiotemporal gait parameters obtained during hemiplegic walking could be a predictive factor for the Timed Up and Go test (TUG). Two hundreds nine subjects who had suffered a stroke were recruited for this study. They were participated in two assessments; the TUG test and gait analysis. The relationship between the TUG test and spatiotemporal parameters was analyzed using Pearson’s correlation coefficients. In addition, to predict the spatiotemporal gait parameters that correlated most with the TUG scores, we used multiple linear regression analyses (stepwise method). The results show that the normalized velocity was strongly correlated with the TUG performance (r=-.72, p<.001). Additionally, single support percentage (SSP), double support percentage (DSP), step time difference (STD), and step length difference (SLD) significantly were correlated with the TUG test. Normalized velocity, STD, DSP of affected side, and SSP of non-affected side explained 53%, 8%, 3%, 2%, of variance in the TUG test respectively. In conclusion, an increase in gait velocity and a decrease in STD would be effective indicators of improvement on the functional mobility in the stroke rehabilitation.
Key Words: Gait; Regression analysis; Stroke; Timed up and go test.
Introduction
Functional mobility including stand up, turn, and walk is an important ability needed by stroke survi- vors to perform daily activities, so it is a main goal in the stroke rehabilitation. To investigate functional improvements after interventions for stroke pop- ulations, we commonly use mobility assessments as like the Timed Up and Go test (TUG) (Podsiadlo and Richardson, 1991). The TUG consists of func- tional tasks such as standing up from a chair, walk- ing 3 m, turning, walking back, and sitting down.
As the TUG test can be performed easily without any complex assessment manual and has shown
good reliability and validity, it has been widely used for people with hemiparesis after stroke (Knorr et al, 2010; Ng and Hui-Chan, 2005).
Several studies have investigated the effects of physical impairments on the TUG score in stroke patients. The TUG scores were found to be corre- lated with ankle plantar flexor strengths (r=-.86), walking speeds (r=-.90 to -.57), walking endurances (r=-.96) (Ng and Hui-Chan, 2005), and the Berg Balance Scale scores (r=-.52 to -.72) (Faria et al, 2009). It has been reported that the spatiotemporal gait parameters such as gait velocity, stride length, and spatiotemporal asymmetry were altered after strokes (Patterson et al, 2008). These changes have Corresponding author: Kyung-hoon Yu [email protected]
Mean±SD Range Gender
Male 155
Female 54
Age (year) 57.1±.8 17.0∼82.0
Onset time (month) 4.2±.2 1.0∼24.0 Diagnosis
Infarction 106
Hemorrhage 103
Affected side
Left 110
Right 99
Height 166.6±9.1 142.0∼191.0
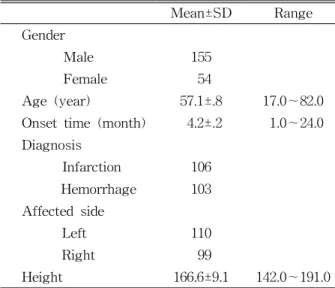
Table 1. General characteristics of subjects (N=209) been used as indicators of gait impairment, which result in difficulties during independent daily activ- ities and integration with the community (Schmid et al, 2007). Therefore, understanding what changes in spatiotemporal gait parameters interact with func- tional mobility is important in clinical practice.
Additionally, it could be helpful to clinicians and physical therapists in decision-making processes.
To our knowledge, the relationship between the TUG and the spatiotemporal gait parameters has not yet been investigated in post-stroke individuals.
Therefore, the aim of our study was to determine which spatiotemporal gait parameters during hemi- plegic walking could be a predictive factor for the TUG.
Methods
Subjects
Two hundreds nine subjects who suffered a stroke (155 males and 54 females) were recruited for this study from a rehabilitation hospital in Seoul, Korea.
The mean age±SD was 57.1±.8 years (range from 17 to 82 years). Inclusion criteria were: (1) hemiparesis secondary to first unilateral ischemic or hemorrhagic stroke; (2) post-stroke duration between 1 and 12
months; (3) those who had the ability to walk at least 10 m, if necessary, with or without an assistive device; and (4) the ability to comprehend simple in- structions for testing and training procedures (Folstein et al, 1975). Exclusion criteria were: (1) se- rious heart or other medical conditions; (2) orthopedic conditions causing any kind of gait dysfunction. All subjects agreed to join in the study and signed on informed consent. Table 1 shows the general charac- teristics of the subjects.
Experimental protocol
Data were collected from 209 subjects who par- ticipated in two assessments during three years: the TUG test and the gait analysis (spatiotemporal gait parameters). To limit inter-tester variability, the same physical therapist conducted both of the assessments.
Measurements
The Timed Up and Go (TUG) test The TUG test has been widely used to assess mobility, which consists of balance, transfer, and turning while walking (Podsiadlo and Richardson, 1991). On the cue “Go” the participant was asked to stand up, walk at a comfortable speed to a marked point, 3 m away from the chair, turn around, walk back, and sit down in the chair. The times for com- pleting the task were measured with a stopwatch, in seconds; it was deemed that a shorter time represent the better functional mobility. The test was per- formed three times, and the mean value was recorded. The TUG has excellent inter-rater and in- tra-rater reliability in stroke patients (ICCs=.95) (Ng and Hui-Chan, 2005).
The spatiotemporal data
Spatiotemporal gait parameters were measured us- ing GAITRite (CIR Systems Inc., Havertown, PA, USA) at the preferred, comfortable walking speed.
Each subject was instructed to walk over the mat at
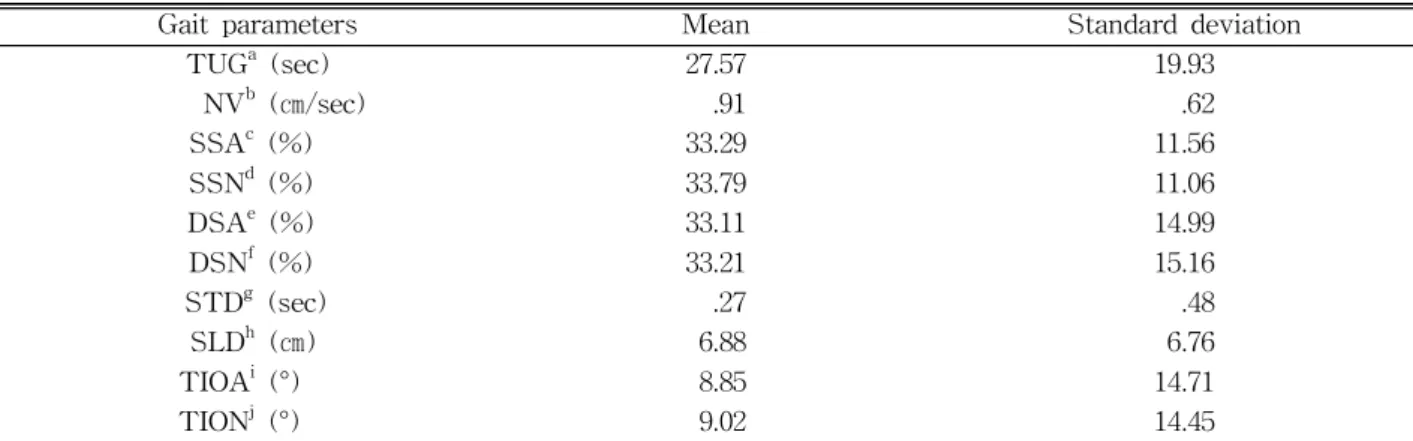
Table 2. Results of the Timed Up and Go test and spatiotemporal gait parameters
Gait parameters Mean Standard deviation
TUGa (sec) 27.57 19.93
NVb (㎝/sec) .91 .62
SSAc (%) 33.29 11.56
SSNd (%) 33.79 11.06
DSAe (%) 33.11 14.99
DSNf (%) 33.21 15.16
STDg (sec) .27 .48
SLDh (㎝) 6.88 6.76
TIOAi (°) 8.85 14.71
TIONj (°) 9.02 14.45
aTimed Up and Go test, bnormalized velocity, csingle support affected side, dsingle support non-affected side, edouble support affected side, fdouble support non-affected side, gstep time difference, hstep length difference, itoe-in-out affected side, jtoe-in-out non-affected side.
his or her usual, comfortable walking speed. The GAITRite system translated the spatial and temporal parameters via an electronic walkway connected to the serial port of a personal computer. Data were sampled at 60 ㎐ and calculated gait parameters us- ing software application. The sampling rate of the system is 80 ㎐. This system has generally provided excellent test-retest reliability in both of young and old people (Menz et al, 2004) and excellent con- current validity between the GAITRite and 3D mo- tion capture system in patients with stroke (Stokic et al, 2009). We collected the following variables as pri- mary outcome measures from the GAITRite system:
normalized velocity (㎝/s), step time (sec), step length (㎝), single support percentage (SSP), and double support percentage (DSP) in both limbs. In addition, we calculated the step time difference (STD), step length difference (SLD) and toe-in angle (°).
Statistical analysis
Data from all subjects were analyzed using the SPSS ver. 18.0 software (SPSS Inc., Chicago, IL, USA). The relationship between the TUG test and spatiotemporal parameters was analyzed using Pearson’s correlation coefficients. In addition, to pre- dict the spatiotemporal gait parameters, which corre- lated most with the TUG scores, we used multiple linear regression analyses (stepwise method). The
level of significance used was set at p<.05.
Results
The mean time to perform the TUG test was 27.57±19.93s. Mean and standard deviation of the spatiotemporal parameters are summarized in Table 2.
Pearson’s correlation
The TUG test shows a strongly negative correla- tion with normalized velocity (r=-.72, p<.001), and affected SSP (r=-.53, p<.001), and non-affected SSP (r=-.36, p<.001). The TUG shows a significant pos- itive correlation with DSP of affected side (r=.68, p<.001), DSP of non-affected side (r=.68, p<.001), STD (r=.60, p<.001), and SLD (r=.49, p<.001). There was no significant correlation between TUG test and toe-in-out (Table 3).
Stepwise regression
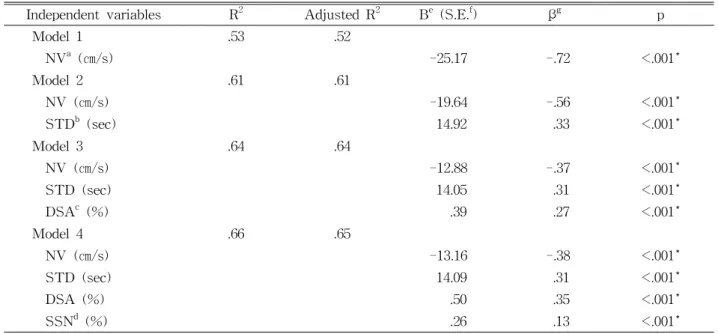
Table 4 shows the gait parameters selected in the first four stages of the stepwise multiple regressions.
According to the result, normalized velocity explained 53% of variance in the TUG test. STD, DSP of af- fected side, and SSP of non-affected side explained 8%, 3%, 2%, respectively. The following equations could be used to predict the TUG:
Gait parameters TUGa p
NVb (㎝/s) -.72 <.001
SSAc (%) -.53 <.001
SSNd (%) -.36 <.001
DSAe (%) .68 <.001
DSNf (%) .68 <.001
STDg (sec) .60 <.001
SLDh (㎝) .49 <.001
TIOAi (°) .42 .546
TIONj (°) -.82 .236
aTimed Up and Go test, bnormalized velocity, csingle support affected side,dsingle support non-affected side, edouble support affected side, fdouble support non-affected side,gstep time difference, hstep length difference, itoe-in-out affected side, jtoe-in-out non-affected side.
Table 3. Pearson correlations between the Timed Up and Go test and each gait parameters
Independent variables R2 Adjusted R2 Be (S.E.f) βg p
Model 1 .53 .52
NVa (㎝/s) -25.17 -.72 <.001*
Model 2 .61 .61
NV (㎝/s) -19.64 -.56 <.001*
STDb (sec) 14.92 .33 <.001*
Model 3 .64 .64
NV (㎝/s) -12.88 -.37 <.001*
STD (sec) 14.05 .31 <.001*
DSAc (%) .39 .27 <.001*
Model 4 .66 .65
NV (㎝/s) -13.16 -.38 <.001*
STD (sec) 14.09 .31 <.001*
DSA (%) .50 .35 <.001*
SSNd (%) .26 .13 <.001*
anormalized velocity, bstep time difference, cdouble support affected side, dsingle support non-affected side,
eunstandardized regression coefficient, fstandard error, gstandardized regression coefficient, *significance at the p<.01 level (two-tailed).
Table 4. Multiple linear regression analyses relating the Timed Up and Go test scores with the other variables
TUG=10.64-13.16 of normalized velocity+14.09 of STD+.5 of DSP of affected side+.26 of SSP of non-affected side.
Discussion
The aim of this study was to determine which
gait parameters could be a predictive factor for the TUG test in ambulatory hemiparetic patients. The results show that the TUG test significantly corre- lated with several gait parameters. In particular, nor- malized velocity strongly correlated with the TUG performance (r=-.72, p<.001). Moreover, SSP, DSP, STD, and SLD significantly correlated with the TUG test.
The velocity has been widely used as a measure- ment of gait performance and to differentiate levels of disability in the stroke population (Dickstein, 2008). It was not surprising to find that the patients with the highest walking velocity also performed the TUG test more rapidly because these two activities share dependent parameters. Previous studies found that the TUG highly correlates with gait velocity in 60-year-old adults and stroke (An et al, 2007;
Podsiadlo et al, 1991). However, the previous study suggested only 40 patients’ data. While the present study recruited larger sample size than these pre- vious studies.
The percentage of the gait cycle spent in SSP on the affected and less affected lower extremity shows moderate negative correlations with the TUG test.
These results mean that the duration of the both pa- retic SSPs increased the faster the performance on the TUG test. The TUG test measures various as- pects of walking ability which will include the bal- ance ability. Consequently, the SSP which is related to balance ability was significantly correlated with the TUG test. One of the major contributors to gait impairments in hemiparetic patients is difficulty in actively transferring body weight from one leg to the other (Alzahrani et al, 2009; Dettmann et al, 1987;
Wilkinson et al, 1997). Our results show that ther- apeutic approaches focused on weight shifting may improve the TUG test.
The symmetry provides a measure of the parallels between the two lower extremities; specifically, in- ter-limb ratios of step length and step time provide some insight into the underlying control of gait (Dewar and Judge, 1980; Patterson et al, 2010). For these reasons, the symmetry of step is one of the important gait parameters for evaluating stroke gait.
Furthermore, gait symmetry is clinically important since it could be related with negative results like as challenges to balance control, inefficiency, risks of musculoskeletal injury to the nonparetic lower ex- tremities and loss of bone mass density in the pa- retic lower limbs (Patterson et al, 2008). These neg-
ative result may affect functional aspects of gait, thus the asymmetry in spatiotemporal parameters has been commonly used clinically to evaluate the gait patterns in patients who have experienced a stroke.
Previous studies (Patterson et al, 2008) have reported that temporal asymmetry is a significant predictor of hemiparetic walking performances. Although the re- sults of our study are consistent with these studies, the spatial asymmetry moderately correlated with walking performance. Stroke patients may walk with different patterns of step length asymmetry; this may be related less to the walking performance than to temporal asymmetry.
Based on the multiple linear regression data from our study, the most predictive factor for the TUG was the fast normalized velocity. Additionally, STD, DSP of affected side, and SSP of non-affected side partly explained the TUG test. Our results show that the patients with the highest normalized velocity also performed the TUG test more rapidly. Treatment for improvement of gait velocity could be pertinent for improving TUG performance. The STD was the sec- ond predictive factor for the TUG test, although SLD could not be explain the TUG test. This has not previously been reported in hemiparetic patients.
Spatiotemporal asymmetry of gait parameters has been considered as one of the major contributors to gait impairment in hemiparetic patients (Rinaldi and Monaco, 2013). Rehabilitation is often focused on re- ducing spatiotemporal asymmetry of gait (Oken and Yavuzer, 2008). Our results show that we should fo- cus to temporal asymmetry of gait to improve TUG performance rather than spatial asymmetry of gait.
The mean TUG score of our study was 27.57±19.93 s. Podsiadlo and Richards (1991) found that older adults who were able to complete the TUG test in less than 20 s performed the transfer tasks needed in the activities of independent daily living, while those requiring 30 s or longer tended to be more dependent in daily activities and required assistive devices for gait (Podsiadlo and Richardson, 1991). Therefore, the results should be interpreted
relative to similar populations with a moderate limi- tation in functional activities.
Conclusion
The purpose of this study was to investigate which spatiotemporal gait parameters collected during hemiplegic walking could be a predictor for the TUG test. The results of the hemiparetic patients with moderate limitations of functional activities demon- strate that normalized velocity, SSP, DSP, STD, and SLD are the main predictive factors for the func- tional performance represented by the TUG test.
Overall, normalized velocity and STD explained the most TUG scores. Therefore, the findings of our study suggest that gait training programs which aim to improve TUG should focus on these parameters.
References
Alzahrani MA, Dean CM, Ada L. Ability to negotiate stairs predicts free-living physical activity in community-dwelling people with stroke: An ob- servational study. Aust J Physiother. 2009;55(4):
277-281.
An SH, Park CS, Lee HJ. Correlation between bal- ance, walking test and functional performance in stroke patients: BBS, TUG, Fugl-Meyer, MAS-G, C·MGS, and MBI. Phys Ther Kor.
2007;14(3):64-71.
Dettmann MA, Linder MT, Sepic SB. Relationships among walking performance, postural stability, and functional assessments of the hemiplegic patient. Am J Phys Med. 1987;66(2):77-90.
Dewar ME, Judge G. Temporal asymmetry as a gait quality indicator. Med Biol Eng Comput. 1980;
18(5):689-693.
Dickstein R. Rehabilitation of gait speed after stroke:
A critical review of intervention approaches.
Neurorehabil Neural Repair. 2008;22(6):649-660.
Faria CD, Teixeira-Salmela LF, Nadeau S. Effects of the direction of turning on the timed up & go test with stroke subjects. Top Stroke Rehabil.
2009;16(3):196-206.
Folstein MF, Folstein SE, McHugh PR. “Mini-mental state”. A practical method for grading the cog- nitive state of patients for the clinician. J Psychiatr Res. 1975;12(3):189-198.
Knorr S, Brouwer B, Garland SJ. Validity of the community balance and mobility scale in com- munity-dwelling persons after stroke. Arch Phys Med Rehabil. 2010;91(6):890-896.
Menz HB, Latt MD, Tiedemann A, et al. Reliability of the GAITRite walkway system for the quan- tification of temporo-spatial parameters of gait in young and older people. Gait Posture. 2004;
20(1):20-25.
Ng SS, Hui-Chan CW. The timed up & go test: Its reliability and association with lower-limb im- pairments and locomotor capacities in people with chronic stroke. Arch Phys Med Rehabil.
2005;86(8):1641-1647.
Oken O, Yavuzer G. Spatio-temporal and kinematic asymmetry ratio in subgroups of patients with stroke. Eur J Phys Rehabil Med. 2008;44(2):
127-132.
Patterson KK, Gage WH, Brooks D, et al. Evaluation of gait symmetry after stroke: A comparison of current methods and recommendations for standardization. Gait Posture. 2010;31(2):241-246.
Patterson KK, Parafianowicz I, Danells CJ, et al. Gait asymmetry in community-ambulating stroke survivors. Arch Phys Med Rehabil. 2008;89(2):
304-310.
Podsiadlo D, Richardson S. The timed “up & go”: A test of basic functional mobility for frail elderly persons. J Am Geriatr Soc. 1991;39(2):142-148.
Rinaldi LA, Monaco V. Spatio-temporal parameters and intralimb coordination patterns describing hemiparetic locomotion at controlled speed. J Neuroeng Rehabil. 2013;10(1):53.
Schmid A, Duncan PW, Studenski S, et al.
This article was received September 18, 2013, was reviewed September 18, 2013, and was accepted October 20, 2013.
Improvements in speed-based gait classifications are meaningful. Stroke. 2007;38(7):2096-2100.
Stokic DS, Horn TS, Ramshur JM, et al. Agreement between temporospatial gait parameters of an electronic walkway and a motion capture system in healthy and chronic stroke populations. Am J Phys Med Rehabil. 2009;88(6):437-444.
Wilkinson PR, Wolfe CD, Warburton FG, et al. A long-term follow-up of stroke patients. Stroke.
1997;28(3):507-512.