Received:June 2, 2020, Revised:(1st) June 5, 2020, (2nd) June 11, 2020, Accepted:June 11, 2020 Corresponding to:Eun Ha Kang http://orcid.org/0000-0001-9697-1159
Division of Rheumatology Department of Internal Medicine, Seoul National University Bundang Hospital, 82 Gumi-ro 173beon-gil, Bundang-gu, Seongnam 13620, Korea. E-mail:[email protected]
Han Joo Baek http://orcid.org/0000-0001-7558-052X
Division of Rheumatology, Department of Internal Medicine, Gachon University College of Medicine Gil Medical Center, 21 Namdong-daero 774beon-gil, Namdong-gu, Incheon 21565, Korea. E-mail:[email protected]
Copyright ⓒ 2020 by The Korean College of Rheumatology. All rights reserved.
This is an Open Access article, which permits unrestricted non-commerical use, distribution, and reproduction in any medium, provided the original work is properly cited.
Utility of Magnetic Resonance Imaging and Positron Emission Tomography in Rheumatic Diseases
Eun Hye Park, M.D., Ph.D.
1, Chong-Hyeon Yoon, M.D., Ph.D.
2, Eun Ha Kang, M.D., Ph.D.
3, Han Joo Baek, M.D., Ph.D.
41Division of Rheumatology, Department of Internal Medicine, Chung-Ang University Hospital, Seoul, 2Division of Rheumatology, Department of Internal Medicine, Eunpyeong St. Mary’s Hospital, The Catholic University of Korea, Seoul, 3Division of Rheumatology, Department of Internal Medicine, Seoul National University Bundang Hospital, Seongnam, 4Division of Rheumatology, Department of Internal Medicine, Gachon University College of Medicine Gil Medical Center, Incheon, Korea
The use of magnetic resonance imaging (MRI) and positron emission tomography (PET) in rheumatology allows a better under- standing of the pathophysiology of the disease as well as early diagnosis and appropriate evaluation of the disease status and treatment responses. Despite the limited availability because of the high cost, there is growing evidence for the advantages and clinical application of these modalities to various rheumatic diseases. This review discusses the basic mechanisms and clinical applications of MRI and PET in certain rheumatic diseases, including rheumatoid arthritis, axial spondyloarthritis, idiopathic in- flammatory myopathies, large vessel vasculitis, central nervous system disease associated with rheumatic diseases, poly- myalgia rheumatica, adult-onset Still’s disease, and immunoglobulin G4-related disease. (J Rheum Dis 2020;27:136-151) Key Words. Magnetic resonance imaging, Positron emission tomography, Rheumatic diseases
INTRODUCTION
Recently, novel imaging technologies, such as magnetic resonance imaging (MRI) and positron emission tomog- raphy (PET), have emerged in the field of rheumatology.
Despite their limited availability owing to their high cost, they provide unique information on patients with rheu- matic diseases. They may allow a better understanding of the pathophysiology of the disease as well as an early di- agnosis and appropriate evaluation of the disease status and treatment response. This paper reviews the basic mechanisms and clinical applications of MRI and PET in certain rheumatic diseases, including rheumatoid arthri- tis (RA), axial spondyloarthritis (axSpA), idiopathic in- flammatory myopathies (IIM), large vessel vasculitis (LVV), central nervous system (CNS) disease associated with rheumatic diseases, polymyalgia rheumatica (PMR),
adult-onset Still’s disease (AOSD), and immunoglobulin G4-related disease (IgG4-RD).
MAIN SUBJECTS
MRI
1) Principles of MRI
MRI uses powerful magnets and radio frequency (RF) to
produce three-dimensional images [1]. The application
of a strong, external magnetic field aligns protons within
the tissue, which is then disturbed by an external RF
energy. Tissue can be characterized by two different relax-
ation times, T1 and T2, which are distinguished according
to the time from the excitation of protons to relaxation
[1,2]. Water with long T1 values appears dark (low sig-
nal), whereas fat with short T1 values appears bright
(high signal) in the T1-weighted images. On the other
Figure 1. Wrist images of radio- graph (A) and magnetic resonance imaging (B∼D) in a patient with rheumatoid arthritis. (A) Plain radiograph shows only joint space narrowing of carpal bones.
(B) T1-weighted image reveals erosions of the carpal bones in the low-intensity signal. (C) These lesions slightly increase signal intensity by T2-weighted sequ- ence. (D) Active inflammation with high-intensity signal is no- ticeable at the same sites as shown in (B and C) by fat sup- pressed T2-weighted image.
Lesions are indicated by arrow- heads. Adopted from Kim et al.
J Korean Rheum Assoc 1995;2:
9-18 [20].
hand, T2-weighted images depict both fat and water with high signal intensity [2]. Muscle shows intermediate sig- nal intensity that is slightly higher than water but lower than fat in the T1-weighted images, and a much lower sig- nal intensity than both fat and water in the T2-weighted images [3].
Inflammatory lesions generally produce high-intensity signals in the T2-weighted images caused by edema (water); the fat also constitutes a significant proportion of the high-intensity signals. Intentional suppression of the fat signal augments true inflammatory lesions from the T2-weighted images [4-6] and can be applied to both T1- and T2-weighted sequences. Currently, fat saturation and short tau inversion recovery (STIR) are common methods for fat suppression [7]. Contrast agents, such as gadolinium, enhance highly vascularized lesions and are generally recommended when assessing the peripheral joints, particularly in inflammatory settings [8,9].
Occasionally, post-contrast T1 sequences are fat-sup- pressed to enhance the contrast resolution and improve the visibility of lesions [4,10].
MRI has excellent soft tissue resolution and can differ- entiate between fat, water, and muscle, and better charac- terize different joint structures, such as ligaments, hya- line, and fibrocartilage. Early bone involvement and in-
flammatory soft tissue changes to synovitis and tenosy- novitis, which cannot be detected using conventional ra- diographic methods, can be visualized and assessed in de- tail by MRI [11]. Moreover, MRI is currently the only imaging modality available for assessing inflammation within the bone marrow (i.e., osteitis), which has been reported to be highly predictive of subsequent bone ero- sions [11-15]. Although computed tomography (CT) is considered the gold standard for the detection of bony de- struction, MRI is another good method for monitoring the progression of erosions [16-18].
Because MRI does not involve ionizing radiation ex- posure, it can be applied in vulnerable populations, such as pregnant women and pediatric patients. On the other hand, MRI has several limitations, including relatively high cost and patient inconveniences, such as an enclosed claustrophobic space, long examination time, and loud noises. Moreover, MRI is sensitive to metal, thereby re- quiring specific safety measures in patients with metallic/
electronic implants or metallic foreign bodies. The tech- nique has a relatively low spatial resolution, resulting in thicker slices compared to CT [10,19].
2) Clinical applications of MRI in rheumatic diseases
The utility of MRI for non-inflammatory arthritis, such
as osteoarthritis, lies in its excellent anatomical reso- lution of soft tissues, of which the virtue is often missing from CT. The cartilage loss and degenerative changes in the supporting tissues, such as tendons and ligaments, can be identified by MRI. MRI has been the topic of inter- est in terms of its role in the diagnosis, monitoring, and prognosis prediction of inflammatory rheumatic diseases because of its ability to detect inflammatory changes as well as anatomic resolution.
(1) MRI in RA
MRI in the diagnosis of RA: Inflammatory arthritis is characterized by synovitis, bone marrow edema (BME), and adjacent tenosynovitis. The inflamed and hyper- trophied synovium is depicted by the high-intensity sig- nal in T2-weighted images, which would be more prom- inent in the fat suppressed T2-weighted images [9,20]
(Figure 1). BME lesions, which are some of the earliest findings of inflammatory arthritis, are detectable on MRI as early as nine weeks from the onset of symptoms [21,22].
Longitudinal studies of undifferentiated arthritis (UA) reported MRI to be an independent predictor of a sub- sequent diagnosis of RA [23,24]. In 116 patients with UA, a prediction model, including clinical hand arthritis, morning stiffness of more than one hour, rheumatoid fac- tor positivity, and the MRI BME score in the meta- tarsophalangeal and wrist joints, correctly identified the development of RA and non-RA in 82% of patients (sensitivity 81%, specificity 82%) [24].
In another study of UA, an assessment of MRI-detected tenosynovitis showed the best accuracy in predicting a fu- ture RA diagnosis, particularly among UA patients with oligoarthritis (odds ratio=7.5, 95% confidence interval [95% CI] 2.4∼23). The technique also had a high neg- ative predictive value of 95% (95% CI 89%∼98%) [25].
According to the European League against Rheumatism (EULAR) recommendations, MRI can be used to improve the certainty of diagnosis above the clinical criteria alone when a diagnosis of RA is in doubt. The presence of in- flammation on MRI can predict the progression of UA to clinical RA [26].
MRI in assessing the disease activity and structural damage in RA: MRI is valuable for assessing disease activ- ity and structural damage in RA. Synovitis on MRI was shown to be associated significantly with histologic syno- vial inflammation, clinical disease activity, and patient-re- ported outcomes in RA [27-29]. When evaluating the re- sponsiveness of MRI, ultrasonography, conventional ra-
diography, and the core measures of the disease activity in RA patients during the first year of treatment with tumor necrosis factor (TNF) inhibitors, the best measure of in- flammation was a composite measure comprising MRI synovitis, tenosynovitis, and BME [30].
MRI was superior to conventional radiography in detect- ing the early effects of different treatments on structural damage to bone and cartilage [31-33]. The level of agree- ment for the detection of bone erosions between MRI and CT was high (concordance at 77%∼90% of sites) in the RA wrist and metacarpophalangeal joints (MCPs) [16,17,34]. Based on CT as the reference method, the re- ported sensitivities and specificities for MCP erosions were 68% and 92% for MRI, 44% and 95% for US, and 26% and 98% for radiography [18].
The RA MRI scoring system (RAMRIS) developed by the Outcomes Measures in Rheumatology (OMERACT) is a validated scoring system that quantifies both in- flammation (synovitis, tenosynovitis, and BME) and joint damage (bone erosion and joint space narrowing) in RA hands and wrists [35]. The system has demonstrated con- struct validity, good inter- and intra-reader reliability, ex- cellent correlation with traditional radiographic meth- ods, and high sensitivity to change [36-38]. Assessments of inflammation and joint damage on MRI using the RAMRIS method have been used widely to evaluate the treatment responses in RA patients [30,31,39,40].
Predictive value of MRI for radiographic progression in RA: MRI assessments of inflammation and joint damage in the wrist or MCPs have predictive value for subsequent radiographic progression in the bilateral hands, wrists, and feet [12-15,32,41]. In particular, BME was reported to be the strongest predictor of future radiographic pro- gression in RA [12-15]. Regression analyses in the three- and five-year follow-up in two cohorts and clinical trials showed that BME on MRI had independently predicted the short-term and long-term (3, 5, and 11 years) radio- graphic progression in RA [13,41-43]. These studies showed that an MRI prediction for radiographic pro- gression was better than the clinical measure of the dis- ease activity alone. Subclinical inflammation observed on MRI in RA patients in clinical remission or low disease ac- tivity was also reported to be predictive of subsequent ra- diographic progression [44,45].
(2) MRI in axSpA
MRI in the diagnosis and classification of axSpA: MRI of
the sacroiliac joints (SI) is essential for the diagnosis and
classification of axSpA. The 2009 Assessment of
Figure 2. Active inflammatory lesions of the sacroiliac joints in non-radiographic axial spondyloarthritis. (A) There is no evidence of sacroiliitis on plain radiography. (B and C) Magnetic resonance imaging short tau inversion recovery (B) and fat suppressed gado- linium-enhanced T1-weighted images (C) show bone marrow edema with high-intensity signal (arrows). Adopted from Lee. J Rheum Dis 2014;21:110-21 [47].
SpondyloArthritis international Society (ASAS) classi- fication criteria led to differentiation between ankylosing spondylitis and non-radiographic axSpA (nr-axSpA) based on the presence of definite radiographic sacroiliitis and sacroiliitis in MRI [46]. To define nr-axSpA, MRI evi- dence of SI inflammation, which is radiographically oc- cult, was included. The ASAS published definitions for a positive MRI of the SI. Active sacroiliitis is indicated by the clear presence of BME in the subchondral bone of the SI on STIR, fat saturated T2-weighted, or gadolinium en- hanced T1-weighted images [5,47] (Figure 2). The sole presence of other inflammatory lesions, such as synovitis, enthesitis, or capsulitis without concomitant BME is not sufficient, and structural lesions, including fat meta- plasia, sclerosis, erosion or ankylosis, may be observed but are not required to meet the definition of active sac- roiliitis on MRI [5].
The ASAS-defined MRI changes based on BME lack specificity. Positive MRI findings, according to the ASAS definition, were also observed in patients with non-spe- cific back pain [48], postpartum women [49], military re- cruits [50], runners [49], athletes [51], as well as in the general population [52]. This suggests that the imaging arm of the ASAS classification criteria may identify false-positive classification and diagnosis. On the other hand, deep extensive BME lesions (a homogeneous, un- equivocal increase in signal ≥1 cm from the articular sur- face) were reported to be highly specific for axSpA-asso- ciated sacroiliitis [49].
In addition to the inflammatory MRI changes, structural changes in the SI have value for the classification and di-
agnosis of axSpA [53,54]. The SIMACT (sacroiliac joint MRI and CT study SacroIliac MAgnetic resonance Computed Tomography) study reported that using low-dose CT as the standard of reference, MRI T1-weighted images had better sensitivity with significantly more correct imaging findings than conventional radiographs for erosions (79% vs. 42%), joint space changes (75% vs. 41%), and overall positivity (85% vs. 48%). At the same time, there were no differences regarding the specificity between ra- diographs and MRI T1-weighted sequences (>80% for all scores) [53]. MRI T1-weighted images were inferior to radiographs only for sclerosis (sensitivity 30% vs. 70%, re- spectively), but the differences were not significant [53].
Fat metaplasia, which manifests as increased peri- articular signal intensity on the T1-weighted MR images, is typical for sacroiliitis [55,56]. On the other hand, MRI-detected fat metaplasia in SI was reported to be prevalent in subjects without axSpA subjects, ranging from 50.6% in patients aged <45 years to 94.4% in those
≥ 75 years, whereas MRI-detected erosions were un- common, less than 3% of the entire study population [57]. Some authors proposed a positive MRI for struc- tural lesions of the SI for classifying axSpA as follows: fat- ty lesions ≥3, erosions ≥3, or fatty lesions and/or ero- sions ≥5 [54,58].
MRI in an assessment of the treatment efficacy in
axSpA: Owing to its high performance on soft tissue and
BM abnormalities, MRI has been used to evaluate the effi-
cacy of treatments in axSpA. Treatment with biological
agents, such as TNF inhibitors and interleukin-17 in-
hibitors, reduced the MRI-detected inflammation sig-
nificantly in the spine and SI [59-64], which is not meas- ured by CT or plain radiography.
In addition to these inflammatory changes, the struc- ture-modifying effects of TNF inhibitors have also been documented using MRI in patients with axSpA [62,65].
The mean SPARCC (the Spondyloarthritis Research Consortium of Canada) SI erosion score decreased (−0.6), and the SPARCC SI backfill score increased (+0.8) after a 12-week treatment with adalimumab [62]. Significant re- ductions in erosions (−0.57) and increases in backfill (+0.36) in the SI compared to placebo (−0.08 and 0.06, respectively) were also observed in patients with nr-axSpA following 12-week etanerept therapy [65].
(3) MRI in IIM
MRI is an essential imaging tool for evaluating muscle involvement in the IIM [66]. MRI assists in the diagnosis of IIM by providing important pathological changes, in- cluding muscle edema (inflammation), fasciitis, subcuta- neous inflammation, muscle atrophy, and fatty replacement.
Because inflammatory lesions are often patchy, MRI plays a role in selecting the optimal site for a muscle biopsy and reducing the rate of false-negative results [67,68]. MRI also helps define the extent of muscle involvement, dis- ease activity (water signal changes), and the chronicity of the disease (fatty replacement and muscle atrophy) [66,69]. Therefore, MRI is considered an appropriate di- agnostic and monitoring tool that can reflect both in- flammation and damage to the affected muscle.
No standardized and validated scoring system for evalu- ating the muscle MRI has been developed [70]. Various semi-quantitative scoring systems and quantitative methods for assessing different muscle MRI signal pa- rameters have been suggested. Muscle edema has been evaluated semi-quantitatively not only in the individual muscles [71,72] but also in whole muscle compartments [73]. A Norwegian study proposed a scoring system for evaluating the MRI changes associated with the disease activity (edema in muscles and fascia; score 0∼42) and damage (fatty replacement and muscle volume reduction;
score 0∼36) with a total MRI score of 0∼78 [73].
Because quantitative evaluation systems are based on computer analysis of the pixel intensity values, they pro- vide a more precise evaluation of the muscle changes with statistically well-defined outcomes. These quantitative methods showed a good correlation with semi-quantita- tive evaluation systems [74,75].
Thigh MRI patterns varied by the clinical subsets of IIM have been described. Polymyositis (PM) is likely to in-
volve the proximal thigh muscles, either globally or pre- dominantly in the posterior muscle group [76]. The mus- cle edema in PM was diffuse due to the immune reaction in the myofibers. On the other hand, muscle edema in dermatomyositis (DM) involved the anterior muscle groups predominantly and was rather focal and patchy [77]. Fascial edema appeared to be characteristic of DM [78,79] because of the underlying pathophysiology of DM, such as perivascular and perifascicular inflammation, and possible ischemic damage [80]. Immune-mediated necrotizing myopathies (IMNM), particularly in patients with the anti-signal recognition particle, had significantly more widespread muscle edema, atrophy and fatty re- placement than those with PM and DM, using semi-quan- titative scoring systems [79]. Patients with inclusion body myositis showed more severe muscle atrophy and fatty replacement than those with PM, DM, and anti-hy- droxy-3-methylglutaryl-coenzyme A reductase-positive IMNM [79].
(4) MRI/MRA in LVV
LVV is the most common form of primary vasculitis comprising Takayasu arteritis (TA) and giant cell arteritis (GCA). MRI and magnetic resonance angiography (MRA) are valuable methods for evaluating LVV. MRA is a speci- alized MRI technique to focus on blood vessels and flow, and is an alternative to or used in conjunction with MRI.
The advantages of MRI/MRA are the absence of radiation and the high resolution of both the walls and lumens of the heart, entire aorta, and its branches. Wall edema (water content) on the T2-weighted images and diffuse circumferential wall thickness or mural contrast en- hancement on the T1-weighted images are early signs of vessel inflammation [81]. EULAR has recommended MRI/MRA for diagnosing and evaluating LVV [82].
MRI/MRA in TA: TA primarily affects the aorta and its main branches. When contrast-enhanced MRI/MRA was compared with conventional angiography in 30 suspected patients, MRI/MRA was highly sensitive to the aorta and its branches (100%); only 50% of pulmonary artery le- sions were detected [83]. Therefore, the diagnostic accu- racy can differ according to the arteries involved.
According to meta-analysis, MRA showed a higher sensi- tivity of 92% compared to ultrasound (81%), even though both had a similar specificity of >90% for a TA diagnosis [84].
MRI/MRA has also been used to monitor the disease ac-
tivity of TA. Evidence of wall edema of at least one vessel
segment by MRI/MRA decreased from 94% (17/18) of
patients with clinically active disease to 56% (24/43) of clinically remitted patients [85]. Although MRI could provide more accurate information on the inflammatory activity than the clinical criteria, the presence of vessel wall edema did not correlate with the subsequent vas- cular anatomy changes. This has raised concerns regard- ing assessments of the disease activity relying on MRI vessel wall edema solely.
MRI/MRA in GCA: GCA also involves the aorta and its major branches, with a predilection for the branches of the carotid, including the superficial temporal artery. The MRI findings of GCA correlated well with the histological findings of temporal arteries and with the fulfillment of the American College of Rheumatology clinical criteria [86,87]. High-resolution MRI allowed detailed visual- ization of the temporal arteries and occipital arteries bi- laterally with mural thickening and contrast enhance- ment as the vasculitic findings. In particular, MRI/MRA may be useful in those with non-temporal cranial vessel involvement. According to a meta-analysis of five pro- spective studies, the sensitivity and specificity of MRI were 68%∼89% and 73%∼97%, respectively, for the di- agnosis of GCA [88]. Unlike diagnostic purposes, MRI provides only limited evidence for monitoring the disease activity in GCA. On the other hand, some studies showed that mural enhancement improved significantly after treat- ment [86,89].
(5) MRI in CNS lesions of rheumatic diseases
The organic CNS involvement of rheumatic diseases is diverse, including parenchymal inflammatory lesions, is- chemic events, demyelinating lesions, and meningitis.
Parenchymal inflammatory lesions consist of focal le- sions, such as vasculitis or diffuse lesions, such as encephalitis. MRI is considered the gold standard of CNS imaging based on its superior sensitivity and accuracy than other modalities for the morphological detection of these lesions [90]. In particular, MRI offers better visual- ization of the posterior cranial fossa, containing the brainstem and the cerebellum, as well as good contrast between the grey and white matter. The detailed anatomi- cal structures of CNS are well contrasted by T1- and T2-weighted images with or without enhancement, which are the most widely used sequences for inflammatory CNS lesions with a similar manner of interpretation for musculoskeletal images [91].
MRI is the most useful neuroimaging study in patients with neuropsychiatric systemic lupus erythematosus (NPSLE). The technique may reveal abnormalities that
reflect focal NPSLE. From a large series (n=108) of NPSLE, abnormal MRI findings of the brain were found in 60%. Small-vessel diseases, such as white-matter hyper- intensities, atrophy, microbleeds, lacunae, and recent small subcortical infarct, were the most common (57%), followed in order by large-vessel diseases (13%) and in- flammatory-like lesions (6.5%). Cerebrovascular syndrome correlated with large-vessel diseases and microbleeds, whereas cognitive dysfunction correlated with white-mat- ter hyperintensities [92]. White matter lesions or peri- ventricular hyperintensities can be observed in patients with SLE who do not have neuropsychiatric symptoms [93].
MRI should be performed in all patients suspected of having primary CNS vasculitis on account of sensitivity in detecting abnormalities in CNS vasculitis [94]. MRI of the brain commonly shows multiple infarcts in multiple vascular territories, but it is not specific for CNS vasculitis. Infarcts can often be found in areas of the brain not affected by the more common causes of stroke (such as the corpus callosum) and rarely tumor-like lesions [95]. MRA, which is the most reliable for assessing the large proximal arteries, is inadequate for primary CNS vasculitis because most cases of primary CNS vasculitis have medium and small intracranial arteries affected rather than the large proximal arteries. Involvement of the large proximal intracranial arteries indicates an alter- native diagnosis in the appropriate clinical context.
Several different imaging sequences other than conven- tional T1- and T2-weighted images have also been used.
For ischemic lesions, diffusion-weighted (DW) se- quences, in which the diffusion of water molecules gen- erates contrast in MRI, are useful. DW images allow the early detection of ischemic lesions before overt diffuse damage in CNS, which is evident in conventional T1- or T2-weighted images by tracing the reduced water con- tents associated with reduced blood flow [96]. Fluid at- tenuation inversion recovery images are often used to evaluate white matter plaque near the ventricles or to identify demyelination.
MRI is also effective for evaluating the longitudinal
changes of the above lesions after treatment. Overall,
MRI is an indispensable tool for evaluating diverse CNS
pathologies associated with rheumatic diseases, provid-
ing information for quick and critical decision making for
diagnosis and treatment.
Figure 3. 18F-fluorodeoxyglucose positron emission tomography images of a patient with giant cell arteritis. There is increased uptake of fluorodeoxyglucose in the walls of ascending aorta, aortic arch, thoracic descend- ing aorta, both subclavian ar- teries, both common carotid ar- teries and both common femo- ral arteries. Adopted from Yoo et al. J Rheum Dis 2015;22:
382-6 [114].
PET
1) Principles of PET
PET is an imaging technique that uses radioactive sub- stances to visualize and measure various metabolic proc- esses in the body [97].
18F-fluorodeoxyglucose (FDG) is a radiopharmaceutical that is used to evaluate the glucose metabolism and is currently the most widely used PET tracer [98] to detect enhanced glucose uptake from the high glycolytic activity of cancer cells or inflammatory cells [99,100]. CT and PET have been combined (PET/CT) to evaluate the anatomy and function because accurate anatomical localization of various functional abnormal- ities is difficult from PET alone [101].
In addition to the diagnosis of cancer [99], PET/CT is used under a range of conditions, including inflammatory, infectious, cardiovascular, and neurological diseases [102]. In particular, its indication has been widening to rheumatic diseases, such as LVV, PMR, IIM, AOSD, and IgG4-RD.
2) Clinical applications of PET in rheumatic diseases
(1) PET in LVVDetermination of the PET activity in LVV: A visual grad- ing scale (vascular to liver uptake) is recommended when interpreting the arterial wall FDG uptake in PET. A stand- ardized 0∼3 grading system is used for a visual grading scale: 0=no uptake (≤mediastinum); 1=low-grade up- take (<liver); 2=intermediate-grade uptake (=liver); 3=
high-grade uptake (>liver). Grade 2 is possibly indicative, and grade 3 is considered positive for active LVV [103,104]. A total vascular score (TVS; 0∼21) can be cal- culated from a summation of each score from seven vas- cular regions (thoracic and abdominal aorta, and sub-
clavian, carotid, axillary, iliac, and femoral arteries).
Quantitative methods, such as simple standardized up- take value (SUV) metrics and target-to-background ratios (TBR), have also been proposed. Erroneous signal quan- tification can occur when using the injected radiotracer dose, patient weight, and imaging time point. Therefore, TBR is recommended over SUV because the use of the ra- tio between two measurements can minimize the effects on signal quantification of errors [105]. TBR methods us- ing lung [106], liver [107], or blood pool [108,109] as a reference have been proposed. A target-to-blood pool method was applied successfully in LVV [109,110], and is currently recommended by the cardiovascular committee of the European Association of Nuclear Medicine for the assessment of vascular wall inflammation [105].
PET in the diagnosis of LVV: Previous studies have re- ported the utility of PET in diagnosing LVV [104,111-114]
(Figure 3). Meta-analysis of eight studies, including 170
LVV patients with GCA or TA and 230 controls, reported
that the pooled sensitivity and specificity of PET or
PET/CT were 75.9% and 93.0%, respectively, with a high
positive likelihood ratio of 7.267 [111]. PET showed
higher diagnostic performance for the identification of
GCA than TA (87% vs. 58%, respectively; p<0.0001)
[104,111]. In a study that evaluated the concordance of
PET/CT and aortic CT angiography (CTA) in the diag-
nosis of GCA, both PET/CT and CTA could detect
large-vessel involvement with comparable results in a
per-patient analysis. On the other hand, PET/CT showed
higher performance in a per-segment analysis, partic-
ularly in the detection of inflammation in branches of the
aorta [115]. PET/CT was also useful for assessing local
inflammatory and vascular remodeling events independent
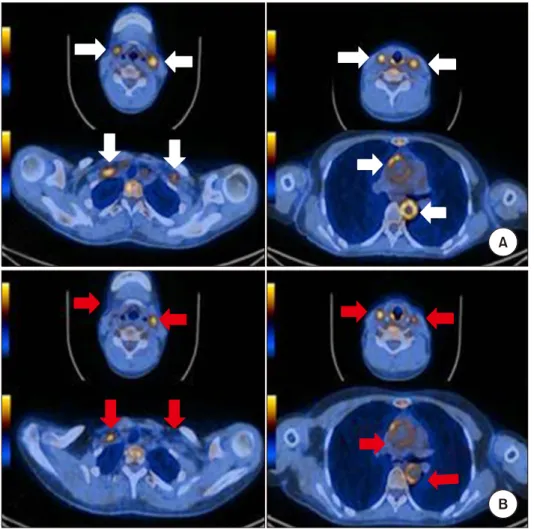
Figure 4. Positron emission to- mography/computed tomography (PET/CT) images of patient with Takayasu’s arteritis (axial view).
(A) The initial image obtained at the time of diagnosis demon- strates increased uptake of fluo- rodeoxyglucose at both com- mon carotid arteries, subclavian arteries and thoracic and ab- dominal aorta (white arrow). (B) PET/CT after 3 months of the treatment with infliximab showed the uptake of both common car- otid arteries, subclavian artery and aorta baseline is decreased (red arrow). Adopted from Choi et al. J Rheum Dis 2017;24:
55-9 [125].
of systemic inflammation during the follow-up, even in lesions where the arterial wall was less than 4 mm thick [116]. Recent EULAR recommendations for the imaging modalities in LVV included PET to diagnose LVV [82].
PET in monitoring efficacy of treatment in LVV: Patients with LVV can develop new arterial lesions during periods of apparent clinical remission, and the PET activity during clinical remission was shown to predict future clinical re- lapse and angiographic progression of the disease [112,117]. Treatment of patients with LVV showed a de- crease in arterial FDG uptake with corresponding im- provement in the clinical and serological outcomes [118-125] (Figure 4). Most of these studies used only small patient cohorts with retrospective study designs, as well as relatively short follow-up intervals between imag- ing assessments. In a prospective study of 35 GCA pa- tients with repetitive whole-body PET/CT acquired at the baseline and after three and six months of glucocorticoid therapy, the mean TVS declined significantly on repeated PET at three months (from 7.9±5.5 to 2.4±3.5), but no further decrease was observed at six months [120].
Another prospective study in 12 active TA patients re- vealed a significant decrease in the qualitative PET Vascular Activity Score (PETVAS), and quantitative PET parameters on the follow-up PET/CT at week 30 after in- fliximab biosimilar therapy [123]. A recent six-month prospective study of 52 LVV patients using PETVAS re- ported that the treatment intensification led to a sig- nificant decrease in disease activity by imaging, clinical, and inflammatory markers. On the other hand, weakened treatment significantly worsened the PET activity with- out changing the clinical and serologic activity [124].
Based on the available evidence, PET is a potential tool for assessing the disease activity and treatment responses in LVV [126] (Figure 4). Nevertheless, further studies with a longer duration of repeated PET will be needed to con- firm whether the PET uptake continues to improve with treatment.
(2) PET in PMR
PMR is an inflammatory rheumatic condition charac-
terized by aching and morning stiffness of the shoulders,
hip girdle, and neck, which is sometimes associated with
GCA. A prospective study of 35 PMR patients, using the same methodology as that for GCA [120], reported in- creased FDG uptake in the shoulder, hips, and spinous processes of the vertebrae [127]. Further studies con- firmed that PET/CT is useful for the diagnosis of PMR [128,129]. A high FDG uptake at two or more sites among ischial tuberosities, greater trochanters, and lum- bar spinous processes showed high sensitivity (85.7%) and specificity (88.2%) for the diagnosis of PMR [129].
Bilateral diffuse lower limb, pelvic girdle, or inflammatory low back pain was reported to be predictors of a positive PET/CT scan for LVV in PMR [130]. Positive PET scans in patients with PMR did not correlate with their risk of re- lapse [127].
Regarding an assessment of the treatment response by PET/CT in PMR, the FDG uptake may reflect the disease activity. The FDG uptake was shown to decrease but was still present after three and six months of glucocorticoid therapy in patients with PMR [127]. A multicenter clin- ical trial assessing tocilizumab therapy in PMR patients reported a moderate decrease in the FDG uptake after to- cilizumab therapy [131].
(3) PET in IIM
PET/CT may be used to detect inflammation in active IIM [132,133]. On the other hand, increased FDG muscle uptake is non-specific for myositis because it may simply reflect the intensity of metabolic activity within the af- fected muscles [132]. Increased FDG uptake can be ob- served even in normal muscles after physical exercise.
PET/CT can also be used as a reliable screening tool of cancer in IIM, where an exceptionally high risk of malig- nancy exists [134].
(4) PET in AOSD
AOSD is a rare systemic inflammatory disease, of which fever, arthritis, and salmon-colored rash are the main characteristics. The patients may have pharyngitis or lymphadenopathy. Leukocytosis and elevated levels of se- rum ferritin can be noted. The patients usually present with fever of unknown origin (FUO). The diagnosis of AOSD is one of the challenges because infections, malig- nant tumors, and other autoimmune diseases that may have similar symptoms should be excluded ahead [135].
PET/CT can be applied to detect or exclude malignant tumors and infections [136-138]. In addition, it can also be used for a differential diagnosis between AOSD and other connective tissue diseases. In the case of AOSD, PET/CT shows characteristic FDG accumulation in the bone marrow, spleen, lymph nodes, joints, and salivary
glands [139,140]. This helps select the appropriate biop- sy location [141]. Because the visual grade and SUV in- tensity of FDG from lymph nodes, spleen, and bone mar- row were co-related with the AOSD disease activity, it can be a tool for assessing the disease activity [142]. Compared to other connective tissue diseases, patients with AOSD show more frequent and stronger FDG uptake by the spleen and bone marrow, and lymphadenopathy is char- acterized by symmetrical involvement, mainly in the neck and axilla. In some cases of lymphoma, it is difficult to distinguish from AOSD, but they appear to show en- larged lymph nodes with morphological characteristics different from reactive hyperplasia [143].
From a large prospective study on the patients with FUO or inflammation of an unknown origin, of which a vast majority were finally identified as having rheumatic dis- eases, such as AOSD, PET/CT led to a substantial in- crease in the diagnosis of the patients (up to 57% of them). In particular, 80% of afebrile elderly patients with high CRP were predicted to have their underlying disease identified [144].
(5) PET in IgG4-RD
IgG4-RD is an immune-mediated fibro-inflammatory syndrome that shares certain pathological, serological, and clinical features but with an unknown etiology [145].
Patients often present with tumors in the affected organs.
This is common among middle-aged and elderly men.
The main pathological features of IgG4-RD are the tissue infiltration of IgG4 positive plasma cells and small lym- phocytes [146]. In general, a patient has multiple symp- toms that can be classified into four categories: pancre- atic-hepatic-biliary disease, retroperitoneal fibrosis and aortitis, head and neck disease, and classic Mikulitz syn- drome with systemic involvement [147].
A prospective cohort study on the patients with IgG4-RD found that PET/CT was more sensitive in de- tecting organ involvement than other techniques [148].
The study reported characteristic findings, such as in-
creased diffuse uptake in the pancreas and salivary
glands, patch lesions in the retroperitoneal region and
vascular wall, and multi-organ involvement that was less
likely to be a metastasis. PET/CT was also useful in a bi-
opsy, treatment decisions, and evaluations of the treat-
ment response [148]. In a study of patients with clinically
suspected IgG4-RD, PET/CT of the patients diagnosed as
having IgG4-RD showed more likely multi-organ involve-
ment, lower maximum SUV (SUV
max) of the main in-
volved organ and higher SUV
maxof the submandibular
glands, compared to those with other diseases [149].
Using these parameters as the diagnosis criteria, the sen- sitivity and specificity for a diagnosis of IgG4-RD were up to 86% and 66%, respectively. Subsequent studies dem- onstrated PET/CT were helpful for diagnosis, identi- fication of the involved organs, biopsy guidance, and treatment response evaluation of IgG4-RD, including sclerosing sialadenitis, autoimmune pancreatitis, and ret- roperitoneal fibrosis [150-153].
CONCLUSION
The growing evidence of MRI and PET justify their use in research and the routine care of patients with various rheumatic diseases. MRI and PET can play an important role in early diagnosis and monitoring the disease activity and response to therapy in patients with rheumatic diseases.
CONFLICT OF INTEREST
No potential conflict of interest relevant to this article was reported.
AUTHOR CONTRIBUTIONS
E.H.P. contributed to the study design, literature review and analysis, and to writing the manuscript. C.H.Y. con- tributed to the study conception and design, and to re- viewing the manuscript. E.H.K. and H.J.B. equally con- tributed to the study conception and design, literature re- view and analysis, and to writing and completing the manuscript.
REFERENCES
1. Westbrook C, Roth CK, Talbot J. MRI in practice. 4th ed.
Chichester, Wiley-Blackwell, 2011.
2. Grover VP, Tognarelli JM, Crossey MM, Cox IJ, Taylor- Robinson SD, McPhail MJ. Magnetic resonance imaging:
principles and techniques: lessons for clinicians. J Clin Exp Hepatol 2015;5:246-55.
3. May DA, Disler DG, Jones EA, Balkissoon AA, Manaster BJ. Abnormal signal intensity in skeletal muscle at MR imaging: patterns, pearls, and pitfalls. Radiographics 2000;20:S295-315.
4. Østergaard M, Duer A, Møller U, Ejbjerg B. Magnetic reso- nance imaging of peripheral joints in rheumatic diseases.
Best Pract Res Clin Rheumatol 2004;18:861-79.
5. Lambert RG, Bakker PA, van der Heijde D, Weber U, Rudwaleit M, Hermann KG, et al. Defining active sacroilii-
tis on MRI for classification of axial spondyloarthritis: up- date by the ASAS MRI working group. Ann Rheum Dis 2016;75:1958-63.
6. Sung S, Kim HS, Kwon JW. MRI assessment of sacroiliitis for the diagnosis of axial spondyloarthropathy: compar- ison of fat-saturated T2, STIR and contrast-enhanced sequences. Br J Radiol 2017;90:20170090.
7. Delfaut EM, Beltran J, Johnson G, Rousseau J, Marchandise X, Cotten A. Fat suppression in MR imaging: techniques and pitfalls. Radiographics 1999;19:373-82.
8. Ostergaard M, Conaghan PG, O'Connor P, Szkudlarek M, Klarlund M, Emery P, et al. Reducing invasiveness, dura- tion, and cost of magnetic resonance imaging in rheuma- toid arthritis by omitting intravenous contrast injection -- does it change the assessment of inflammatory and de- structive joint changes by the OMERACT RAMRIS? J Rheumatol 2009;36:1806-10.
9. Sudoł-Szopińska I, Jurik AG, Eshed I, Lennart J, Grainger A, Østergaard M, et al. Recommendations of the ESSR Arthritis Subcommittee for the use of magnetic resonance imaging in musculoskeletal rheumatic diseases. Semin Musculoskelet Radiol 2015;19:396-411.
10. Eshed I, Hermann KGA. MRI in imaging of rheumatic dis- eases: an overview for clinicians. Clin Exp Rheumatol 2018;36 Suppl 114:10-5.
11. Østergaard M, Pedersen SJ, Døhn UM. Imaging in rheuma- toid arthritis--status and recent advances for magnetic res- onance imaging, ultrasonography, computed tomography and conventional radiography. Best Pract Res Clin Rheumatol 2008;22:1019-44.
12. Hetland ML, Ejbjerg B, Hørslev-Petersen K, Jacobsen S, Vestergaard A, Jurik AG, et al.; CIMESTRA study group.
MRI bone oedema is the strongest predictor of subsequent radiographic progression in early rheumatoid arthritis.
Results from a 2-year randomised controlled trial (CIMESTRA).
Ann Rheum Dis 2009;68:384-90.
13. Hetland ML, Stengaard-Pedersen K, Junker P, Østergaard M, Ejbjerg BJ, Jacobsen S, et al.; CIMESTRA study group.
Radiographic progression and remission rates in early rheumatoid arthritis - MRI bone oedema and anti-CCP predicted radiographic progression in the 5-year extension of the double-blind randomised CIMESTRA trial. Ann Rheum Dis 2010;69:1789-95.
14. Haavardsholm EA, Bøyesen P, Østergaard M, Schildvold A, Kvien TK. Magnetic resonance imaging findings in 84 patients with early rheumatoid arthritis: bone marrow oe- dema predicts erosive progression. Ann Rheum Dis 2008;
67:794-800.
15. Nieuwenhuis WP, van Steenbergen HW, Stomp W, Stijnen T, Huizinga TW, Bloem JL, et al. The course of bone marrow edema in early undifferentiated arthritis and rheu- matoid arthritis: a longitudinal magnetic resonance imag- ing study at bone level. Arthritis Rheumatol 2016;68:
1080-8.
16. Døhn UM, Ejbjerg BJ, Hasselquist M, Narvestad E, Møller J, Thomsen HS, et al. Detection of bone erosions in rheu- matoid arthritis wrist joints with magnetic resonance imaging, computed tomography and radiography. Arthritis Res Ther 2008;10:R25.
17. Døhn UM, Ejbjerg BJ, Court-Payen M, Hasselquist M, Narvestad E, Szkudlarek M, et al. Are bone erosions de-
tected by magnetic resonance imaging and ultrasonography true erosions? A comparison with computed tomography in rheumatoid arthritis metacarpophalangeal joints. Arthritis Res Ther 2006;8:R110.
18. Døhn UM, Ejbjerg B, Boonen A, Hetland ML, Hansen MS, Knudsen LS, et al. No overall progression and occasional repair of erosions despite persistent inflammation in adali- mumab-treated rheumatoid arthritis patients: results from a longitudinal comparative MRI, ultrasonography, CT and radiography study. Ann Rheum Dis 2011;70:
252-8.
19. Oldendorf W. Advantages and disadvantages of MRI. In:
Oldendorf W, Oldendorf W Jr, eds. Basics of magnetic res- onance imaging. Boston, Springer, 1988.
20. Kim HY, Kim JA, Lee SK, Hong CS, Suh JS. The utility of wrist magnetic resonance imaging in rheumatoid arthritis for disease activity measurement. J Korean Rheum Assoc 1995;2:9-18.
21. Ostendorf B, Scherer A, Mödder U, Schneider M. Diagnostic value of magnetic resonance imaging of the forefeet in ear- ly rheumatoid arthritis when findings on imaging of the metacarpophalangeal joints of the hands remain normal.
Arthritis Rheum 2004;50:2094-102.
22. McQueen FM, Gao A, Ostergaard M, King A, Shalley G, Robinson E, et al. High-grade MRI bone oedema is com- mon within the surgical field in rheumatoid arthritis pa- tients undergoing joint replacement and is associated with osteitis in subchondral bone. Ann Rheum Dis 2007;66:
1581-7.
23. Tamai M, Kawakami A, Uetani M, Takao S, Arima K, Iwamoto N, et al. A prediction rule for disease outcome in patients with undifferentiated arthritis using magnetic resonance imaging of the wrists and finger joints and sero- logic autoantibodies. Arthritis Rheum 2009;61:772-8.
24. Duer-Jensen A, Hørslev-Petersen K, Hetland ML, Bak L, Ejbjerg BJ, Hansen MS, et al. Bone edema on magnetic res- onance imaging is an independent predictor of rheumatoid arthritis development in patients with early undiffer- entiated arthritis. Arthritis Rheum 2011;63:2192-202.
25. Nieuwenhuis WP, van Steenbergen HW, Mangnus L, Newsum EC, Bloem JL, Huizinga TWJ, et al. Evaluation of the diagnostic accuracy of hand and foot MRI for early Rheumatoid Arthritis. Rheumatology (Oxford) 2017;56:
1367-77.
26. Colebatch AN, Edwards CJ, Østergaard M, van der Heijde D, Balint PV, D'Agostino MA, et al. EULAR recom- mendations for the use of imaging of the joints in the clin- ical management of rheumatoid arthritis. Ann Rheum Dis 2013;72:804-14.
27. Ostergaard M, Stoltenberg M, Løvgreen-Nielsen P, Volck B, Jensen CH, Lorenzen I. Magnetic resonance imag- ing-determined synovial membrane and joint effusion vol- umes in rheumatoid arthritis and osteoarthritis: compar- ison with the macroscopic and microscopic appearance of the synovium. Arthritis Rheum 1997;40:1856-67.
28. Humby F, Mahto A, Ahmed M, Barr A, Kelly S, Buch M, et al. The relationship between synovial pathobiology and magnetic resonance imaging abnormalities in rheumatoid arthritis: a systematic review. J Rheumatol 2017;44:1311-24.
29. Baker JF, Conaghan PG, Emery P, Baker DG, Ostergaard M. Relationship of patient-reported outcomes with MRI
measures in rheumatoid arthritis. Ann Rheum Dis 2017;
76:486-90.
30. Haavardsholm EA, Østergaard M, Hammer HB, Bøyesen P, Boonen A, van der Heijde D, et al. Monitoring anti- TNFalpha treatment in rheumatoid arthritis: responsive- ness of magnetic resonance imaging and ultrasonography of the dominant wrist joint compared with conventional measures of disease activity and structural damage. Ann Rheum Dis 2009;68:1572-9.
31. Peterfy C, Emery P, Tak PP, Østergaard M, DiCarlo J, Otsa K, et al. MRI assessment of suppression of structural dam- age in patients with rheumatoid arthritis receiving ritux- imab: results from the randomised, placebo-controlled, double-blind RA-SCORE study. Ann Rheum Dis 2016;
75:170-7.
32. Peterfy C, Strand V, Tian L, Østergaard M, Lu Y, DiCarlo J, et al. Short-term changes on MRI predict long-term changes on radiography in rheumatoid arthritis: an analysis by an OMERACT Task Force of pooled data from four rando- mised controlled trials. Ann Rheum Dis 2017;76:992-7.
33. Østergaard M, Emery P, Conaghan PG, Fleischmann R, Hsia EC, Xu W, et al. Significant improvement in synovi- tis, osteitis, and bone erosion following golimumab and methotrexate combination therapy as compared with me- thotrexate alone: a magnetic resonance imaging study of 318 methotrexate-naive rheumatoid arthritis patients.
Arthritis Rheum 2011;63:3712-22.
34. Perry D, Stewart N, Benton N, Robinson E, Yeoman S, Crabbe J, et al. Detection of erosions in the rheumatoid hand; a comparative study of multidetector computerized tomography versus magnetic resonance scanning. J Rheumatol 2005;32:256-67.
35. McQueen F, Lassere M, Edmonds J, Conaghan P, Peterfy C, Bird P, et al. OMERACT rheumatoid arthritis magnetic resonance imaging studies. Summary of OMERACT 6 MR imaging module. J Rheumatol 2003;30:1387-92.
36. Glinatsi D, Lillegraven S, Haavardsholm EA, Eshed I, Conaghan PG, Peterfy C, et al. Validation of the OMERACT magnetic resonance imaging joint space narrowing score for the wrist in a multireader longitudinal trial. J Rheumatol 2015;42:2480-5.
37. Ostergaard M, Bøyesen P, Eshed I, Gandjbakhch F, Lillegraven S, Bird P, et al. Development and preliminary validation of a magnetic resonance imaging joint space narrowing score for use in rheumatoid arthritis: potential adjunct to the OMERACT RA MRI scoring system. J Rheumatol 2011;38:2045-50.
38. Haavardsholm EA, Ostergaard M, Ejbjerg BJ, Kvan NP, Uhlig TA, Lilleås FG, et al. Reliability and sensitivity to change of the OMERACT rheumatoid arthritis magnetic resonance imaging score in a multireader, longitudinal setting. Arthritis Rheum 2005;52:3860-7.
39. Axelsen MB, Eshed I, Hørslev-Petersen K, Stengaard-Pedersen K, Hetland ML, Møller J, et al.; OPERA study group. A treat-to-target strategy with methotrexate and intra-artic- ular triamcinolone with or without adalimumab effectively reduces MRI synovitis, osteitis and tenosynovitis and halts structural damage progression in early rheumatoid arthri- tis: results from the OPERA randomised controlled trial.
Ann Rheum Dis 2015;74:867-75.
40. Conaghan PG, Durez P, Alten RE, Burmester GR, Tak PP,
Klareskog L, et al. Impact of intravenous abatacept on syn- ovitis, osteitis and structural damage in patients with rheumatoid arthritis and an inadequate response to me- thotrexate: the ASSET randomised controlled trial. Ann Rheum Dis 2013;72:1287-94.
41. Baker JF, Ostergaard M, Emery P, Hsia EC, Lu J, Baker DG, et al. Early MRI measures independently predict 1-year and 2-year radiographic progression in rheumatoid arthri- tis: secondary analysis from a large clinical trial. Ann Rheum Dis 2014;73:1968-74.
42. Bøyesen P, Haavardsholm EA, Ostergaard M, van der Heijde D, Sesseng S, Kvien TK. MRI in early rheumatoid arthritis: synovitis and bone marrow oedema are in- dependent predictors of subsequent radiographic progression.
Ann Rheum Dis 2011;70:428-33.
43. Hetland ML, Østergaard M, Stengaard-Pedersen K, Junker P, Ejbjerg B, Jacobsen S, et al.; The CIMESTRA Study Group. Anti-cyclic citrullinated peptide antibodies, 28- joint Disease Activity Score, and magnetic resonance imaging bone oedema at baseline predict 11 years' func- tional and radiographic outcome in early rheumatoid arthritis. Scand J Rheumatol 2019;48:1-8.
44. Brown AK, Conaghan PG, Karim Z, Quinn MA, Ikeda K, Peterfy CG, et al. An explanation for the apparent dis- sociation between clinical remission and continued struc- tural deterioration in rheumatoid arthritis. Arthritis Rheum 2008;58:2958-67.
45. Gandjbakhch F, Conaghan PG, Ejbjerg B, Haavardsholm EA, Foltz V, Brown AK, et al. Synovitis and osteitis are very frequent in rheumatoid arthritis clinical remission: results from an MRI study of 294 patients in clinical remission or low disease activity state. J Rheumatol 2011;38:2039-44.
46. Rudwaleit M, van der Heijde D, Landewé R, Listing J, Akkoc N, Brandt J, et al. The development of Assessment of Spondyloarthritis International Society classification criteria for axial spondyloarthritis (part II): validation and final selection. Ann Rheum Dis 2009;68:777-83.
47. Lee S. MRI features of axial spondyloarthritis and differ- ential diagnosis: focusing on the spine and sacroiliac joint.
J Rheum Dis 2014;21:110-21.
48. Arnbak B, Grethe Jurik A, Hørslev-Petersen K, Hendricks O, Hermansen LT, Loft AG, et al. Associations between spondyloarthritis features and magnetic resonance imag- ing findings: a cross-sectional analysis of 1,020 patients with persistent low back pain. Arthritis Rheumatol 2016;
68:892-900.
49. de Winter J, de Hooge M, van de Sande M, de Jong H, van Hoeven L, de Koning A, et al. Magnetic resonance imaging of the sacroiliac joints indicating sacroiliitis according to the Assessment of SpondyloArthritis International Society definition in healthy individuals, runners, and women with postpartum back pain. Arthritis Rheumatol 2018;70:
1042-8.
50. Varkas G, de Hooge M, Renson T, De Mits S, Carron P, Jacques P, et al. Effect of mechanical stress on magnetic resonance imaging of the sacroiliac joints: assessment of military recruits by magnetic resonance imaging study.
Rheumatology (Oxford) 2018;57:508-13.
51. Weber U, Jurik AG, Zejden A, Larsen E, Jørgensen SH, Rufibach K, et al. Frequency and anatomic distribution of magnetic resonance imaging features in the sacroiliac
joints of young athletes: exploring “background noise” to- ward a data-driven definition of sacroiliitis in early spondyloarthritis. Arthritis Rheumatol 2018;70:736-45.
52. Baraliakos X, Richter A, Feldmann D, Ott A, Buelow R, Schmidt CO, et al. Frequency of MRI changes suggestive of axial spondyloarthritis in the axial skeleton in a large pop- ulation-based cohort of individuals aged <45 years. Ann Rheum Dis 2020;79:186-92.
53. Diekhoff T, Hermann KG, Greese J, Schwenke C, Poddubnyy D, Hamm B, et al. Comparison of MRI with ra- diography for detecting structural lesions of the sacroiliac joint using CT as standard of reference: results from the SIMACT study. Ann Rheum Dis 2017;76:1502-8.
54. Bakker PA, van den Berg R, Hooge M, van Lunteren M, Ez-Zaitouni Z, Fagerli KM, et al. Impact of replacing radio- graphic sacroiliitis by magnetic resonance imaging struc- tural lesions on the classification of patients with axial spondyloarthritis. Rheumatology (Oxford) 2018;57:1186-93.
55. Maksymowych WP, Wichuk S, Chiowchanwisawakit P, Lambert RG, Pedersen SJ. Fat metaplasia and backfill are key intermediaries in the development of sacroiliac joint ankylosis in patients with ankylosing spondylitis. Arthritis Rheumatol 2014;66:2958-67.
56. Song IH, Hermann KG, Haibel H, Althoff CE, Poddubnyy D, Listing J, et al. Relationship between active inflammatory lesions in the spine and sacroiliac joints and new develop- ment of chronic lesions on whole-body MRI in early axial spondyloarthritis: results of the ESTHER trial at week 48.
Ann Rheum Dis 2011;70:1257-63.
57. Ziegeler K, Eshkal H, Schorr C, Sieper J, Diekhoff T, Makowski MR, et al. Age- and sex-dependent frequency of fat metaplasia and other structural changes of the sacroil- iac joints in patients without axial spondyloarthritis: a ret- rospective, cross-sectional MRI study. J Rheumatol 2018;
45:915-21.
58. de Hooge M, van den Berg R, Navarro-Compán V, Reijnierse M, van Gaalen F, Fagerli K, et al. Patients with chronic back pain of short duration from the SPACE cohort: which MRI structural lesions in the sacroiliac joints and inflammatory and structural lesions in the spine are most specific for ax- ial spondyloarthritis? Ann Rheum Dis 2016;75:1308-14.
59. Lambert RG, Salonen D, Rahman P, Inman RD, Wong RL, Einstein SG, et al. Adalimumab significantly reduces both spinal and sacroiliac joint inflammation in patients with ankylosing spondylitis: a multicenter, randomized, dou- ble-blind, placebo-controlled study. Arthritis Rheum 2007;56:4005-14.
60. Sieper J, van der Heijde D, Dougados M, Mease PJ, Maksymowych WP, Brown MA, et al. Efficacy and safety of adalimumab in patients with non-radiographic axial spon- dyloarthritis: results of a randomised placebo-controlled trial (ABILITY-1). Ann Rheum Dis 2013;72:815-22.
61. van der Heijde D, Sieper J, Maksymowych WP, Lambert RG, Chen S, Hojnik M, et al. Clinical and MRI remission in patients with nonradiographic axial spondyloarthritis who received long-term open-label adalimumab treatment:
3-year results of the ABILITY-1 trial. Arthritis Res Ther 2018;20:61.
62. Pedersen SJ, Poddubnyy D, Sørensen IJ, Loft AG, Hindrup JS, Thamsborg G, et al. Course of magnetic resonance imaging-detected inflammation and structural lesions in
the sacroiliac joints of patients in the randomized, dou- ble-blind, placebo-controlled danish multicenter study of adalimumab in spondyloarthritis, as assessed by the Berlin and Spondyloarthritis Research Consortium of Canada methods. Arthritis Rheumatol 2016;68:418-29.
63. Braun J, Baraliakos X, Hermann KG, Landewé R, Machado PM, Maksymowych WP, et al. Effect of certolizumab pegol over 96 weeks of treatment on inflammation of the spine and sacroiliac joints, as measured by MRI, and the associa- tion between clinical and MRI outcomes in patients with axial spondyloarthritis. RMD Open 2017;3:e000430.
64. Baraliakos X, Borah B, Braun J, Baeten D, Laurent D, Sieper J, et al. Long-term effects of secukinumab on MRI findings in relation to clinical efficacy in subjects with active anky- losing spondylitis: an observational study. Ann Rheum Dis 2016;75:408-12.
65. Maksymowych WP, Wichuk S, Dougados M, Jones HE, Pedersen R, Szumski A, et al. Modification of structural le- sions on MRI of the sacroiliac joints by etanercept in the EMBARK trial: a 12-week randomised placebo-controlled trial in patients with non-radiographic axial spondy- loarthritis. Ann Rheum Dis 2018;77:78-84.
66. Pipitone N. Value of MRI in diagnostics and evaluation of myositis. Curr Opin Rheumatol 2016;28:625-30.
67. Lampa J, Nennesmo I, Einarsdottir H, Lundberg I. MRI guided muscle biopsy confirmed polymyositis diagnosis in a patient with interstitial lung disease. Ann Rheum Dis 2001;60:423-6.
68. Tomasová Studynková J, Charvát F, Jarosová K, Vencovsky J. The role of MRI in the assessment of polymyositis and dermatomyositis. Rheumatology (Oxford) 2007;46:1174-9.
69. Theodorou DJ, Theodorou SJ, Kakitsubata Y. Skeletal muscle disease: patterns of MRI appearances. Br J Radiol 2012;85:e1298-308.
70. Kubínová K, Mann H, Vencovský J. MRI scoring methods used in evaluation of muscle involvement in patients with idiopathic inflammatory myopathies. Curr Opin Rheumatol 2017;29:623-31.
71. Pipitone N, Notarnicola A, Levrini G, Spaggiari L, Scardapane A, Iannone F, et al. Do dermatomyositis and polymyositis affect similar thigh muscles? A comparative MRI-based study. Clin Exp Rheumatol 2016;34:1098-100.
72. Barsotti S, Zampa V, Talarico R, Minichilli F, Ortori S, Iacopetti V, et al. Thigh magnetic resonance imaging for the evaluation of disease activity in patients with idio- pathic inflammatory myopathies followed in a single center. Muscle Nerve 2016;54:666-72.
73. Andersson H, Kirkhus E, Garen T, Walle-Hansen R, Merckoll E, Molberg Ø. Comparative analyses of muscle MRI and muscular function in anti-synthetase syndrome patients and matched controls: a cross-sectional study.
Arthritis Res Ther 2017;19:17.
74. Yao L, Yip AL, Shrader JA, Mesdaghinia S, Volochayev R, Jansen AV, et al. Magnetic resonance measurement of muscle T2, fat-corrected T2 and fat fraction in the assess- ment of idiopathic inflammatory myopathies. Rheumatology (Oxford) 2016;55:441-9.
75. Elessawy SS, Abd El-Ghaffar Borg M, Abd El-Salam Mohamed M, Elhawary GE, Abd El-Salam EM. The role of MRI in the evaluation of muscle diseases. Egypt J Radiol Nucl Med 2013;44:607-15.
76. Dion E, Cherin P, Payan C, Fournet JC, Papo T, Maisonobe T, et al. Magnetic resonance imaging criteria for dis- tinguishing between inclusion body myositis and poly- myositis. J Rheumatol 2002;29:1897-906.
77. Malattia C, Damasio MB, Madeo A, Pistorio A, Providenti A, Pederzoli S, et al. Whole-body MRI in the assessment of disease activity in juvenile dermatomyositis. Ann Rheum Dis 2014;73:1083-90.
78. Yoshida K, Kurosaka D, Joh K, Matsushima S, Takahashi E, Hirai K, et al. Fasciitis as a common lesion of dermato- myositis, demonstrated early after disease onset by en bloc biopsy combined with magnetic resonance imaging.
Arthritis Rheum 2010;62:3751-9.
79. Pinal-Fernandez I, Casal-Dominguez M, Carrino JA, Lahouti AH, Basharat P, Albayda J, et al. Thigh muscle MRI in immune-mediated necrotising myopathy: extensive oe- dema, early muscle damage and role of anti-SRP autoanti- bodies as a marker of severity. Ann Rheum Dis 2017;
76:681-7.
80. Cantwell C, Ryan M, O'Connell M, Cunningham P, Brennan D, Costigan D, et al. A comparison of inflammatory myo- pathies at whole-body turbo STIR MRI. Clin Radiol 2005;60:261-7.
81. Choe YH, Kim DK, Koh EM, Do YS, Lee WR. Takayasu ar- teritis: diagnosis with MR imaging and MR angiography in acute and chronic active stages. J Magn Reson Imaging 1999;10:751-7.
82. Dejaco C, Ramiro S, Duftner C, Besson FL, Bley TA, Blockmans D, et al. EULAR recommendations for the use of imaging in large vessel vasculitis in clinical practice.
Ann Rheum Dis 2018;77:636-43.
83. Yamada I, Nakagawa T, Himeno Y, Kobayashi Y, Numano F, Shibuya H. Takayasu arteritis: diagnosis with breath- hold contrast-enhanced three-dimensional MR angiography.
J Magn Reson Imaging 2000;11:481-7.
84. Barra L, Kanji T, Malette J, Pagnoux C; CanVasc. Imaging modalities for the diagnosis and disease activity assess- ment of Takayasu's arteritis: a systematic review and meta- analysis. Autoimmun Rev 2018;17:175-87.
85. Tso E, Flamm SD, White RD, Schvartzman PR, Mascha E, Hoffman GS. Takayasu arteritis: utility and limitations of magnetic resonance imaging in diagnosis and treatment.
Arthritis Rheum 2002;46:1634-42.
86. Bley TA, Wieben O, Uhl M, Thiel J, Schmidt D, Langer M.
High-resolution MRI in giant cell arteritis: imaging of the wall of the superficial temporal artery. AJR Am J Roentgenol 2005;184:283-7.
87. Bley TA, Uhl M, Carew J, Markl M, Schmidt D, Peter HH, et al. Diagnostic value of high-resolution MR imaging in giant cell arteritis. AJNR Am J Neuroradiol 2007;28:
1722-7.
88. Buttgereit F, Dejaco C, Matteson EL, Dasgupta B.
Polymyalgia rheumatica and giant cell arteritis: a system- atic review. JAMA 2016;315:2442-58.
89. Khan A, Dasgupta B. Imaging in giant cell arteritis. Curr Rheumatol Rep 2015;17:52.
90. ACR–ASNR–SPR Practice parameter for the performance and interpretation of magnetic resonance imaging (MRI) of the brain. American Society Neuroradiology, 2019 [cited 2020 May 1]. Available from: https://www.acr.
org/-/media/ACR/Files/Practice-Parameters/MR-Brain.
pdf.
91. Radue EW, Weigel M, Wiest R, Urbach H. Introduction to magnetic resonance imaging for neurologists. Continuum (Minneap Minn) 2016;22:1379-98.
92. Sarbu N, Alobeidi F, Toledano P, Espinosa G, Giles I, Rahman A, et al. Brain abnormalities in newly diagnosed neuropsychiatric lupus: systematic MRI approach and cor- relation with clinical and laboratory data in a large multi- center cohort. Autoimmun Rev 2015;14:153-9.
93. Kozora E, West SG, Kotzin BL, Julian L, Porter S, Bigler E.
Magnetic resonance imaging abnormalities and cognitive deficits in systemic lupus erythematosus patients without overt central nervous system disease. Arthritis Rheum 1998;41:41-7.
94. Salvarani C, Brown RD Jr, Calamia KT, Christianson TJ, Weigand SD, Miller DV, et al. Primary central nervous sys- tem vasculitis: analysis of 101 patients. Ann Neurol 2007;62:442-51.
95. Molloy ES, Singhal AB, Calabrese LH. Tumour-like mass lesion: an under-recognised presentation of primary angii- tis of the central nervous system. Ann Rheum Dis 2008;
67:1732-5.
96. Kucharczyk J, Mintorovitch J, Asgari HS, Moseley M.
Diffusion/perfusion MR imaging of acute cerebral ischemia.
Magn Reson Med 1991;19:311-5.
97. Bailey DL, Townsend DW, Valk PE, Maisey MN. Positron emission tomography: basic sciences. Secaucus, NJ, Springer-Verlag, 2005.
98. Martínez MJ, Ziegler SI, Beyer T. PET and PET/CT: basic principles and instrumentation. In: Dresel S, ed. PET in oncology. Berlin, Heidelberg, Springer, 2008.
99. Fletcher JW, Djulbegovic B, Soares HP, Siegel BA, Lowe VJ, Lyman GH, et al. Recommendations on the use of
18F-FDG PET in oncology. J Nucl Med 2008;49:480-508.
100. Kubota R, Yamada S, Kubota K, Ishiwata K, Tamahashi N, Ido T. Intratumoral distribution of fluorine-18-fluor- odeoxyglucose in vivo: high accumulation in macrophages and granulation tissues studied by microautoradiography.
J Nucl Med 1992;33:1972-80.
101. Keidar Z, Haim N, Guralnik L, Wollner M, Bar-Shalom R, Ben-Nun A, et al. PET/CT using 18F-FDG in suspected lung cancer recurrence: diagnostic value and impact on pa- tient management. J Nucl Med 2004;45:1640-6.
102. Zhuang H, Codreanu I. Growing applications of FDG PET-CT imaging in non-oncologic conditions. J Biomed Res 2015;29:189-202.
103. Lensen KD, Comans EF, Voskuyl AE, van der Laken CJ, Brouwer E, Zwijnenburg AT, et al. Large-vessel vasculitis:
interobserver agreement and diagnostic accuracy of
18F-FDG-PET/CT. Biomed Res Int 2015;2015:914692.
104. Soussan M, Nicolas P, Schramm C, Katsahian S, Pop G, Fain O, et al. Management of large-vessel vasculitis with FDG-PET: a systematic literature review and meta-analysis.
Medicine (Baltimore) 2015;94:e622.
105. Bucerius J, Hyafil F, Verberne HJ, Slart RH, Lindner O, Sciagra R, et al. Position paper of the Cardiovascular Committee of the European Association of Nuclear Medicine (EANM) on PET imaging of atherosclerosis. Eur J Nucl Med Mol Imaging 2016;43:780-92.
106. Moosig F, Czech N, Mehl C, Henze E, Zeuner RA, Kneba M, et al. Correlation between 18-fluorodeoxyglucose accu-
mulation in large vessels and serological markers of in- flammation in polymyalgia rheumatica: a quantitative PET study. Ann Rheum Dis 2004;63:870-3.
107. Hautzel H, Sander O, Heinzel A, Schneider M, Müller HW.
Assessment of large-vessel involvement in giant cell arter- itis with 18F-FDG PET: introducing an ROC-analy- sis-based cutoff ratio. J Nucl Med 2008;49:1107-13.
108. Tezuka D, Haraguchi G, Ishihara T, Ohigashi H, Inagaki H, Suzuki J, et al. Role of FDG PET-CT in Takayasu arteritis:
sensitive detection of recurrences. JACC Cardiovasc Imaging 2012;5:422-9.
109. Besson FL, de Boysson H, Parienti JJ, Bouvard G, Bienvenu B, Agostini D. Towards an optimal semiquantitative ap- proach in giant cell arteritis: an 18F-FDG PET/CT case- control study. Eur J Nucl Med Mol Imaging 2014;41:
155-66.
110. Stellingwerff MD, Brouwer E, Lensen KJ, Rutgers A, Arends S, van der Geest KS, et al. Different scoring meth- ods of FDG PET/CT in giant cell arteritis: need for standardization. Medicine (Baltimore) 2015;94:e1542.
111. Lee YH, Choi SJ, Ji JD, Song GG. Diagnostic accuracy of 18F-FDG PET or PET/CT for large vessel vasculitis: a meta-analysis. Z Rheumatol 2016;75:924-31.
112. Grayson PC, Alehashemi S, Bagheri AA, Civelek AC, Cupps TR, Kaplan MJ, et al. 18F-fluorodeoxyglucose-posi- tron emission tomography as an imaging biomarker in a prospective, longitudinal cohort of patients with large ves- sel vasculitis. Arthritis Rheumatol 2018;70:439-49.
113. Kim J, Oh MD. FDG PET-CT in the diagnosis of Takayasu arteritis presenting as fever of unknown origin: a case report. Infect Chemother 2015;47:190-3.
114. Yoo SJ, Lee JC, Kim Y, Yoo IS, Shim SC, Kim KH, et al.
Clinical Implication of 18F-FDG-PET in diagnosing and monitoring disease activity in a case of subclinical stage of giant cell arteritis. J Rheum Dis 2015;22:382-6.
115. de Boysson H, Dumont A, Liozon E, Lambert M, Boutemy J, Maigné G, et al. Giant-cell arteritis: concordance study between aortic CT angiography and FDG-PET/CT in de- tection of large-vessel involvement. Eur J Nucl Med Mol Imaging 2017;44:2274-9.
116. Incerti E, Tombetti E, Fallanca F, Baldissera EM, Alongi P, Tombolini E, et al. 18F-FDG PET reveals unique features of large vessel inflammation in patients with Takayasu's arteritis. Eur J Nucl Med Mol Imaging 2017;44:1109-18.
117. Dellavedova L, Carletto M, Faggioli P, Sciascera A, Del Sole A, Mazzone A, et al. The prognostic value of baseline
18F-FDG PET/CT in steroid-naïve large-vessel vasculitis:
introduction of volume-based parameters. Eur J Nucl Med Mol Imaging 2016;43:340-8.
118. de Leeuw K, Bijl M, Jager PL. Additional value of positron emission tomography in diagnosis and follow-up of pa- tients with large vessel vasculitides. Clin Exp Rheumatol 2004;22(6 Suppl 36):S21-6.
119. Stenová E, Mistec S, Povinec P. FDG-PET/CT in large-ves- sel vasculitis: its diagnostic and follow-up role. Rheumatol Int 2010;30:1111-4.
120. Blockmans D, de Ceuninck L, Vanderschueren S, Knockaert D, Mortelmans L, Bobbaers H. Repetitive 18F-fluorodeox- yglucose positron emission tomography in giant cell arter- itis: a prospective study of 35 patients. Arthritis Rheum 2006;55:131-7.