ABSTRACT
Objective: Few data exist regarding adjuvant hysterectomy (AH) in locally advanced cervical cancer (LACC) patients treated with chemoradiotherapy. We investigated the effect of AH on prognosis in LACC patients, through meta-analysis.
Methods: EMBASE and MEDLINE databases and the Cochrane Library were searched for published studies comparing LACC patients who received AH after chemoradiotherapy with those who did not, through April 2016. Endpoints were mortality and recurrence rates. For pooled estimates of the effect of AH on mortality/recurrence, random- or fixed-effects meta- analytical models were used.
Results: Two randomized trials and six observational studies (AH following
chemoradiotherapy, 630 patients; chemoradiotherapy, 585 patients) met our search criteria.
Fixed-effects model-based meta-analysis indicated no significant difference in mortality between the groups (odds ratio [OR]=1.01; 95% confidence interval [CI]=0.58–1.78; p=0.968) with low cross-study heterogeneity (p=0.73 and I2=0.0). This pattern was observed in subgroup analysis for study design, radiation type, response after chemoradiotherapy, and hysterectomy type. The pooled OR for AH and recurrence was 0.59 (95% CI=0.44–0.79;
p<0.05) with low cross-study heterogeneity (p=0.29 and I2=17.8), favoring the AH group.
However, this pattern was not observed in the subgroup analysis for the randomized trials.
There was no evidence of publication bias.
Conclusion: In this meta-analysis, AH following chemoradiotherapy did not improve survival in patients with LACC, although it seemed to reduce the risk of recurrence. Concerning the significant morbidity of AH after chemoradiotherapy, routine use of AH should be avoided.
Keywords: Cervical Neoplasms; Hysterectomy; Chemoradiotherapy; Prognosis; Meta-Analysis
INTRODUCTION
Since cytological screening was introduced, the incidence of cervical cancer has decreased remarkably. However, in 2012, there were approximately 528,000 new cases and 266,000 cervical cancer-associated deaths worldwide [1]. In Korea, it is the most common female
Original Article
Received: Jul 7, 2017 Revised: Nov 27, 2017 Accepted: Dec 26, 2017 Correspondence to Soo-Nyung Kim
Department of Obstetrics and Gynecology, Konkuk University School of Medicine, 120 Neungdong-ro, Gwangjin-gu, Seoul 05029, Korea.
E-mail: [email protected] Copyright © 2018. Asian Society of Gynecologic Oncology, Korean Society of Gynecologic Oncology
This is an Open Access article distributed under the terms of the Creative Commons Attribution Non-Commercial License (https://
creativecommons.org/licenses/by-nc/4.0/) which permits unrestricted non-commercial use, distribution, and reproduction in any medium, provided the original work is properly cited.
ORCID iDs Seung-Hyuk Shim
https://orcid.org/0000-0001-8043-2257 Soo-Nyung Kim
https://orcid.org/0000-0003-4319-336X Su Hyun Chae
https://orcid.org/0000-0002-9258-8109 Jung Eun Kim
https://orcid.org/0000-0003-4769-9093 Funding
This paper was supported by Konkuk University.
Seung-Hyuk Shim , Soo-Nyung Kim , Su Hyun Chae , Jung Eun Kim , Sun Joo Lee
Department of Obstetrics and Gynecology, Konkuk University School of Medicine, Seoul, Korea
Impact of adjuvant hysterectomy on prognosis in patients with locally
advanced cervical cancer treated with concurrent chemoradiotherapy:
a meta-analysis
Conflict of Interest
No potential conflict of interest relevant to this article was reported.
Author Contributions
Conceptualization: S.S.H.; Data curation:
S.S.H., K.S.N., C.S.H., K.J.E., L.S.J.; Formal analysis: S.S.H., K.S.N.; Funding acquisition:
S.S.H., K.S.N.; Investigation: S.S.H., K.S.N., C.S.H., K.J.E., L.S.J.; Methodology: S.S.H., K.S.N., L.S.J.; Resources: S.S.H., K.S.N.,C.S.H., K.J.E., L.S.J.; Software: S.S.H., K.S.N., C.S.H., K.J.E., L.S.J.; Supervision: S.S.H., K.S.N.;
Validation: S.S.H., K.S.N.; Visualization: S.S.H.;
Writing - original draft: S.S.H., K.S.N., C.S.H., K.J.E., L.S.J.; Writing - review & editing: S.S.H., K.S.N., C.S.H., K.J.E., L.S.J.
genital malignancy, and in 2013, the age-standardized incidence rate was 9.5 cases per 100,000 women [2,3].
Based on five phase III randomized control trials demonstrating that concurrent chemoradiotherapy (CCRT) improves survival outcome in patients with locally advanced cervical cancer (LACC) [4], CCRT is accepted as the standard treatment for these patients [5,6]; however, the 5-year overall survival remains approximately 70%. Investigators have evaluated whether adjuvant hysterectomy (AH) after CCRT contributes to any survival benefit. One randomized controlled trial (RCT) by the Gynecologic Oncology Group (GOG) investigated the role of AH after radiotherapy (without concomitant chemotherapy) in this patient population [7]. Nonetheless, in the era of CCRT, there is still conflicting evidence regarding the therapeutic role of AH in LACC.
The current meta-analysis quantified the effects of AH on survival outcome in LACC patients treated with CCRT. This will help both physicians and LACC patients to balance the risks and benefits of AH after CCRT.
MATERIALS AND METHODS
1. Literature search
A systematic review and meta-analysis were performed using previously described reporting guidelines [8-10]. The EMBASE and MEDLINE databases, and Cochrane Central Register for Controlled Trials database were searched up to April 2016, irrespective of language. Pre- publication papers were also included. The search strategy is described in the Supplementary Data 1. Titles and abstracts were checked to identify potentially eligible studies. The full texts were then reviewed in detail. References were manually screened to find additional studies.
Two authors (S.S.H. and L.S.J.) independently carried out all searches.
2. Eligibility criteria
Inclusion criteria for this meta-analysis were as follows: 1) RCT or prospective/retrospective cohort or case-control study; 2) participants receiving primary CCRT for LACC (stage IB2 to IVA); 3) AH following CCRT (CCRT+AH), as intervention; 4) CCRT without AH (CCRT), as comparison; and 5) outcomes of mortality or recurrence rates measured via relative risks (RRs), odds ratios (ORs), or hazard ratios (HRs) with 95% confidence intervals (CIs) (or sufficient data for calculation). For studies with duplicated data, the most recent or instructive study was selected. Single-arm cohort studies or case reports were excluded.
3. Data extraction
The following data were extracted from each study: first author; publication year; study design, location, and period; age; sample size; tumor stage; histology; radiotherapy details (dose, duration, external beam radiotherapy [EBRT], intracavitary brachytherapy [ICBT]);
concomitant chemotherapy details (regimen, dose, duration); AH details (simple or radical);
time interval from CCRT completion to AH; disease status after CCRT, follow-up duration;
recurrence; death from disease; adverse events related to treatment; and variables controlled for in the analysis. For response after CCRT, a good response was defined as a decrease in tumor volume ≥50% on magnetic resonance imaging (MRI) on completion of CCRT [11,12].
Each study was systematically reviewed for features that may introduce bias, similarity of risk factors for prognosis, and similarity of follow-up durations, between the CCRT+AH group
and the CCRT group. Three authors (S.S.H., L.S.J., and K.S.N.) independently extracted data;
discrepancies were jointly reviewed until consensus was reached.
4. Quality assessment
For non-randomized studies (NRSs), the quality of each study was evaluated using the nine-star Newcastle-Ottawa scale (NOS) in three categories: selection, comparability, and exposure (case-control studies) or outcomes (cohort studies) [13]. Based on quality assessment standards from previous meta-analyses [14], a study with five or more stars was defined as high quality in the present meta-analysis. To evaluate the study quality for RCTs, the following features were assessed: randomization procedure, estimation of sample size, blinding and allocation concealment, loss to follow-up, dropout and intention-to-treat analysis [15]. Study quality was quantified using the Jadad/Oxford quality scoring system [16]. Three authors (S.S.H., L.S.J., and K.S.N.) independently evaluated study quality;
discrepancies were jointly reviewed until consensus was reached.
5. Data generation and analysis
The primary endpoint was the mortality rate. The secondary endpoints were the total, local, and distant recurrence rates. The OR and 95% CI for the mortality or recurrence rates for the CCRT+AH and CCRT groups were calculated from the original data of each study. Cross- study heterogeneity was examined using the Cochran Q test and the I2 statistic [17,18]. If either the Q test (p<0.1) [17] or the I2 statistic (>50%) [18] indicated substantial heterogeneity between studies, a random-effects model was used (DerSimonian-Laird method) to estimate the combined OR; [19] otherwise, a fixed-effects model (Mantel-Haenszel method) was used. Subgroup analyses according to study design (RCT or NRS), type of radiation (ICBT following EBRT or EBRT only), residual tumor after CCRT (residual or no residual), response after CCRT (good response or not), and type of AH (simple hysterectomy [SH] or radical hysterectomy [RH]) were carried out.
Sensitivity analysis was conducted by withdrawing 1 study at a time from the meta-analysis to evaluate its effect on the pooled OR [10]. Publication bias was determined using the fail-safe N test [20] and the Begg-Mazumdar rank correlation test [21,22]. Comprehensive Meta- Analysis version 2.0 (Biostat, Englewood, NJ, USA) was used for all statistical tests. A 2-sided p value <0.05 was considered significant. The statistician (K.S.N.) contributed the present meta-analysis.
RESULTS
1. Literature search
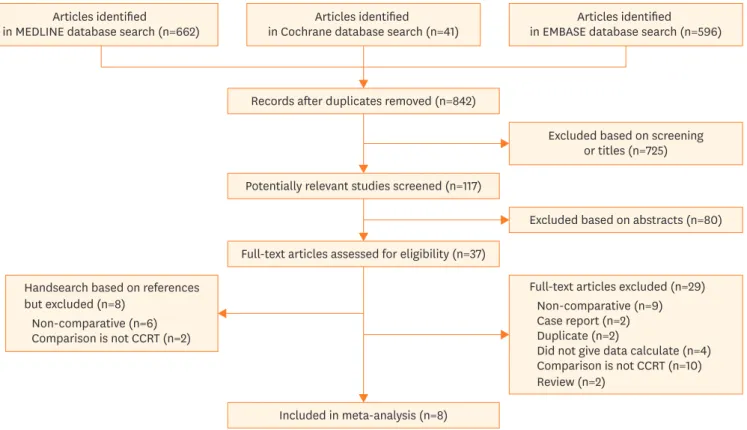
From 842 records, 38 papers were identified for detailed full-texts review. Finally, eight studies were included in the meta-analysis [11,12,23-28]. The literature search process is depicted in Fig. 1. Supplementary Table 1 shows the excluded studies with reasons for exclusion.
2. Study characteristics
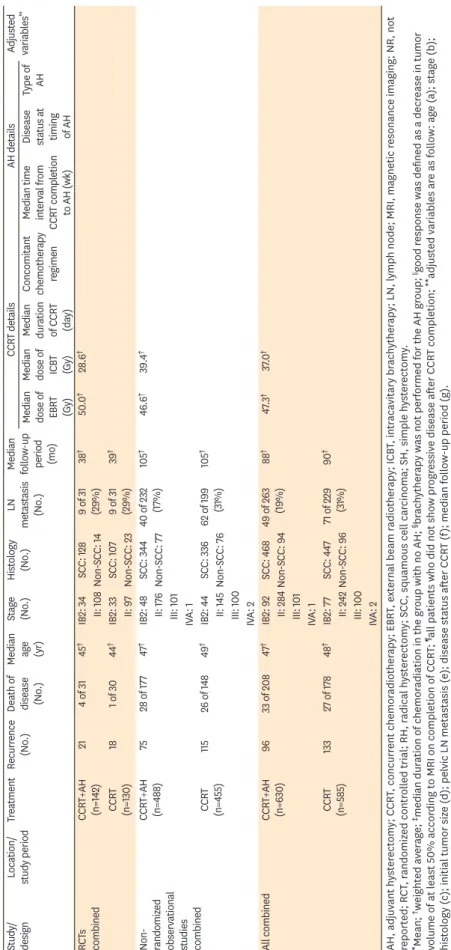
Table 1 lists the study characteristics. Eight papers, published between 2008 and 2014, involved 630 LACC patients who received AH after CCRT and 585 who did not receive AH after CCRT.
Two were RCTs [25,26] and 6 were NRSs [11,12,23,24,27,28]. The studies were conducted in France [12,25,27], Mexico [24,26], China [11,28], and the US [23]. For the RCTs, the quality score was 3 on the Jadad/Oxford quality scoring system (Supplementary Table 2). For the
NRSs, the quality scores were 6 or 7 (Supplementary Table 3). All included NRSs received three stars and 2 stars for selection and exposure, respectively. One study received one star for comparability because of one controlled confounder (e.g., disease status after CCRT); 5 studies received two stars because they satisfied additional comparability criteria.
The median ages in the CCRT+AH group and CCRT group were 47 and 48 years, respectively, with median follow-up periods of 88 and 90 months, respectively. All studies, except 1 [12], reported similar histology distributions (squamous and non-squamous) between CCRT+AH and CCRT groups. All patients received concomitant cisplatin-based chemotherapy. In 5 studies, patients received a concomitant weekly single cisplatin regimen [11,12,23-25], whereas the other studies featured combination cisplatin regimens [26-28]. The median EBRT dose was 48.3 Gy (range, 40–55 Gy). ICBT following EBRT was administered to both groups in all studies, except for 2 in which the CCRT+AH group did not receive ICBT [11,26]. The time interval from CCRT completion to AH ranged from 2 to 12 weeks. One study included only patients that achieved complete response after CCRT [25] and 2 studies included only patients that achieved a good response (decrease in tumor volume ≥50%) after CCRT [11,12]. The other 5 studies included all patients who did not show progressive disease after CCRT completion [23,24,26-28]. The type of AH was SH in 1 study [23], RH in 3 [11,24,26], and a mixture of AH and RH in 4 [12,25,27,28].
3. Meta-analysis of the impact of AH on survival
Five studies compared CCRT+AH with CCRT in terms of survival with a combined total of 60 deaths (33/208 patients with CCRT+AH vs. 27/178 patients with CCRT). No significant Articles identified
in MEDLINE database search (n=662) Articles identified in Cochrane database search (n=41)
Records after duplicates removed (n=842)
Excluded based on screening or titles (n=725)
Excluded based on abstracts (n=80)
Included in meta-analysis (n=8) Potentially relevant studies screened (n=117)
Full-text articles assessed for eligibility (n=37)
Articles identified in EMBASE database search (n=596)
Full-text articles excluded (n=29) Non-comparative (n=9) Case report (n=2) Duplicate (n=2)
Did not give data calculate (n=4) Comparison is not CCRT (n=10) Review (n=2)
Handsearch based on references but excluded (n=8)
Non-comparative (n=6) Comparison is not CCRT (n=2)
Fig. 1. Flow diagram of the literature search process.
CCRT, concurrent chemoradiotherapy.
Table 1. Characteristics of studies included in the meta-analysis Study/ designLocation/ study periodTreatmentRecurrence (No.)Death of disease (No.)
Median age (yr)
Stage (No.)Histology (No.)LN metastasis (No.) Median follow-up period (mo) CCRT detailsAH detailsAdjusted variables**Median dose of EBRT (Gy)
Median dose of ICBT (Gy) Median duration of CCRT (day) Concomitant chemotherapy regimen Median time interval from CCRT completion to AH (wk) Disease status at timing of AH
Type of AH Wang et al. [11] / Retrospective case-control study
China/ 2004–2011CCRT+AH (n=119)11NR45IIB: 119SCC: 112133640–5028–35§60‡Weekly cisplatin (40 mg/m2)
2–3Only good responders∥RH: 119b, c, f, g Non-SCC: 7 CCRT (n=121)21NR52IIB: 121SCC: 1161430 Non-SCC: 5 Sun et al. [28] / Retrospective case-control study
China/ 1992–2012CCRT+AH (n=192)32NR48IIB: 90SCC: 14918190*45–5045–55NRWeekly cisplatin (40 mg/m2) + 5-fluorouracil (500 mg/m2)
10–12All¶SH: 99b, c, g III: 101Non-SCC: 43RH: 72 IVA: 1 CCRT (n=186)59NRIIB: 84SCC: 140NR III: 100Non-SCC: 47 IVA: 2 Chereau et al. [27] / Retrospective case-control study
France/ 2002–2012CCRT+AH (n=46)6649*IB2: 15SCC: 3993140–5520NRTriweekly 5-fluorouracil infusion (750 mg/m2/ day) + cisplatin (20–25 mg/m2/ day) on days 1, 2, 4, and 5.
6All¶SH: 32c, d, g IIA: 4Non-SCC: 7RH: 14 IIB: 27 CCRT (n=34)6551*IB2: 4SCC: 2927 IIA: 5Non-SCC: 5 IIB: 25 Cetina et al. [24] / RCTMexico/ 2004–2009CCRT+AH (n=111)13NR45IB2: 18SCC: 100NR36*50.430–35§47Weekly cisplatin (40 mg/m2) + gemcitabine (125 mg/m2)
4–6All¶RH: 86a, b, c, d, g IIA: 11Non-SCC: 11 IIB: 82 CCRT (n=100)15NR44IB2: 18SCC: 83NR IIA: 12Non-SCC: 17 IIB: 70 Morice et al. [25] / RCTFrance/ 2003–2006CCRT+AH (n=31)8445IB2: 16SCC: 2894645–501551Weekly cisplatin (40 mg/m2) 6–8Only complete responders
SH or RH: 31a, b, c, e, f, gII: 15Non-SCC: 3 CCRT (n=30)3145IB2: 15SCC: 249 II: 15Non-SCC: 6 Lèguevaque et al. [12] / Retrospective case-control study
France/ 1998–2006CCRT+AH (n=67)151151*IB2: 22SCC: 9518NR4535NRWeekly cisplatin (40 mg/m2)
5–7Only good responders∥SH or RH: 67f II: 71Non-SCC: 16 III: 12 CCRT (n=44)169IVA: 321 Cetina et al. [26] / Retrospective matched- control study
Mexico/ 1999–2003CCRT+AH (n=40)8845IB2: 9SCC: 28NR26503540Weekly cisplatin (40 mg/m2)
<7All¶RH: 40a, b, c, d, g IIA: 4Non-SCC: 12 IIB: 27 CCRT (n=40)8845IB2: 9SCC: 2822 IIA: 4Non-SCC: 12 IIB: 27 Darus et al. [23] / Retrospective case-control study
US/ 1994–2004CCRT+AH (n=24)3441*IB2: 24SCC: 16NR474545<56Weekly cisplatin (40 mg/m2) 6All¶SH-24a, b, d, g Non-SCC: 8 CCRT (n=30)5441*IB2: 31SCC: 23NR47 Non-SCC: 7 (continued to the next page)
Study/ designLocation/ study periodTreatmentRecurrence (No.)Death of disease (No.)
Median age (yr)
Stage (No.)Histology (No.)LN metastasis (No.) Median follow-up period (mo) CCRT detailsAH detailsAdjusted variables**Median dose of EBRT (Gy)
Median dose of ICBT (Gy) Median duration of CCRT (day) Concomitant chemotherapy regimen Median time interval from CCRT completion to AH (wk) Disease status at timing of AH
Type of AH RCTs combinedCCRT+AH (n=142)214 of 3145†IB2: 34SCC: 1289 of 31 (29%)38†50.0†28.6† II: 108Non-SCC: 14 CCRT (n=130)181 of 3044†IB2: 33SCC: 1079 of 31 (29%)39† II: 97Non-SCC: 23
Non- randomiz ed observational studies combined
CCRT+AH (n=488)7528 of 17747†IB2: 48SCC: 34440 of 232 (17%)105†46.6†39.4† II: 176Non-SCC: 77 III: 101 IVA: 1 CCRT (n=455)11526 of 14849†IB2: 44SCC: 33662 of 199 (31%)105† II: 145Non-SCC: 76 III: 100 IVA: 2 All combinedCCRT+AH (n=630)9633 of 20847†IB2: 92SCC: 46849 of 263 (19%)88†47.3†37.0† II: 284Non-SCC: 94 III: 101 IVA: 1 CCRT (n=585)13327 of 17848†IB2: 77SCC: 44771 of 229 (31%)90† II: 242Non-SCC: 96 III: 100 IVA: 2 AH, adjuvant hysterectomy; CCRT, concurrent chemoradiotherapy; EBRT, external beam radiotherapy; ICBT, intracavitary brachytherapy; LN, lymph node; MRI, magnetic resonance imaging; NR, not reported; RCT, randomized controlled trial; RH, radical hysterectomy; SCC, squamous cell carcinoma; SH, simple hysterectomy. *Mean; †weighted average; ‡median duration of chemoradiation in the group with no AH; §brachytherapy was not performed for the AH group; ‖good response was defined as a decrease in tumor volume of at least 50% according to MRI on completion of CCRT; ¶all patients who did not show progressive disease after CCRT completion; **adjusted variables are as follow: age (a); stage (b); histology (c); initial tumor size (d); pelvic LN metastasis (e); disease status after CCRT (f); median follow-up period (g).
Table 1. (Continued) Characteristics of studies included in the meta-analysis
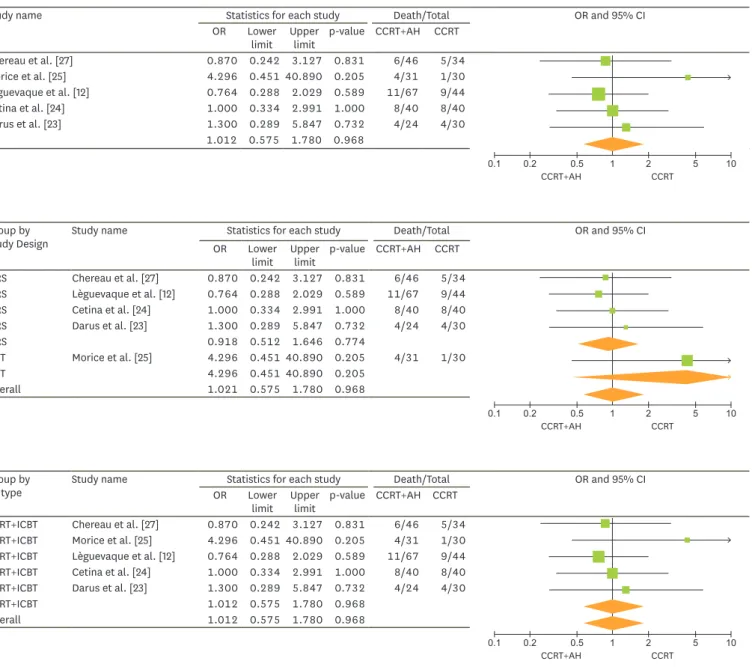
difference in the mortality rate was observed between the 2 groups (OR=1.01; 95% CI=0.58–
1.78; p=0.968) with low cross-study heterogeneity (p=0.73 and I2=0.0) (Fig. 2A).
In the sensitivity analysis, no study significantly influenced the pooled OR for AH and mortality (Supplementary Fig. 1A). No publication bias was found; the funnel plot was symmetrical (Supplementary Fig. 2A).
Study name Statistics for each study Death/Total OR and 95% CI
OR Lower limit Upper
limit p-value CCRT+AH CCRT
Chereau et al. [27] 0.870 0.242 3.127 0.831 6/46 5/34
Morice et al. [25] 4.296 0.451 40.890 0.205 4/31 1/30
Lèguevaque et al. [12] 0.764 0.288 2.029 0.589 11/67 9/44
Cetina et al. [24] 1.000 0.334 2.991 1.000 8/40 8/40
Darus et al. [23] 1.300 0.289 5.847 0.732 4/24 4/30
1.012 0.575 1.780 0.968
A
0.2
0.1 0.5 1 2 5 10
CCRT+AH CCRT
Group by
Study Design Study name Statistics for each study Death/Total OR and 95% CI
OR Lower limit Upper
limit p-value CCRT+AH CCRT
NRS Chereau et al. [27] 0.870 0.242 3.127 0.831 6/46 5/34
NRS Lèguevaque et al. [12] 0.764 0.288 2.029 0.589 11/67 9/44
NRS Cetina et al. [24] 1.000 0.334 2.991 1.000 8/40 8/40
NRS Darus et al. [23] 1.300 0.289 5.847 0.732 4/24 4/30
NRS 0.918 0.512 1.646 0.774
RCT Morice et al. [25] 4.296 0.451 40.890 0.205 4/31 1/30
RCT 4.296 0.451 40.890 0.205
Overall 1.021 0.575 1.780 0.968
B
0.2
0.1 0.5 1 2 5 10
CCRT+AH CCRT
Group by
RT type Study name Statistics for each study Death/Total OR and 95% CI
OR Lower limit Upper
limit p-value CCRT+AH CCRT EBRT+ICBT Chereau et al. [27] 0.870 0.242 3.127 0.831 6/46 5/34 EBRT+ICBT Morice et al. [25] 4.296 0.451 40.890 0.205 4/31 1/30 EBRT+ICBT Lèguevaque et al. [12] 0.764 0.288 2.029 0.589 11/67 9/44 EBRT+ICBT Cetina et al. [24] 1.000 0.334 2.991 1.000 8/40 8/40
EBRT+ICBT Darus et al. [23] 1.300 0.289 5.847 0.732 4/24 4/30
EBRT+ICBT 1.012 0.575 1.780 0.968
Overall 1.012 0.575 1.780 0.968
C
0.2
0.1 0.5 1 2 5 10
CCRT+AH CCRT
Fig. 2. (A) ORs for the risk of mortality in each study and all studies combined; AH following CCRT was compared with CCRT alone in a meta-analysis based on the fixed-effects model. Low cross-study heterogeneity was observed (p=0.73, I2=0.0). The association between AH and mortality in subgroup meta-analyses is shown according to (B) study design, (C) type of radiation, (D) response after CCRT, and (E) type of hysterectomy. The size of each square is proportional to the sample size in each study, and the horizontal line through the square indicates the 95% CI for that study. For the pooled analysis, the diamond indicates the pooled value, and the right and left ends of the diamond indicate the 95% CI for the analysis.
AH, adjuvant hysterectomy; CCRT, concurrent chemoradiotherapy; CI, confidence interval; EBRT, external beam radiation; ICBT, intracavitary brachytherapy;
NRS, non-randomized study; OR, odds ratio; RCT, randomized controlled trial; RH, radical hysterectomy; SH, simple hysterectomy. (continued to the next page)
4. AH and mortality risk in subgroup meta-analyses
Fig. 2B illustrates the ORs for AH and mortality for each study and the pooled ORs for study design (NRS or RCT). Only 1 RCT was included (61 patients); the OR was 4.30 (95% CI=0.45–
40.9; p=0.205). There were 4 NRS studies (325 patients); the pooled OR was 0.92 (95%
CI=0.51–1.65; p=0.774) (p=0.95 and I2=0.0), indicating no significant difference in mortality rate between the groups.
Fig. 2C shows the pooled ORs for mortality according to radiation type (ICBT following EBRT or EBRT only). ICBT following EBRT was performed for both CCRT+AH and CCRT groups in all five studies. The pooled OR was 1.01 (95% CI=0.58–1.78; p=0.968) with low cross-study heterogeneity (p=0.73 and I2=0.0).
Fig. 2D shows the pooled ORs for mortality according to response after CCRT. In the 2 studies with good responders or complete responders after CCRT [12,25], no significant difference in mortality was found between the CCRT+AH and CCRT groups (OR=1.00; 95% CI=0.41–2.46;
p=0.993) (p=0.17 and I2=47.4). In the remaining studies, no significant difference in mortality was found between the 2 groups (OR=1.02; 95% CI=0.49–2.10; p=0.965) (p=0.92 and I2=0.0).
Fig. 2. (Continued) (A) ORs for the risk of mortality in each study and all studies combined; AH following CCRT was compared with CCRT alone in a meta- analysis based on the fixed-effects model. Low cross-study heterogeneity was observed (p=0.73, I2=0.0). The association between AH and mortality in subgroup meta-analyses is shown according to (B) study design, (C) type of radiation, (D) response after CCRT, and (E) type of hysterectomy. The size of each square is proportional to the sample size in each study, and the horizontal line through the square indicates the 95% CI for that study. For the pooled analysis, the diamond indicates the pooled value, and the right and left ends of the diamond indicate the 95% CI for the analysis.
AH, adjuvant hysterectomy; CCRT, concurrent chemoradiotherapy; CI, confidence interval; EBRT, external beam radiation; ICBT, intracavitary brachytherapy;
NRS, non-randomized study; OR, odds ratio; RCT, randomized controlled trial; RH, radical hysterectomy; SH, simple hysterectomy.
Group by Good responders after RT
Study name Statistics for each study Death/Total OR and 95% CI
OR Lower limit Upper
limit p-value CCRT+AH CCRT
No Chereau et al. [27] 0.870 0.242 3.127 0.831 6/46 5/34
No Cetina et al. [24] 1.000 0.334 2.991 1.000 8/40 8/40
No Darus et al. [23] 1.300 0.289 5.847 0.732 4/24 4/30
No 1.017 0.491 2.105 0.965
Yes Morice et al. [25] 4.296 0.451 40.890 0.205 4/31 1/30
Yes Lèguevaque et al. [12] 0.764 0.288 2.029 0.589 11/67 9/44
Yes 1.004 0.410 2.460 0.993
Overall 1.021 0.575 1.780 0.968
D
0.2
0.1 0.5 1 2 5 10
CCRT+AH CCRT
Group by
RT type Study name Statistics for each study Death/Total OR and 95% CI
OR Lower limit Upper
limit p-value CCRT+AH CCRT
RH Cetina et al. [24] 1.000 0.334 2.991 1.000 8/40 8/40
RH 1.000 0.334 2.991 1.000
SH Darus et al. [23] 1.300 0.289 5.847 0.732 4/24 4/30
SH 1.300 0.289 5.847 0.732
SH+RH Chereau et al. [27] 0.870 0.242 3.127 0.831 6/46 5/34
SH+RH Morice et al. [25] 4.296 0.451 40.890 0.205 4/31 1/30
SH+RH Lèguevaque et al. [12] 0.764 0.288 2.029 0.589 11/67 9/44
SH+RH 0.958 0.460 1.996 0.908
Overall 1.012 0.575 1.780 0.968
E
0.2
0.1 0.5 1 2 5 10
CCRT+AH CCRT
Fig. 2E shows the pooled ORs for mortality according to AH type. In three studies featuring a mixture of SH and RH [12,25,27], there was no significant difference in mortality between the groups (OR=0.96; 95% CI=0.46–2.00; p=0.908) (p=0.38 and I2=0.0). There was 1 study each for RH (OR=1.00; 95% CI=0.33–2.99; p>0.99) [24] and SH (OR=1.30; 95% CI=0.29–5.85; p=0.732) [23].
5. Meta-analysis of the impact of AH on recurrence
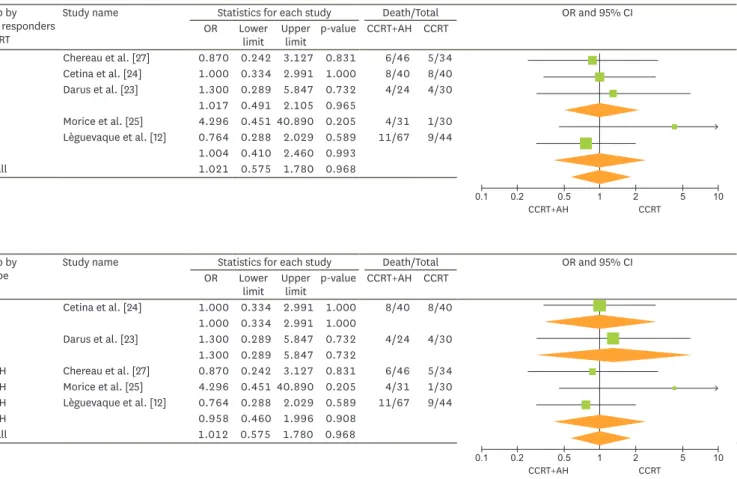
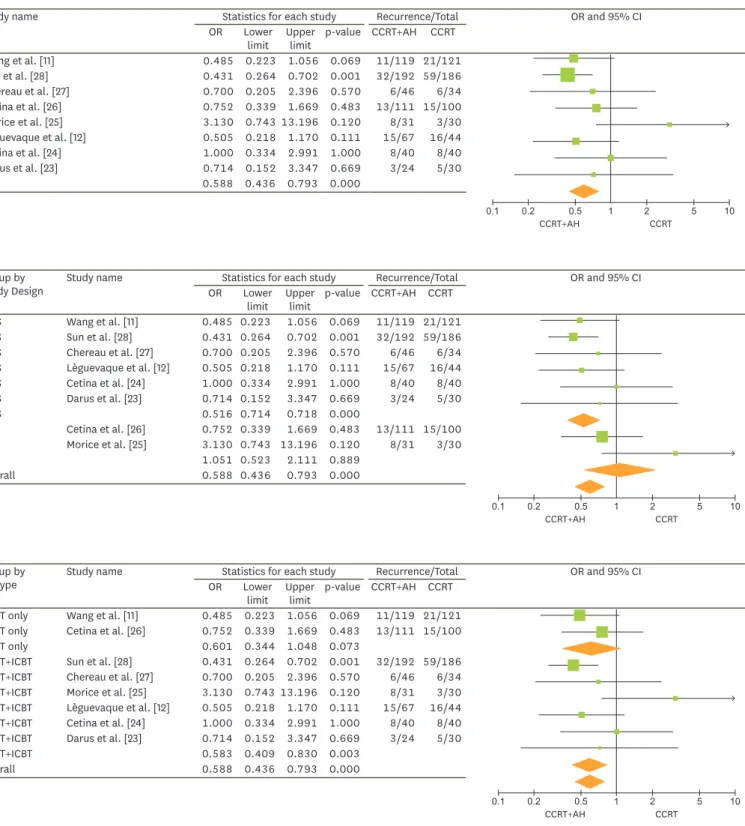
The eight studies comprised a total of 1,215 patients with a combined total of 229 recurrences (96/630 patients with CCRT+AH vs. 133/585 patients with CCRT). The pooled OR for AH and any recurrence was 0.59 (95% CI=0.44–0.79; p<0.05) with low cross-study heterogeneity (p=0.29 and I2=17.8), favoring the CCRT+AH group (Fig. 3A). No publication bias was found (p=0.11);
the funnel plot was symmetrical (Supplementary Fig. 2B). Seven studies, assessing 837 patients, reported on local recurrence (Fig. 4A). The results favored the CCRT+AH group (OR=0.56;
95% CI=0.33–0.96; p=0.034) with low cross-study heterogeneity (p=0.96 and I2=0.0). No publication bias was found (p=0.23); the funnel plot was symmetrical (Supplementary Fig. 2C).
Seven studies, assessing 837 patients, reported on distant recurrence (Fig. 4B). There was no significant difference for distant recurrence between the 2 groups (OR=0.88; 95% CI=0.54–1.45;
p=0.621) with low cross-study heterogeneity (p=0.51 and I2=0.0). No publication bias was found (p=0.13); the funnel plot was symmetrical (Supplementary Fig. 2D).
The study by Sun et al. [28] significantly affected the pooled OR for AH and recurrence. When this study was excluded, no significant difference in recurrence was observed between the groups (OR=0.71; 95% CI=0.49–1.03; p=0.072) (Supplementary Fig. 1B).
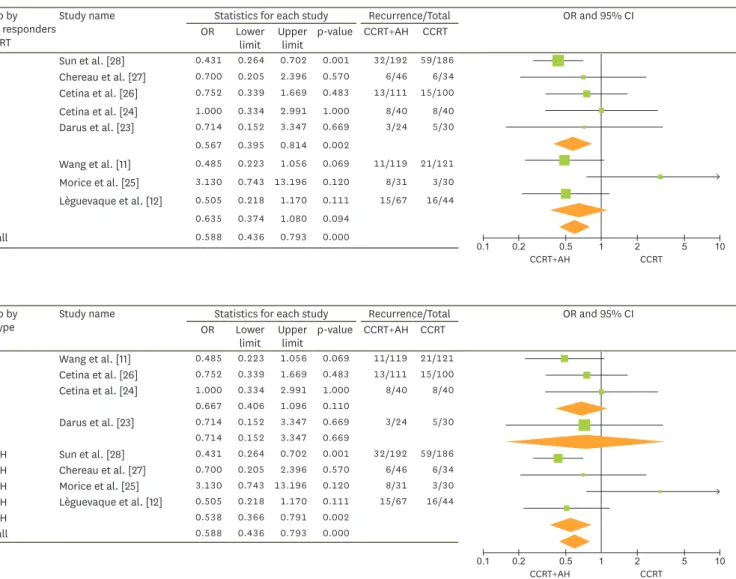
6. AH and the risk of recurrence in subgroup meta-analyses
Fig. 3B illustrates the ORs for AH and recurrence for each study and the pooled ORs
according to the type of study design. Two RCTs were conducted, with a total of 272 patients.
A total of 39 recurrences (21/141 with CCRT+AH) were observed in the RCTs. There was no significant difference in recurrence between the CCRT+AH and CCRT groups (OR=1.05; 95%
CI=0.52–2.11; p=0.889). There were 6 NRSs, with a total of 943 patients and a combined total of 190 recurrences (75/488 CCRT+AH). The pooled OR for observational studies was 0.52 (95% CI=0.37–0.72; p<0.05) (p=0.80 and I2=0.0) favoring CCRT+AH.
Fig. 3C shows the pooled ORs for recurrence according to radiation type. In the two studies in which the CCRT+AH group did not receive ICBT after EBRT [11,26], there was no significant difference in recurrence between the groups (OR=0.60; 95% CI=0.34–1.05; p=0.073) with low cross-study heterogeneity (p=0.44 and I2=0.0). However, the pooled OR for the remaining studies in which ICBT was administered to both groups after EBRT was 0.58 (95% CI=0.41–
0.83; p<0.05) (p=0.11 and I2=31.9), favoring CCRT+AH.
Fig. 3D illustrates the pooled ORs for AH and recurrence according to response after CCRT.
In the two studies of good responders or complete responders after CCRT [11,12,25], there was no significant difference in recurrence between groups (OR=0.64; 95% CI=0.37–1.08;
p=0.094) with substantial cross-study heterogeneity (p=0.07 and I2=63.4). However, the pooled OR for the remaining studies was 0.57 (95% CI=0.40–0.81; p<0.05) with low cross- study heterogeneity (p=0.57 and I2=0.0), thus favoring AH.
Fig. 3E shows the pooled ORs according to AH type. RH did not lead to a significant decrease in the risk of recurrence (OR=0.67; 95% CI=0.41–1.10; p=0.110) (p=0.53 and I2=0.0). For SH, only 1 study was reported (OR=0.71; 95% CI=0.15–3.35; p=0.669) [23].
A
Study name Statistics for each study Recurrence/Total OR and 95% CI
OR Lower limit Upper
limit p-value CCRT+AH CCRT
Wang et al. [11] 0.485 0.223 1.056 0.069 11/119 21/121
Sun et al. [28] 0.431 0.264 0.702 0.001 32/192 59/186
Chereau et al. [27] 0.700 0.205 2.396 0.570 6/46 6/34
Cetina et al. [26] 0.752 0.339 1.669 0.483 13/111 15/100
Morice et al. [25] 3.130 0.743 13.196 0.120 8/31 3/30
Lèguevaque et al. [12] 0.505 0.218 1.170 0.111 15/67 16/44
Cetina et al. [24] 1.000 0.334 2.991 1.000 8/40 8/40
Darus et al. [23] 0.714 0.152 3.347 0.669 3/24 5/30
0.588 0.436 0.793 0.000
0.2
0.1 0.5 1 2 5 10
CCRT+AH CCRT
B
Group by
Study Design Study name Statistics for each study Recurrence/Total OR and 95% CI
OR Lower limit Upper
limit p-value CCRT+AH CCRT
NRS Wang et al. [11] 0.485 0.223 1.056 0.069 11/119 21/121
NRS Sun et al. [28] 0.431 0.264 0.702 0.001 32/192 59/186
NRS Chereau et al. [27] 0.700 0.205 2.396 0.570 6/46 6/34
NRS Lèguevaque et al. [12] 0.505 0.218 1.170 0.111 15/67 16/44
NRS Cetina et al. [24] 1.000 0.334 2.991 1.000 8/40 8/40
NRS Darus et al. [23] 0.714 0.152 3.347 0.669 3/24 5/30
NRS 0.516 0.714 0.718 0.000
RCT Cetina et al. [26] 0.752 0.339 1.669 0.483 13/111 15/100
RCT Morice et al. [25] 3.130 0.743 13.196 0.120 8/31 3/30
RCT 1.051 0.523 2.111 0.889
Overall 0.588 0.436 0.793 0.000
0.2
0.1 0.5 1 2 5 10
CCRT+AH CCRT
C
Group by
RT type Study name Statistics for each study Recurrence/Total OR and 95% CI
OR Lower limit Upper
limit p-value CCRT+AH CCRT EBRT only Wang et al. [11] 0.485 0.223 1.056 0.069 11/119 21/121 EBRT only Cetina et al. [26] 0.752 0.339 1.669 0.483 13/111 15/100
EBRT only 0.601 0.344 1.048 0.073
EBRT+ICBT Sun et al. [28] 0.431 0.264 0.702 0.001 32/192 59/186 EBRT+ICBT Chereau et al. [27] 0.700 0.205 2.396 0.570 6/46 6/34 EBRT+ICBT Morice et al. [25] 3.130 0.743 13.196 0.120 8/31 3/30 EBRT+ICBT Lèguevaque et al. [12] 0.505 0.218 1.170 0.111 15/67 16/44 EBRT+ICBT Cetina et al. [24] 1.000 0.334 2.991 1.000 8/40 8/40
EBRT+ICBT Darus et al. [23] 0.714 0.152 3.347 0.669 3/24 5/30
EBRT+ICBT 0.583 0.409 0.830 0.003
Overall 0.588 0.436 0.793 0.000
0.2
0.1 0.5 1 2 5 10
CCRT+AH CCRT
Fig. 3. (A) ORs for the risk of any recurrence in each study and all studies combined; AH following CCRT was compared with CCRT alone in a meta-analysis based on the fixed-effects model. Low cross-study heterogeneity was observed (p=0.29, I2=17.8). The association between AH and recurrence in subgroup meta- analyses is shown according to (B) study design, (C) type of radiation, (D) response after CCRT, and (E) type of hysterectomy.
AH, adjuvant hysterectomy; CCRT, concurrent chemoradiotherapy; CI, confidence interval; EBRT, external beam radiotherapy; ICBT, intracavitary brachytherapy;
NRS, non-randomized study; OR, odds ratio; RCT, randomized controlled trial; RH, radical hysterectomy; SH, simple hysterectomy. (continued to the next page)
7. Grade 3 and higher adverse events
Data regarding postoperative complications were available for three studies [24,26,28]
(Table 2). Of those, Sun et al. [28] reported postoperative complications of grade 2 or higher, whereas the other 2 reported complications of grade 3 or higher [24,26]. Only the RCT by Cetina et al. [26] clearly gave information according to intraoperative, early, and late postoperative complications after AH. The pooled incidence of grade 3 or higher postoperative complications was 26.5% (95% CI=19.5%–33.5%).
Data on late toxicity were available for four studies [11,23,24,26] (Table 2). The most common grade 3 or higher adverse event was small/large bowel toxicity in both groups. There were no significant differences in incidence of grade 3 or higher late toxicities between the 2 groups (5.2%, 95% CI=2.6%–7.7% vs. 4.4%, 95% CI=2.1%–6.8%; 2-proportion z-test, p=0.68).
Group by
Op. type Study name Statistics for each study Recurrence/Total OR and 95% CI
OR Lower limit Upper
limit p-value CCRT+AH CCRT
RH Wang et al. [11] 0.485 0.223 1.056 0.069 11/119 21/121
RH Cetina et al. [26] 0.752 0.339 1.669 0.483 13/111 15/100
RH Cetina et al. [24] 1.000 0.334 2.991 1.000 8/40 8/40
RH 0.667 0.406 1.096 0.110
SH Darus et al. [23] 0.714 0.152 3.347 0.669 3/24 5/30
SH 0.714 0.152 3.347 0.669
SH+RH Sun et al. [28] 0.431 0.264 0.702 0.001 32/192 59/186
SH+RH Chereau et al. [27] 0.700 0.205 2.396 0.570 6/46 6/34
SH+RH Morice et al. [25] 3.130 0.743 13.196 0.120 8/31 3/30
SH+RH Lèguevaque et al. [12] 0.505 0.218 1.170 0.111 15/67 16/44
SH+RH 0.538 0.366 0.791 0.002
Overall 0.588 0.436 0.793 0.000
E
0.2
0.1 0.5 1 2 5 10
CCRT+AH CCRT
D
Group by Good responders after RT
Study name Statistics for each study Recurrence/Total OR and 95% CI
OR Lower limit Upper
limit p-value CCRT+AH CCRT
No Sun et al. [28] 0.431 0.264 0.702 0.001 32/192 59/186
No Chereau et al. [27] 0.700 0.205 2.396 0.570 6/46 6/34
No Cetina et al. [26] 0.752 0.339 1.669 0.483 13/111 15/100
No Cetina et al. [24] 1.000 0.334 2.991 1.000 8/40 8/40
No Darus et al. [23] 0.714 0.152 3.347 0.669 3/24 5/30
No 0.567 0.395 0.814 0.002
Yes Wang et al. [11] 0.485 0.223 1.056 0.069 11/119 21/121
Yes Morice et al. [25] 3.130 0.743 13.196 0.120 8/31 3/30
Yes Lèguevaque et al. [12] 0.505 0.218 1.170 0.111 15/67 16/44
Yes 0.635 0.374 1.080 0.094
Overall 0.588 0.436 0.793 0.000
0.2
0.1 0.5 1 2 5 10
CCRT+AH CCRT
Fig. 3. (Continued) (A) ORs for the risk of any recurrence in each study and all studies combined; AH following CCRT was compared with CCRT alone in a meta-analysis based on the fixed-effects model. Low cross-study heterogeneity was observed (p=0.29, I2=17.8). The association between AH and recurrence in subgroup meta-analyses is shown according to (B) study design, (C) type of radiation, (D) response after CCRT, and (E) type of hysterectomy.
AH, adjuvant hysterectomy; CCRT, concurrent chemoradiotherapy; CI, confidence interval; EBRT, external beam radiotherapy; ICBT, intracavitary brachytherapy;
NRS, non-randomized study; OR, odds ratio; RCT, randomized controlled trial; RH, radical hysterectomy; SH, simple hysterectomy.
DISCUSSION
In the current meta-analysis, AH after CCRT in LACC patients had no benefit in terms of survival, compared with no AH after CCRT. This pattern was consistently observed in the subgroup analyses of study design, radiation type, response after CCRT, and type of hysterectomy, although AH was associated with a reduced recurrence rate.
AH following radiotherapy has been utilized based on the concept that it may improve local control, and positively affect survival in patients with LACC. In the GOG-71 trial, 256 LACC patients treated with radiation without concomitant chemotherapy were randomly assigned to AH after radiation (n=132) or radiation only (n=124) [7]. There was no difference in survival between the two arms, although the 5-year local relapse rate was lower in the AH arm (14% vs. 27%). At the present time, the standard treatment for LACC is platinum-based CCRT, since CCRT offers improvement in overall survival as well as local and distant control [4]. Therefore, studies without concomitant chemotherapy are rarely clinically valid. It is important to examine the published data regarding the role of AH in the era of CCRT. In this regard, our meta-analysis is timely and appropriate.
Study name Statistics for each study Recurrence/Total OR and 95% CI
OR Lower limit Upper
limit p-value CCRT+AH CCRT
Wang et al. [11] 0.491 0.144 1.677 0.257 4/119 8/121
Chereau et al. [27] 0.356 0.031 4.091 0.407 1/46 2/34
Cetina et al. [26] 0.606 0.221 1.657 0.329 7/111 10/100
Morice et al. [25] 0.966 0.127 7.334 0.973 2/31 2/30
Lèguevaque et al. [12] 0.383 0.126 1.165 0.091 6/67 9/44
Cetina et al. [24] 0.778 0.193 3.137 0.724 4/40 5/40
Darus et al. [23] 1.261 0.075 21.266 0.872 1/24 1/30
0.562 0.329 0.958 0.034
A
0.2
0.1 0.5 1 2 5 10
CCRT+AH CCRT
Study name Statistics for each study Recurrence/Total OR and 95% CI
OR Lower limit Upper
limit p-value CCRT+AH CCRT
Wang et al. [11] 0.519 0.200 1.351 0.179 7/119 13/121
Chereau et al. [27] 0.915 0.226 3.696 0.900 5/46 4/34
Cetina et al. [26] 1.086 0.321 3.673 0.895 6/111 5/100
Morice et al. [25] 6.960 0.784 61.788 0.082 6/31 1/30
Lèguevaque et al. [12] 0.820 0.281 2.392 0.717 9/67 7/44
Cetina et al. [24] 1.370 0.286 6.559 0.693 4/40 3/40
Darus et al. [23] 0.591 0.099 3.539 0.565 2/24 4/30
0.883 0.538 1.448 0.621
B
0.2
0.1 0.5 1 2 5 10
CCRT+AH CCRT
Fig. 4. (A) ORs for the risk of local recurrence in each study and all studies combined; AH following CCRT was compared with CCRT alone in a meta-analysis based on the fixed-effects model. Low cross-study heterogeneity was observed (p= 0.96, I2=0.0). (B) ORs for the risk of distant recurrence in each study and all studies combined; AH following CCRT was compared with CCRT alone in a meta-analysis based on the fixed-effects model. Low cross-study heterogeneity was observed (p= 0.51, I2=0.0).
AH, adjuvant hysterectomy; CCRT, concurrent chemoradiotherapy; CI, confidence interval; OR, odds ratio.
In terms of recurrence, the results of the study design subgroups differ; estimates from the NRSs implied that AH prevented recurrence, whereas those from the RCTs did not.
One possible explanation is that inherent design features of NRSs may lead to selection bias. Although prognostic variables such as age, stage, histology, and tumor size were evenly distributed between the two groups in the NRSs, patients with distant metastasis or progressive disease during/after CCRT would have not undergone AH. The lymph node (LN) metastasis rate in the CCRT group (31%) was higher than that of the CCRT+AH group (17%) in 3 NRSs that reported the nodal metastasis rate [11,12,24], whereas there was no difference in LN metastasis rate in the RCTs [25]. This implies that patients with a more favorable prognosis may receive AH in NRSs. In addition, after sensitivity analysis, the overall association between AH and recurrence was significantly influenced by the study by Sun et al. [28]. Furthermore, the control groups in the 6 NRSs had a higher recurrence rate (115/455, 25%) compared with the RCTs (18/130, 14%). As seen in Table 1, baseline risk factors of recurrence differed between the control groups; compared with the RCTs, the NRS control groups had more stage III/IVA disease (0% vs. 34%) and LN metastasis (29% vs. 36%). These selection bias features may have influenced the high rate of recurrence in the NRS control groups, and the results should be interpreted with caution.
Clinicians' concern of AH after CCRT is for cases with residual disease after CCRT. Some experts believe that AH may be effective in patients with persistent residual disease after CCRT [29-31]. Houvenaeghel et al. [30] reported that AH may improve prognosis in LACC patients with macroscopic residual disease after CCRT, allowing a 3-year survival rate of 64.9%.
Meanwhile, Azria et al. [32] have reported that the therapeutic effect of AH was disappointing in their small series of 10 patients who developed bulky (>2 cm) residual disease after CCRT for LACC, because LN metastasis was frequent in these patients. Recently, Kim et al. [33]
reported the disease course in 53 patients with residual disease using MRI 3 months after CCRT for LACC [33]. In their analysis, 60% of patients with residual tumors did not show further Table 2. Severe adverse events associated with treatment*
Symptom Cetina et al. [26] Cetina et al. [24] Darus et al. [23] Wang et al. [11] Sun et al. [28] All combined CCRT
(n=100) CCRT+AH (n=111) CCRT
(n=40) CCRT+AH (n=40) CCRT
(n=30) CCRT+AH (n=24) CCRT
(n=121) CCRT+AH (n=119) CCRT
(n=186) CCRT+AH
(n=192) CCRT CCRT+AH Intraoperative complications
Vascular NA 3 (2.7) NA 0 NA NR NA NR NA 2 (1.0)† NA 5 (1.5)
Urethral tear NA 1 (0.9) NA 0 NA NR NA NR NA 0 NA 1 (0.3)
Ureter section NA 2 (1.8) NA 0 NA NR NA NR NA 0 NA 2 (0.6)
Early postoperative complications
Bleeding NA 9 (9.0) NA 0 NA NR NA NR NA 0 NA 9 (2.6)
Local infection NA 2 (1.8) NA 3 (7.5) NA NR NA NR NA 0 NA 5 (1.5)
Late postoperative complications
Local infection NA 6 (5.4) NA 0 NA NR NA NR NA 5 (2.6)† NA 11 (3.2)
Systemic infection NA 1 (0.9) NA 0 NA NR NA NR NA 1 (0.5)† NA 2 (0.6)
Lymphocyst NA 3 (2.7) NA 5 (12.5) NA NR NA NR NA 15 (7.8)† NA 23 (6.7)
Urinary NA 0 NA 5 (12.5) NA NR NA NR NA 7 (3.6)† NA 12 (3.5)
Gastrointestinal NA 0 NA 0 NA NR NA NR NA 2 (1.0)† NA 2 (0.6)
Total events NA 27 (24.3) NA 13 (32.5) NA NR NA NR NA 32 (16.7)† NA 72 (21.0)
Late toxicity
Small/Large intestine 4 (4) 2 (1.8) 2 (5) 0 2 (6.7) 2 (8.3) 0 1 (0.8) NR NR 8 (2.7) 5 (1.7)
Bladder 3 (3) 0 3 (7.5) 2 (5) 0 1 (4.2) 0 0 NR NR 6 (2.1) 3 (1.0)
Kidney 0 0 0 0 0 0 1 (0.8) 5 (4.2) NR NR 1 (0.3) 5 (1.7)
Total events, n (%) 7 (7) 2 (1.8) 5 (12.5) 2 (5) 2 (6.7) 3 (12.5) 1 (0.8) 6 (5.0) NR NR 15 (5.2) 13 (4.4) Date shown are number (%).
AH, adjuvant hysterectomy; CCRT, concurrent chemoradiotherapy; NA, not applicable; NR, not reported.
*Toxicity assessment was performed according to Radiation Therapy Oncology Group toxicity criteria and the Chassagne grading system; †grade 2 or more.