http://dx.doi.org/10.4174/astr.2016.90.5.250 Annals of Surgical Treatment and Research
Prognostic significance of intraoperative macroscopic serosal invasion finding when it shows a discrepancy in pathologic result gastric cancer
Sang Yull Kang, Ho Sung Park1, Chan-Young Kim
Departments of Surgery and 1Pathology, Chonbuk National University Medical School, Jeonju, Korea
INTRODUCTION
Early detection, rational lymphadenectomy, and the develop
ment of several therapeutic modalities have improved the survival of patients with gastric cancer [13]. Nevertheless, gastric cancer remains the fourth most common malignant tumor and the second leading cause of cancerrelated deaths worldwide [4]. The most important prognostic indicators in gastric cancer are depth of wall invasion (pT) and the status of lymph node metastasis (pN) [57]. Therefore, accurate
determination of invasive depth and lymph node metastasis, or the optimization of pT and pN categories, is critical for determining the extent of disease, guiding treatment planning, and predicting outcomes [8].
Peritoneal recurrence is common after curative resection of serosa positive gastric cancer because of free intraperitoneal cancer cells exfoliated from the serosal surface [9]. Although histologically determined pathologic serosal invasion is an important prognostic factor in patients with gastric cancer [10], the prognostic significance of intraoperative macroscopic Purpose: Depth of wall invasion is an important prognostic factor in patients with gastric cancer, whereas the prognostic significance of intraoperative macroscopic serosal invasion (mSE) findings remain unclear when they show a discrepancy in pathologic findings. This study, therefore, assessed the prognostic significance of mSE.
Methods: Data from cohort of 2,835 patients with resectable gastric cancer who underwent surgery between 1990 and 2010 were retrospectively reviewed.
Results: The overall accuracy of mSE and pathologic results was 83.4%. The accuracy of mSE was 75.5% in pT2. On the other hand, the accuracy of pT3 dropped to 24.5%. According to mSE findings (+/–), the 5-year disease-specific survival (DSS) rate differed significantly in patients with pT2 (+; 74.2% vs. –; 92.0%), pT3 (+; 76.7% vs. –; 91.8%) and pT4a (+; 51.3% vs. –;
72.8%) (P < 0.001 each), but not in patients with T1 tumor. Multivariate analysis showed that mSE findings (hazard ratio [HR], 2.275; 95% confidence interval [CI], 1.148–4.509), tumor depth (HR, 6.894; 95% CI, 2.325–20.437), nodal status (HR, 5.206;
95% CI, 2.298–11.791), distant metastasis (HR, 2.881; 95% CI, 1.388–6.209), radical resection (HR, 2.002; 95% CI, 1.017–3.940), and lymphatic invasion (HR, 2.713; 95% CI, 1.424–5.167) were independent predictors of 5-year DSS rate.
Conclusion: We observed considerable discrepancies between macroscopic and pathologic diagnosis of serosal invasion.
However, macroscopic diagnosis of serosal invasion was independently prognostic of 5-year DSS. It suggests that because the pathologic results could not be perfect and the local inflammatory change with mSE(+) could affect survival, a com- bination of mSE(+/–) and pathologic depth may be predictive of prognosis in patients with gastric cancer.
[Ann Surg Treat Res 2016;90(5):250-256]
Key Words: Stomach neoplasms, Serous membrane, Prognosis
Reviewed January February March April May June July August September October November December
Received October 15, 2015, Revised January 28, 2016, Accepted March 2, 2016
Corresponding Author: Chan-Young Kim
Department of Surgery, Chonbuk National University Medical School, 567 Baekje-daero, Deokjin-gu, Jeonju 54896, Korea
Tel: +82-63-250-2298, Fax: +82-63-271-6197 E-mail: [email protected]
Copyright ⓒ 2016, the Korean Surgical Society
cc Annals of Surgical Treatment and Research is an Open Access Journal. All articles are distributed under the terms of the Creative Commons Attribution Non- Commercial License (http://creativecommons.org/licenses/by-nc/4.0/) which permits unrestricted non-commercial use, distribution, and reproduction in any medium, provided the original work is properly cited.
serosal invasion (mSE) remains unclear. Discre pancies between macroscopic and pathologic serosal invasion have been reported [1113]. To date, however, few studies have evaluated the clinical significance of mSE. This study, therefore, assessed the prognostic significance of mSE.
METHODS
Cohort data of the 3,571 patients who underwent surgery for primary gastric adenocarcinoma from January 1990 to De
cember 2010 at the Department of Surgery, Chonbuk National University Medical School, were retrospectively reviewed.
Patients with macroscopic organ invasion, patients who had received neo adjuvant chemotherapy, patients who had undergone ex ploratory laparotomy or bypass surgery, and patients lacking a description of intraoperative serosal findings were excluded. The remaining 2,835 patients were included in the present study.
Clinicopathologic features were evaluated, including patient age, gender, extent of resection, tumor size, Borrman type, tumor differentiation, tumor depth and lymph nodal status.
Lymph node metastasis and depth of tumor invasion were classified according to the 7th edition of the American Joint Committee on Cancer/Union for International Cancer Control TNM staging system [14]. In patients with multiple synchronous gastric cancers, the lesion with the deepest infiltration of the gastric wall was regarded as the main lesion and any others were regarded as accessory lesions. The clinicopathological characteristics of the main lesion were used for the analysis.
Extent of lymph node dissection was determined using the recommendations of the Japanese Research Society for Gastric Carcinoma [15]. Resections were deemed curative when no gross residual disease was evident at the time of operation, with tumorfree resection margins on histological examination.
During surgery, patients with any evidence of hard and nodular texture and/or color change of the serosal surface of the pri
mary tumor were estimated as having mSE(+) by operator.
Not all patients were given postoperative chemotherapy.
Patients with advanced gastric cancer above TNM stage II were given 5fluorouracilbased postoperative chemotherapy, starting within 3 weeks after surgery. No patients were given postoperative or preoperative radiotherapy.
In general, followup consisted of abdominopelvic computed tomogram every 6 months for 5 years after surgery and esophagogastroduodenoscopy annually for 5 years after surgery. Cancer recurrence was defined as positive radiological evidence. Followup of patients was completed until the cutoff date of December 31, 2013. At the time of the last followup, 334 patients (11.8%) had been lost to follow up. The median follow
up interval at the cutoff date was 50 months (range, 0–232 months).
All statistical analyses were performed using the SPSS ver.
15.0 (SPSS, Inc., Chicago, IL, USA). Categorical variables were compared by chisquare tests and continuous variables by twotailed ttests. Diseasespecific survival (DSS) rates were determined using the KaplanMeier method and compared using logrank tests. Fiveyear DSS rates were estimated according to T category and compared for each T category bet
ween mSE(+) and mSE(–) patients. Multivariable Cox regression was used to identify factors significantly correlated with prognosis. For all analyses, P values <0.05 were considered statistically significant.
All information was obtained according to the Chonbuk National University Hospital Institutional Review Board and data were collected without revealing any personal information (IRB No. 201502014).
RESULTS
Clinicopathological characteristics of patients
Of the total of 2,835 patients, 1,946 (68.6%) were male
Table 1. Clinicopathological characteristics of patients (n = 2,835)
Characteristic Value
Age (yr) 59 ± 11
Sex
Male:female 1,946:889
Operation
Total gastrectomy 382 (13.5)
Partial gastrectomy 2,453 (86.5)
Tumor size (cm) 4.6 ± 3.4
Macroscopic type
EGC type 1,516 (53.5)
Bormann 1 79 (2.8)
Bormann 2 456 (16.1)
Bormann 3 608 (21.4)
Bormann 4 90 (3.2)
Differentiation
Differentiated 1,519 (53.6)
Undifferentiated 1,316 (46.4)
Tumor depth
pT1 1,590 (56.1)
pT2 368 (13.0)
pT3 396 (14.0)
pT4a 481 (16.9)
Nodal metastasis
pN0 1,861 (65.7)
pN1 315 (11.1)
pN2 274 (9.7)
pN3 384 (13.5)
Values are presented as mean ± standard deviation or number (%).
patients and 889 (31.4%) were female, with a male to female ratio of 2.19:1. Mean patient age was 59.0 (standard deviation, 11) years. Of the 2,835 patients, 2,453 (86.5%) underwent partial gastrectomy and 382 (13.5%) underwent total gastrectomy.
Pathologic examination classified 1,590 patients (56.8%) as pT1, 368 (12.9%) as pT2, 396 (13.9%) as pT3, and 481 (16.9%) as pT4a.
Lymph node metastasis was found in 979 patients (34.5%) (Table 1).
Accuracy of the macroscopic diagnosis of serosal invasion
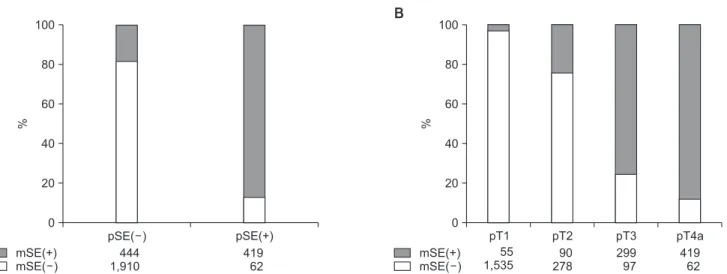
Fig. 1 shows a relationship of mSE(+/–) and pSE(+/–). mSE(–) was in 62 of the 481 pSE(+) patients (12.9%), whereas mSE(+) was in 444 of the 2,354 pSE() patients (18.9%). The overall accuracy of mSE(+/–) was 82.1%, its sensitivity and specificity were 87.1% and 81.1%, respectively, and its positive and negative predictive values were 48.6% and 96.9%, respectively. Rates of overestimation into mSE(+) in patients with pT1, pT2, and pT3 were 3.5% (55 of 1,590), 24.5% (90 of 368), 75.5% (299 of 396), respectively. pT4a was underestimated to mSE(–) by 12.9%.
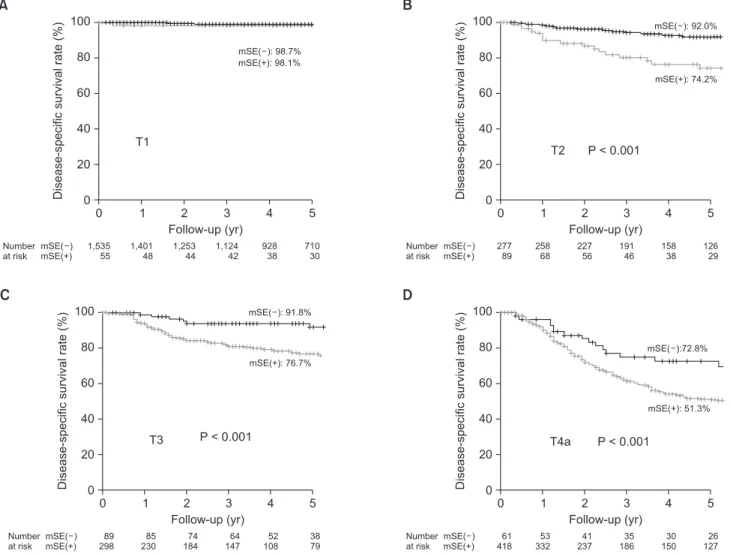
The 5year DSS in patients with pT1, pT2, pT3, and pT4a were 98.7%, 88.1%, 80.7%, and 54.1%, respectively (Fig. 2). Although 5year DSS were similar in patients with mSE(+) and mSE(–) in pT1 tumors, they were significantly higher in patients with mSE(–) than mSE(+) tumors classified as stages pT2 (92.0% vs.
74.2%, P < 0.001), pT3 (91.8% vs. 76.7%, P < 0.001), and pT4a (72.8% vs. 51.3%, P < 0.001) (Fig. 3).
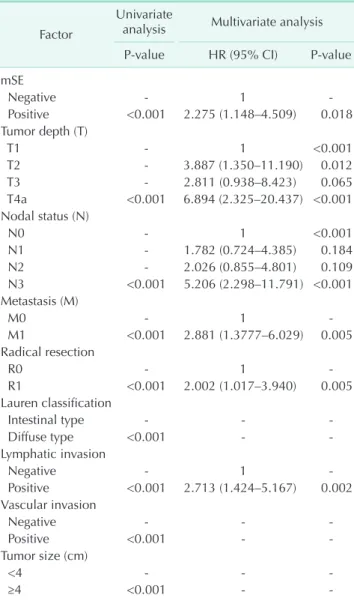
Table 2 shows the Cox regression analysis of factors signi
ficantly associated with 5year DSS. Univariate analysis showed that mSE, tumor depth, nodal status, distant metastasis, radical resection, Lauren classification, lymphatic invasion, vascular
invasion, and tumor size were significantly associated with 5year DSS. Multivariate analysis showed that mSE (HR, 2.275;
95% CI, 1.148–4.509), tumor depth (HR, 6.894; 95% CI, 2.325–
20.437), nodal status (HR, 5.206; 95% CI, 2.298–11.791), distant metastasis (HR, 2.881; 95% CI, 1.388–6.209), radical resection (HR, 2.002; 95% CI, 1.017–3.940), and lymphatic invasion (HR, 2.713; 95% CI, 1.424–5.167) were independent predictors of 5year DSS.
DISCUSSION
In patients with pSE(+) who received curative gastrectomy,
mSE(+) mSE( )
pSE( )
%
0 100
80
60
40
20
A
pSE(+) pT1 pT2 pT3 pT4a
444 1,910
419 62
%
0 100
80
60
40
20
B
mSE(+) mSE( )
55 1,535
90 278
299 97
419 62
Fig. 1. Macroscopic serosal invasion (mSE) and pathologic serosal invasion (pSE) show a discrepancy. (A) Overestimation into mSE(+) among pSE(–) is 18.9%. Underestimation into mSE(–) among pSE(+) is 12.9%. We could calculate sensitivity (87.1%), specificity (81.1%), positive predictive value (48.6%), negative predictive value (96.9%) and accuracy (82.1%) of mSE. (B) It shows the discrepancy according to pT category. pT1 (3.5%), pT2 (24.5%) and pT3 (75.5%) were overestimated to mSE(+). T4a (12.9%) was underestimated to mSE(–).
Fig. 2. Five-year disease-specific survival rate according to tumor depth (pT category). Five-year disease-specific survival rate of pT1, pT2, pT3, and pT4a were 98.7%, 88.1%, 80.7%, and 54.1%, respectively.
0 1 2 3 4 5
Disease-specificsurvivalrate(%)
Number at risk
0 100 80 60 40 20
T1 T2 T3 T4a
T1 T2 T3
T4a
Follow-up (yr) 1,590
366 387 479
1,449 326 315 385
1,297 283 258 278
1,166 237 211 221
966 196 161 180
740 155 117 153
as high as 50% of the patients died from peritoneal recurrence within 2 years. Peritoneal recurrence is the most common form of gastric cancer recurrence. [9,16,17] Therefore, pSE(+/–) is one of the most important factors in predicting prognosis, also it is important in controlling local recurrence and in choosing postsurgery treatment strategies [18]. Also, the finding of mSE(+/–) is important for determining insurgery strategy as the operator has no indications of pSE during surgery.
Jeong et al. [13] reported mSE accuracy as 88%, sensitivity 82%, and specificity 89%. This is similar to our result, which showed mSE accuracy as 82%, sensitivity 87.1%, and specificity 81.1%. However, in analyzing pT category (Fig. 1B), the accuracy in pT2 was 75.5%, it in pT3 was 24.5% showing a marked decrease in accuracy. Kim et al. [19] reported pT3 accuracy as 46.4% and Jeong et al. [13] reported the sum accuracy of pT2 and pT3 as 65.3%. This means that there is a greater chance to
overestimate pSE(–) into mSE(+) being the determining factor for insurgery strategy.
In terms of accuracy of pSE(+/–), it is difficult to describe because pathologic results are the final determination of tu
mor depth. If we consider pathologic results as an indicator of absolutely accurate real tumor depth, there should have been no difference in survival within mSE(+/–) of pT group subdivisions. However, there was a difference in survival. While this result raises the question as to whether pSE(+/–) results can be trusted, other reports have also shown that there is a problem in completely trusting the results of pSE(+/–) [19,20].
Kim et al. [19] and Wang et al. [20] showed similar survival in pT3 and pT4 patients with mSE(+). In our results, pT2 and 3 patients with mSE(+) had similar survival with pT4a with mSE(–). These results show the clinical importance of mSE and raises questions regarding pSE.
0 1 2 3 4 5
Disease-specificsurvivalrate(%)
Number at risk
0 100 80 60 40 20
mSE( ) mSE(+)
Follow-up (yr) 1,535
55 1,401
48 1,253
44 1,124
42 928
38 710
30
A
0 1 2 3 4 5
Disease-specificsurvivalrate(%)
Number at risk
0 100 80 60 40 20
mSE( ) mSE(+)
Follow-up (yr) 277
89 258
68 227
56 191
46 158
38 126
29
B
0 1 2 3 4 5
Disease-specificsurvivalrate(%)
Number at risk
0 100 80 60 40 20
mSE( ) mSE(+)
Follow-up (yr) 89
298 85 230
74 184
64 147
52 108
38 79
C
0 1 2 3 4 5
Disease-specificsurvivalrate(%)
Number at risk
0 100 80 60 40 20
mSE( ) mSE(+)
Follow-up (yr) 61
418 53 332
41 237
35 186
30 150
26 127
D
T1
mSE(+): 98.1%
mSE( ): 92.0%
T2 P < 0.001
mSE(+): 74.2%
mSE( ): 98.7%
mSE( ): 91.8%
mSE(+): 76.7%
T3 P < 0.001
mSE( ):72.8%
mSE(+): 51.3%
P < 0.001 T4a
Fig. 3. Five-year disease-specific survival rate in pT1–T4a according to mSE(+/–). (A) Five-year disease-specific survival rates were similar in patients with mSE(+) and mSE(–) of T1 tumors. (B-D) Five-year disease-specific survival rates were significantly higher in patients with mSE(–) than mSE(+) tumors of pT2 (92.0% vs. 74.2%, P < 0.001), pT3 (91.8% vs. 76.7%, P < 0.001), and pT4a (72.8% vs. 51.3%, P < 0.001). a)Macroscopic finding of serosal invasion. b)Indicates 5-year disease-specific survival rate. mSE, macroscopic serosal invasion.
Macroscopic judgement of serosal involvement depends on the operator’s subjective decisions that are based on the serosal change of color and/or texture comparative to the neighboring normal serosal surface. Serosal change without cancer penetration might be related to inflammation, which plays a role in all stages of tumorigenesis. Inflammatory microenvironment surrounding tumor cells promotes tumor growth, angiogenesis, and metastasis [21]. Furthermore, systemic inflammatory responses have a role in survival prediction in patients with primary operable cancer [22].
While Creactive protein level, neutrophil, and platelet counts represent the systemic inflammatory reaction, we post ulate that macroscopic serosal change might reflect local inflam
matory reaction which affects survival rates, except T1. We
suppose that T1 is too small to affect survival despite the serosal change.
The microscopic view of serosal involvement demands meticulous pathologic analysis and may require extensive sampling and/or serial sectioning. Thus, it can be missed on routine histopathologic examination. In addition, the histopathologic findings associated with peritoneal penetra
tion are heterogeneous, and standard guidelines for their diagnostic interpretation are lacking. Since there are appa
rent inconsistencies in the histological definitions of peri
toneal invasion, these problems result in both substantial interobserver variation and underdiagnosis of peritoneal in
volvement because most pathologists tend to err on the side of conservative interpretation [23].
Although depth of tumor invasion within the stomach wall is reflected in TNM stage, the area of invasion is not. Close relationships have been reported between the rate of detection of intraperitoneal free cancer cells and the area of serosal inva
sion, and between the latter and prognosis of patients who have gastric cancer with serosal invasion [17,24]. While this study does not show that difference in survival based on the surface area, the results showing a higher survival in T4a with mSE(–) (5year DSS; 72.8%) compared to T4a with mSE(+) (5
year DSS; 51.3%) could be based on the smaller surface area of invasion. Cases where the operator determined T4a tumor as mSE(–) during surgery could be because the involved serosa did not have a significant change in characteristic and small size. If we consider serosal invasion with this characteristic as minor pSE(+), the T2&3 with mSE(+) that showed a similar survival with T4a with mSE(–) could be considered minor pSE(+).
Diagnostic modalities that may improve the macroscopic diagnosis of serosal invasion include intraoperative and endo
scopic ultrasonographic determination of tumor depth [25].
The presence of peritoneal free cancer cells derived from the serosa may be determined by analyzing peritoneal lavage fluid.
For example, tumor markers in peritoneal lavage fluid may be predictive of peritoneal carcinomatosis [26]. Molecular methods that are more sensitive and more rapid than conventional peritoneal lavage fluid cytology can be used to detect peritoneal free cells [10]. Further studies are required to improve the accuracy of macroscopic serosal findings and to detect peri
toneal free cancer cells.
This study had several limitations, including its retrospective design and inclusion of patients treated at a single center.
Determination of intraoperative macroscopic serosal invasion depended primarily on subjective measurements by surgeons.
Since many surgeons were included in this study, bias may have been introduced. Prospective, multicenter, largescale studies analyzing the prognostic significance of macroscopic serosal invasion are required to confirm our results.
In conclusion, we observed considerable discrepancies bet
Table 2. Results of the univariate and multivariate analyses regarding disease-specific 5-year survival rates in 2,835 pa- tients
Factor
Univariate
analysis Multivariate analysis
P-value HR (95% CI) P-value
mSE
Negative - 1 -
Positive <0.001 2.275 (1.148–4.509) 0.018 Tumor depth (T)
T1 - 1 <0.001
T2 - 3.887 (1.350–11.190) 0.012
T3 - 2.811 (0.938–8.423) 0.065
T4a <0.001 6.894 (2.325–20.437) <0.001 Nodal status (N)
N0 - 1 <0.001
N1 - 1.782 (0.724–4.385) 0.184
N2 - 2.026 (0.855–4.801) 0.109
N3 <0.001 5.206 (2.298–11.791) <0.001 Metastasis (M)
M0 - 1 -
M1 <0.001 2.881 (1.3777–6.029) 0.005
Radical resection
R0 - 1 -
R1 <0.001 2.002 (1.017–3.940) 0.005
Lauren classification
Intestinal type - - -
Diffuse type <0.001 - -
Lymphatic invasion
Negative - 1 -
Positive <0.001 2.713 (1.424–5.167) 0.002 Vascular invasion
Negative - - -
Positive <0.001 - -
Tumor size (cm)
<4 - - -
≥4 <0.001 - -
mSE, macroscopic serosal invasion; HR, hazard ratio; CI, confi- dence interval.
ween macroscopic and pathologic diagnosis of serosal inva
sion. However, macroscopic diagnosis of serosal invasion was independently prognostic of 5year DSS. It suggests that because the pathologic results could not be perfect and local inflammatory change with mSE(+) could affect the survival, a combination of mSE(+/–) and pathologic tumor depth may be predictive of prognosis in patients with gastric cancer.
CONFLICTS OF INTEREST
No potential conflict of interest relevant to this article was reported.
ACKNOWLEDGEMENTS
This research was supported by Basic Science Research Program through the National Research Foundation of Korea (NRF) funded by the Ministry of Education, Science and Technology (20100005274).
1. Takagane A, Terashima M, Abe K, Araya M, Irinoda T, Yonezawa H, et al. Evalua
tion of the ratio of lymph node metastasis as a prognostic factor in patients with gastric cancer. Gastric Cancer 1999;2:122
8.
2. Lindsey H. Preoperative chemoradio
therapy shows promise in gastric cancer.
Lancet Oncol 2004;5:519.
3. Shimoyama S, Seto Y, Yasuda H, Mafune K, Kaminishi M. Concepts, rationale, and current outcomes of less invasive surgical strategies for early gastric cancer: data from a quartercentury of experience in a single institution. World J Surg 2005;29:
5865.
4. Jemal A, Siegel R, Ward E, Hao Y, Xu J, Thun MJ. Cancer statistics, 2009. CA Cancer J Clin 2009;59:22549.
5. Park do J, Kong SH, Lee HJ, Kim WH, Yang HK, Lee KU, et al. Subclassification of pT2 gastric adenocarcinoma according to depth of invasion (pT2a vs pT2b) and lymph node status (pN). Surgery 2007;141:
75763.
6. Lee CC, Wu CW, Lo SS, Chen JH, Li AF, Hsieh MC, et al. Survival predictors in patients with nodenegative gastric carci
noma. J Gastroenterol Hepatol 2007;22:
10148.
7. Kunisaki C, Shimada H, Nomura M, Matsuda G, Otsuka Y, Ono H, et al. Clini
cal impact of metastatic lymph node ratio
in advanced gastric cancer. Anticancer Res 2005;25(2B):136975.
8. Wang W, Sun XW, Li CF, Lv L, Li YF, Chen YB, et al. Comparison of the 6th and 7th editions of the UICC TNM staging system for gastric cancer: results of a Chinese singleinstitution study of 1,503 patients.
Ann Surg Oncol 2011;18:10607.
9. Yoo CH, Noh SH, Shin DW, Choi SH, Min JS. Recurrence following curative resec
tion for gastric carcinoma. Br J Surg 2000;
87:23642.
10. Fujiwara Y, Okada K, Hanada H, Tamura S, Kimura Y, Fujita J, et al. The clinical im
portance of a transcription reversetrans
crip tion concerted (TRC) diagnosis using peritoneal lavage fluids in gastric cancer with clinical serosal invasion: a prospec
tive, multicenter study. Surgery 2014;155:
41723.
11. Yasuda K, Shiraishi N, Inomata M, Shiro
shita H, Izumi K, Kitano S. Prognostic significance of macroscopic serosal inva
sion in advanced gastric cancer. Hepato
gastroenterology 2007;54:202831.
12. Ichiyoshi Y, Maehara Y, Tomisaki S, Oiwa H, Sakaguchi Y, Ohno S, et al. Macro
scopic intraoperative diagnosis of serosal invasion and clinical outcome of gastric cancer: risk of underestimation. J Surg Oncol 1995;59:25560.
13. Jeong O, Ryu SY, Jeong MR, Sun JW, Park YK. Accuracy of macroscopic intra
operative diagnosis of serosal invasion and risk of over and underestimation in gastric carcinoma. World J Surg 2011;35:
22528.
14. Edge SB, Compton CC. The American Joint Committee on Cancer: the 7th edition of the AJCC cancer staging manual and the future of TNM. Ann Surg Oncol 2010;
17:14714.
15. Japanese Gastric Cancer Association.
Japanese Classification of Gastric Carci
noma 2nd English Edition . Gastric Cancer 1998;1:1024.
16. Ribeiro U Jr, GamaRodrigues JJ, Safatle
Ribeiro AV, Bitelman B, Ibrahim RE, Ferreira MB, et al. Prognostic significance of intraperitoneal free cancer cells ob
tained by laparoscopic peritoneal lav age in patients with gastric cancer. J Gastro
intest Surg 1998;2:2449.
17. Ikeguchi M, Oka A, Tsujitani S, Maeta M, Kaibara N. Relationship between area of serosal invasion and intraperitoneal free cancer cells in patients with gastric cancer. Anticancer Res 1994;14(5B):21314.
18. SheenChen SM, Chou CW, Chen MC, Chen FC, Chen YS, Chen JJ. Adenocar
cinoma in the middle third of the sto
mach: an evaluation for the prognostic significance of clinicopathological fea
tures. Hepatogastroenterology 1997;44:
148894.
19. Kim DJ, Lee JH, Kim W. Impact of intra
REFERENCES
operative macroscopic diagnosis of serosal invasion in pathological subserosal (pT3) gastric cancer. J Gastric Cancer 2014;14:
2528.
20. Wang HH, Huang JY, Wang ZN, Sun Z, Li K, Xu HM. Macroscopic serosal classification as a prognostic index in radically resected stage pT3pT4b gastric cancer. Ann Surg Oncol 2016;23:14955.
21. Grivennikov SI, Greten FR, Karin M. Im
munity, inflammation, and cancer. Cell 2010;140:88399.
22. Roxburgh CS, McMillan DC. Role of
sys temic inflammatory response in pre
dicting survival in patients with primary operable cancer. Future Oncol 2010;6:149
63.
23. Shepherd NA, Baxter KJ, Love SB. The prognostic importance of peritoneal in
volve ment in colonic cancer: a prospective evaluation. Gastroenterology 1997;112:
1096102.
24. Kaibara N, Iitsuka Y, Kimura A, Koba
yashi Y, Hirooka Y, Nishidoi H, et al.
Relationship between area of serosal in vasion and prognosis in patients with
gas tric carcinoma. Cancer 1987;60:1369.
25. Bentrem D, Gerdes H, Tang L, Brennan M, Coit D. Clinical correlation of endoscopic ultrasonography with pathologic stage and outcome in patients undergoing cura
tive resection for gastric cancer. Ann Surg Oncol 2007;14:18539.
26. Yamamoto M, Yoshinaga K, Matsuyama A, Tsutsui S, Ishida T. CEA/CA724 levels in peritoneal lavage fluid are predictive factors in patients with gastric carcinoma.
J Cancer Res Clin Oncol 2014;140:60712.