http://dx.doi.org/10.4174/astr.2014.86.2.55 Annals of Surgical Treatment and Research
Bone mineral density and bone turnover markers in
patients on long-term suppressive levothyroxine therapy for differentiated thyroid cancer
Mi Young Lee1, Jae Hyun Park2, Keum Seok Bae2, Yong Gwan Jee1, An Na Ko1, Yong Jea Han1, Jang Yel Shin1, Jung Soo Lim1, Choon Hee Chung1,3, Seong Joon Kang2
Departments of 1Internal Medicine and 2Surgery, 3Institute of Life-Long Health, Yonsei University Wonju College of Medicine, Wonju, Korea
INTRODUCTION
Current management for patients with differentiated thyroid cancer includes near total thyroidectomy and radioactive iodine therapy followed by administration of supraphysiological doses of levothyroxine (L-T4). Because hyperthyroidism accelerates bone turnover and shortens the normal bone remodeling cycle [1,2], it was expected that suppressive L-T4 therapy for
differentiated thyroid cancer might influence bone mineral density (BMD). Although longitudinal studies in patients with suppressive L-T4 therapy for differentiated thyroid cancer have reported conflicting data [3-12], the majority of investigators have concluded that recommended dose of L-T4 for postoperative therapy does not have negative effects on bone density [13].
However, the effects of suppressive L-T4 therapy on bone density in the Korean population have not been well defined.
Purpose: Current management for patients with differentiated thyroid cancer includes near total thyroidectomy and radioactive iodine therapy followed by administration of supraphysiological doses of levothyroxine (L-T4). Although hyperthyroidism is a well known risk factor for osteoporosis, the effects of L-T4 treatment on bone mineral density (BMD) in patients with thyroid cancer do not appear to be as significant as with endogenous hyperthyroidism. In this study, we evaluated the impact of long-term suppressive therapy with L-T4 on BMD and bone turn over markers in Korean female patients receiving L-T4 suppressive therapy.
Methods: We enrolled 94 female subjects (mean age, 50.84 ± 11.43 years) receiving L-T4 after total or near total thyroidectomy and radioactive iodine therapy for thyroid cancer (mean follow-up period, 12.17 ± 4.27 years). The subjects were divided into three groups by thyroid stimulating hormone (TSH) level (group 1 with TSH level ≤0.001 μIU/mL, group 2 with TSH level between 0.001 and 0.17 μIU/mL, group 3 with TSH level >0.17 μIU/mL) and four groups by quartile of free T4 level. L-T4 dosage, BMD (examined by dual-energy x-ray absorptiometry), and bone turnover markers were evaluated according to TSH and free T4 levels.
Results: No significant decrease was detected in BMD or bone turnover markers according to TSH level or free T4 level.
Also, the prevalence of osteoporosis and osteopenia was not different among groups.
Conclusion: Long-term L-T4 suppressive therapy after thyroid cancer management did not affect bone density or increase the prevalence of osteoporosis even though TSH levels were supraphysiologically suppressed.
[Ann Surg Treat Res 2014;86(2):55-60]
Key Words: Thyroid neplasms, Levothyroxine, Bone mineral density, Osteoporosis, Osteopenia
Received August 9, 2013, Revised September 25, 2013, Accepted October 2, 2013
Corresponding Author: Seong Joon Kang
Department of Surgery, Yonsei University Wonju College of Medicine, 20 Ilsan-ro, Wonju 220-701, Korea
Tel: +82-33-741-1303, Fax: +82-33-731-5884 E-mail: [email protected]
Copyright ⓒ 2014, the Korean Surgical Society
cc Annals of Surgical Treatment and Research is an Open Access Journal. All articles are distributed under the terms of the Creative Commons Attribution Non- Commercial License (http://creativecommons.org/licenses/by-nc/3.0/) which permits unrestricted non-commercial use, distribution, and reproduction in any medium, provided the original work is properly cited.
The aim of our study is to evaluate the impact of long-term suppressive therapy with L-T4 on BMD and bone turnover markers in Korean female patients who have undergone suppressive therapy for more than 10 years.
METHODS
Subjects
This cross-sectional study was conducted at a single center, Yonsei University Wonju College of Medicine, Korea. Ninety- four female subjects (range, 35-79 years) who underwent total or near total thyroidectomy and radioactive iodine therapy due to thyroid-differentiated carcinoma were enrolled in the study. We enrolled subjects from October 2009 to October 2010. Mean follow-up period was 12.17 ± 4.27 years (median, 12.00 years; range, 5–22 years) and 60.4% of enrolled subjects had been receiving L-thyroxine for more than 10 years. The mean dosage of L-thyroxine during the follow-up period was 160 μg (range, 25–200 μg/day). The percentage of subjects who were premenopausal was 66.7%. Patients with a history of vertebral or femoral fracture that were treated with agents that could interfere with bone metabolism, such as steroids and bisphosphonates, were excluded. To examine the effects of L-T4 on skeletal tissue, we analyzed BMD, bone turnover markers, and biochemical parameters from all subjects, who were divided into three groups by thyroid stimulating hormone (TSH) level (group 1 with TSH level ≤0.001 μIU/mL; group 2 with TSH level between 0.001 and 0.17 μIU/mL; group 3 with TSH level >0.17 μIU/mL) and four groups by quartile of free T4 level. Because most patient TSH levels were suppressed below 0.01 μIU/mL (61.4% of subjects), TSH level could not be grouped into tertiles. Instead, patients with TSH level above 0.01 μIU/mL were divided into two groups-upper 50% and lower 50%.
BMD and laboratory assays
BMD was measured at the lumbar spine (levels L2–4), femur neck, and trochanter by dual-energy radiographic absorptiometry (LUNAR prodigy, GE Healthcare, Little Chalfont, UK). T-score was defined as the number of standard deviations (SDs) between measured values and the mean for a control group from the general population matched for gender at 25–45 years of age.
T-score ≤-2.5 SD at the lumbar spine, femur neck, or femur trochanter was defined as osteoporosis; T-score between –2.5 and –1.0 SD was defined as osteopenia; T-score ≥ –1.0 was defined as normal. A serum sample was taken from each participant without overnight fasting. We measured free T4 and TSH using the Centaur system (Siemens, Munich, Germany).
For bone turnover markers, osteocalcin representative bone formation marker and C-telopeptides of type I collagen (CTX, Modular E170, Hoffmann-La Roche, Basel, Switzerland) representative bone resorption marker were measured.
Statistical analysis
Data were expressed as the mean ± SD. A one-way analysis of variance was used for the comparison of various anthropometric parameters, biochemical parameters, and BMD.
The associations between the prevalence of osteoporosis or osteopenia and TSH and FT4 stratified groups were assessed using a chisquare test. The odds ratios were analyzed using logistic regression. All analyses were done using PASW ver. 18.0 (SPSS Inc., Chicago, IL, USA) and SAS ver. 9.2 (SAS Institute, Cary, NC, USA). A P-value <0.05 was considered significant.
RESULTS
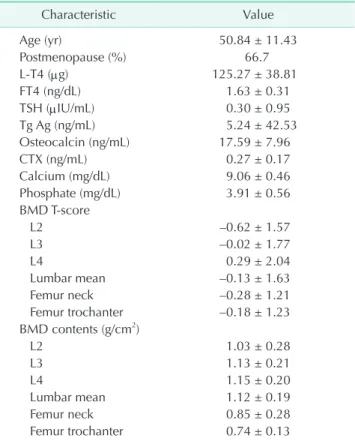
The clinical characteristics of the subjects are summarized in Table 1. Mean duration of LT4 treatment was 15.0 ± 5.7 years, and mean L-T4 dose was 125.27 ± 38.81 μg/day (range, 25–200 μg/day). Because most patient TSH levels were suppressed below 0.01 μU/mL, the subjects of group 1 defined by TSH ≤0.001 μIU/mL represented 61.17% of participants.
The subjects of group 2 defined by TSH >0.001 to ≤0.17 μIU/
mL and group 3 defined by TSH >0.17 μIU/mL accounted for 17% and 21% of patients, respectively. Mean BMD contents
Table 1. Characteristics of participants (n = 94)
Characteristic Value
Age (yr) 50.84 ± 11.43
Postmenopause (%) 66.7
L-T4 (μg) 125.27 ± 38.81
FT4 (ng/dL) 1.63 ± 0.31
TSH (μIU/mL) 0.30 ± 0.95
Tg Ag (ng/mL) 5.24 ± 42.53
Osteocalcin (ng/mL) 17.59 ± 7.96
CTX (ng/mL) 0.27 ± 0.17
Calcium (mg/dL) 9.06 ± 0.46
Phosphate (mg/dL) 3.91 ± 0.56
BMD T-score
L2 –0.62 ± 1.57
L3 –0.02 ± 1.77
L4 0.29 ± 2.04
Lumbar mean –0.13 ± 1.63
Femur neck –0.28 ± 1.21
Femur trochanter –0.18 ± 1.23 BMD contents (g/cm2)
L2 1.03 ± 0.28
L3 1.13 ± 0.21
L4 1.15 ± 0.20
Lumbar mean 1.12 ± 0.19
Femur neck 0.85 ± 0.28
Femur trochanter 0.74 ± 0.13 Values are presented as mean ± standard deviaion.
L-T4, levothyroxine; FT4, free T4; TSH, thyroid stimulating hormone; Tg Ag, thyroglobulin antigen; CTX, C-telopeptides of type I collagen; BMD, bone mineral density.
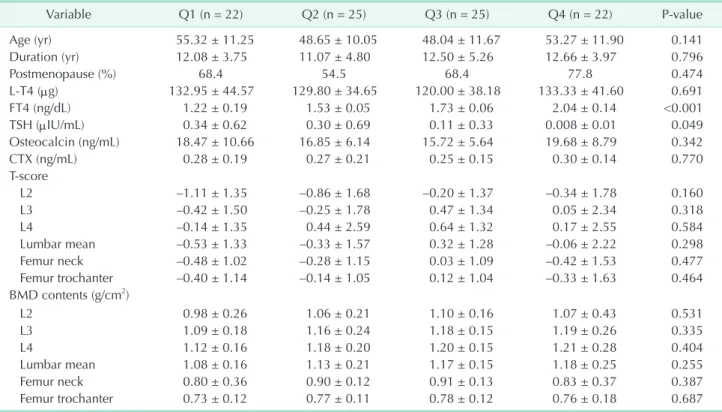
and T-scores for each group divided by TSH level did not differ significantly among groups (Table 2). Also, bone turnover markers and prevalence of osteoporosis and osteopenia were not different among groups (Table 2). For grouping by FT4 level, all subjects were divided into FT4 quartiles. The subjects of Q1, Q2, Q3, and Q4 were defined by FT4 ≤1.44 ng/dL, FT4 >1.44 through ≤1.63 ng/dL, FT4 >1.63 through ≤1.86 ng/dL, and FT4 >1.86 ng/dL, respectively. The relationship between BMD and prevalence of osteoporosis and osteopenia also did not show any differences among the four FT4 groups (Table 3). No differences existed between BMD and bone turnover markers among groups according to FT4 and TSH levels when subgroup analysis was performed according to state of menopause (data not shown). The odds ratios for risk of osteoporosis and osteopenia in groups 2 and 3 were not significant when compared to the reference group (group 1) (Table 4). The odds ratios for risk of osteoporosis and osteopenia in Q2, Q3, and Q4 by FT4 were not significantly larger than the reference group (Q 1) (Table 4). Also, the prevalence of osteoporosis and osteopenia was not different among groups (Table 4).
DISCUSSION
Although overt endogenous hyperthyroidism is known
to be an important risk factor of osteoporosis, osteopenia, and osteoporotic fracture [14-17], the clinical outcome of patients with subclinical hyperthyroidism, mild thyrotoxicosis associated with treatment of levothyroxine for hypothyroidism, or suppression therapy after thyroid cancer remains unclear [3- 8,18,19].
Abe et al. [20] reported that the TSH receptor is expressed in osteoblasts and osteoclasts. Also, TSH treatment could suppress bone turnover and prevent bone loss [20,21]. Two other in vitro studies reported that increased thyroid hormone-not decreased TSH level-induced bone loss [22,23]. Subsequently, although composited results also exist [24], the roles of thyroid hormone and TSH on BMD have been emphasized by clinicians.
Patients with differentiated thyroid cancer have been treated with a supraphysiological dose of levothyroxine for inhibition of tumor recurrence and metastasis after total or near total thyroidectomy. Clinical studies regarding the relationship between levothyroxine treatment and bone turnover markers or BMD do not show consistent results. Thus, the effect of high dose levothyroxine on bone metabolism remains controversial.
There have been no data about levothyroxine or BMD reported from patients with differentiated thyroid cancer in Korea. In our data, the prevalence of osteoporosis and osteopenia were not different between patients with different Table 2. BMD and prevalence of osteoporosis or osteopenia grouped by TSH level
Variable Group 1 (n = 58) Group 2 (n = 16) Group 3 (n = 20) P-value
Age (yr) 51.53 ± 11.70 50.68 ± 9.19 48.95 ± 12.56 0.688
Duration (yr) 11.75 ± 4.47 13.25 ± 4.04 11.28 ± 4.11 0.534
Postmenopause (%) 68.0 66.7 62.5 0.921
L-T4 (μg) 123.21 ± 36.57 131.25 ± 40.31 126.31 ± 45.24 0.763
FT4 (ng/dL) 1.74 ± 0.28 1.55 ± 0.26 1.38 ± 0.28 <0.001
TSH (μIU/mL) 0.001± 0.000 0.092 ± 0.054 1.373 ± 1.704 <0.001
Osteocalcin (ng/mL) 18.47 ± 7.39 16.89 ± 6.84 15.61 ± 10.11 0.359
CTX (ng/mL) 0.30 ± 0.18 0.23 ± 0.13 0.21 ± 0.18 0.120
BMD T-score
L2 –0.38 ± 1.58 –1.24 ± 1.17 –0.84 ± 1.74 0.120
L3 0.25 ± 1.73 –0.85 ± 1.72 –0.19 ± 1.79 0.077
L4 0.41 ± 1.70 0.00 ± 3.49 0.20 ± 1.38 0.755
Lumbar mean 0.10 ± 1.64 –0.95 ± 1.60 –0.17 ± 0.49 0.074
Femur neck –0.24 ± 1.23 –0.34 ± 1.28 –0.33 ± 1.13 0.943
Femur trochanter –0.16 ± 1.26 –0.23 ± 1.08 –0.17 ± 1.30 0.980
BMD contents (g/cm2)
L2 1.07 ± 0.31 1.05 ± 0.21 1.01 ± 0.28 0.779
L3 1.18 ± 0.21 1.09 ± 0.24 1.14 ± 0.18 0.297
L4 1.19 ± 0.20 1.11 ± 0.27 1.18 ± 0.14 0.355
Lumbar mean 1.16 ± 0.20 1.09 ± 0.24 1.13 ± 0.16 0.377
Femur neck 0.86 ± 0.25 0.83 ± 0.42 0.89 ± 0.12 0.752
Femur trochanter 0.75 ± 0.14 0.77 ± 0.15 0.76 ± 0.12 0.871
Values are presented as mean ± standard deviaion.
BMD, bone mineral density; TSH, thyroid stimulating hormone; L-T4, levothyroxine; FT4, free T4; Tg Ag, thyroglobulin antigen; CTX, C-telopeptides of type I collagen.
TSH suppression and different levels of FT4. Also, BMD and bone turnover markers were not different among the patient groups. However, the prevalence of osteoporosis and osteopenia did not show consistent change according to increase of TSH or decrease of FT4 level. Although we expected that the prevalence of osteoporosis and osteopenia would decrease incrementally according to TSH level, the results were contrary to our expectation. This may be due to the number of subjects: because a large number of patients were treated with
levothyroxine up to TSH level < 0.003 μIU/mL, the number of subjects with high TSH level and low FT4 level was relatively small. Therefore, the prevalence of osteoporosis and osteopenia among subjects with high TSH level and low FT4 level may seem improbably high. Because the purpose of TSH suppression is prevention of tumor recurrence, we attempted to suppress the TSH level below the undetectable level. But, for patients with old age, comorbid condition, or reduced adherence to medication due to thyrotoxic symptoms, we suppressed the Table 3. BMD and prevalence of osteoporosis or osteopenia grouped by FT4 quartile
Variable Q1 (n = 22) Q2 (n = 25) Q3 (n = 25) Q4 (n = 22) P-value
Age (yr) 55.32 ± 11.25 48.65 ± 10.05 48.04 ± 11.67 53.27 ± 11.90 0.141
Duration (yr) 12.08 ± 3.75 11.07 ± 4.80 12.50 ± 5.26 12.66 ± 3.97 0.796
Postmenopause (%) 68.4 54.5 68.4 77.8 0.474
L-T4 (μg) 132.95 ± 44.57 129.80 ± 34.65 120.00 ± 38.18 133.33 ± 41.60 0.691
FT4 (ng/dL) 1.22 ± 0.19 1.53 ± 0.05 1.73 ± 0.06 2.04 ± 0.14 <0.001
TSH (μIU/mL) 0.34 ± 0.62 0.30 ± 0.69 0.11 ± 0.33 0.008 ± 0.01 0.049
Osteocalcin (ng/mL) 18.47 ± 10.66 16.85 ± 6.14 15.72 ± 5.64 19.68 ± 8.79 0.342
CTX (ng/mL) 0.28 ± 0.19 0.27 ± 0.21 0.25 ± 0.15 0.30 ± 0.14 0.770
T-score
L2 –1.11 ± 1.35 –0.86 ± 1.68 –0.20 ± 1.37 –0.34 ± 1.78 0.160
L3 –0.42 ± 1.50 –0.25 ± 1.78 0.47 ± 1.34 0.05 ± 2.34 0.318
L4 –0.14 ± 1.35 0.44 ± 2.59 0.64 ± 1.32 0.17 ± 2.55 0.584
Lumbar mean –0.53 ± 1.33 –0.33 ± 1.57 0.32 ± 1.28 –0.06 ± 2.22 0.298
Femur neck –0.48 ± 1.02 –0.28 ± 1.15 0.03 ± 1.09 –0.42 ± 1.53 0.477
Femur trochanter –0.40 ± 1.14 –0.14 ± 1.05 0.12 ± 1.04 –0.33 ± 1.63 0.464
BMD contents (g/cm2)
L2 0.98 ± 0.26 1.06 ± 0.21 1.10 ± 0.16 1.07 ± 0.43 0.531
L3 1.09 ± 0.18 1.16 ± 0.24 1.18 ± 0.15 1.19 ± 0.26 0.335
L4 1.12 ± 0.16 1.18 ± 0.20 1.20 ± 0.15 1.21 ± 0.28 0.404
Lumbar mean 1.08 ± 0.16 1.13 ± 0.21 1.17 ± 0.15 1.18 ± 0.25 0.255
Femur neck 0.80 ± 0.36 0.90 ± 0.12 0.91 ± 0.13 0.83 ± 0.37 0.387
Femur trochanter 0.73 ± 0.12 0.77 ± 0.11 0.78 ± 0.12 0.76 ± 0.18 0.687
Values are presented as mean ± standard deviaion.
BMD, bone mineral density; FT4, free T4; L-T4, levothyroxine; TSH, thyroid stimulating hormone; Tg Ag, thyroglobulin antigen; CTX, C-telopeptides of type I collagen.
Table 4. Odds ratios of osteoporosis and osteopenia by regression analysis according to FT4 and TSH groups Variable
TSH group FT4 group
Group 1
(n = 58) Group 2
(n = 16) Group 3
(n = 20) P-value Q1
(n = 22) Q2
(n = 25) Q3
(n = 25) Q4
(n = 22) P-value Osteoporosis
Prevalence (%) 14.0 18.8 16.7 0.771 14.29 20.83 12.50 13.64 0.885
OR (95% CI) 1 1.41
(0.33–6.09) 1.23
(0.28–5.21) 1 1.57
(0.33–7.58) 0.85
(0.15–4.78) 0.94 (0.16–5.32) Osteopenia
Prevalence (%) 30.6 46.2 40.0 0.524 50.00 31.58 33.33 26.32 0.469
OR (95% CI) 1 1.93
(0.56–6.77) 1.51
(0.45–5.01) 1 0.46
(0.12–1.75) 0.50
(0.13–1.83) 0.36 (0.09–1.42) FT4, free T4; TSH, thyroid stimulating hormone; OR, odds ratio; CI, confidence interval.
TSH level to 0.1-2.0 μIU/mL. So, the majority of the subjects showed TSH levels of <0.003 μIU/mL.
The limitations of our study include small sample size and the fact that all participants were enrolled at a single center.
Also, we could not analyze daily calcium intake or exercise- both known to be influencing factors for osteoporosis and osteopenia. Finally, because we performed a cross-sectional study, we could not obtain the initial BMD and other markers that was the another limitation of our study. So, further prospective studies are needed.
In conclusion, we suggest that the degree of TSH suppression in thyroid cancer patients is not directly related to bone health, and long-term treatment with levothyroxine can be safely used in patients with total or subtotal thyroidectomy after thyroid cancer.
CONFLICTS OF INTEREST
No potential conflict of interest relevant to this article was reported.
1. Eriksen EF. Normal and pathological remodeling of human trabecular bone:
three dimensional reconstruction of the remodeling sequence in normals and in metabolic bone disease. Endocr Rev 1986;7:379-408.
2. Mosekilde L, Eriksen EF, Charles P.
Effects of thyroid hormones on bone and mineral metabolism. Endocrinol Metab Clin North Am 1990;19:35-63.
3. Diamond T, Nery L, Hales I. A therapeutic dilemma: suppressive doses of thyroxine significantly reduce bone mineral measurements in both premenopausal and postmenopausal women with thyroid carcinoma. J Clin Endocrinol Metab 1991;72:1184-8.
4. Florkowski CM, Brownlie BE, Elliot JR, Ayling EM, Turner JG. Bone mineral density in patients receiving suppressive doses of thyroxine for thyroid carcinoma.
N Z Med J 1993;106:443-4.
5. Franklyn JA, Betteridge J, Daykin J, Holder R, Oates GD, Parle JV, et al. Long-term thyroxine treatment and bone mineral density. Lancet 1992;340:9-13.
6. Hawkins F, Rigopoulou D, Papapietro K, Lopez MB. Spinal bone mass after long- term treatment with L-thyroxine in postmenopausal women with thyroid cancer and chronic lymphocytic thyroiditis.
Calcif Tissue Int 1994;54:16-9.
7. Pioli G, Pedrazzoni M, Palummeri E, Sianesi M, Del Frate R, Vescovi PP, et al.
Longitudinal study of bone loss after thyroidectomy and suppressive thyroxine
therapy in premenopausal women. Acta Endocrinol (Copenh) 1992;126:238-42.
8. Rosen HN, Moses AC, Garber J, Ross DS, Lee SL, Ferguson L, et al. Rando- mized trial of pamidronate in patients with thyroid cancer: bone density is not reduced by suppressive doses of thyro- xine, but is increased by cyclic intra- venous pamidronate. J Clin Endocrinol Metab 1998;83:2324-30.
9. Heijckmann AC, Huijberts MS, Geusens P, de Vries J, Menheere PP, Wolffenbuttel BH.
Hip bone mineral density, bone turnover and risk of fracture in patients on long- term suppressive L-thyroxine therapy for differentiated thyroid carcinoma. Eur J Endocrinol 2005;153:23-9.
10. Mikosch P, Jauk B, Gallowitsch HJ, Pipam W, Kresnik E, Lind P. Suppressive levothyroxine therapy has no significant influence on bone degradation in women with thyroid carcinoma: a comparison with other disorders affecting bone metabolism. Thyroid 2001;11:257-63.
11. Reverter JL, Colome E, Holgado S, Aguilera E, Soldevila B, Mateo L, et al. Bone mine- ral density and bone fracture in male patients receiving long-term suppressive levothyroxine treatment for differentiated thyroid carcinoma. Endocrine 2010;37:467- 72.
12. Sugitani I, Fujimoto Y. Effect of postoperative thyrotropin suppressive therapy on bone mineral density in patients with papillary thyroid carcinoma: a prospective controlled study. Surgery 2011;150:1250-7.
13. Quan ML, Pasieka JL, Rorstad O. Bone mineral density in well-differentiated thyroid cancer patients treated with suppressive thyroxine: a systematic overview of the literature. J Surg Oncol 2002;79:62-9.
14. Cummings SR, Nevitt MC, Browner WS, Stone K, Fox KM, Ensrud KE, et al. Risk factors for hip fracture in white women.
Study of Osteoporotic Fractures Research Group. N Engl J Med 1995;332:767-73.
15. Nicholls JJ, Brassill MJ, Williams GR, Bassett JH. The skeletal consequences of thyrotoxicosis. J Endocrinol 2012;213:209- 21.
16. Vestergaard P, Mosekilde L. Hyper- thyroidism, bone mineral, and fracture risk: a meta-analysis. Thyroid 2003;13:585- 93.
17. Svare A, Nilsen TI, Bjoro T, Forsmo S, Schei B, Langhammer A. Hyperthyroid levels of TSH correlate with low bone mineral density: the HUNT 2 study. Eur J Endocrinol 2009;161:779-86.
18. Leese GP, Jung RT, Guthrie C, Waugh N, Browning MC. Morbidity in patients on L-thyroxine: a comparison of those with a normal TSH to those with a suppressed TSH. Clin Endocrinol (Oxf) 1992;37:500-3.
19. Melton LJ 3rd, Ardila E, Crowson CS, O'Fallon WM, K hosla S. Fractures following thyroidectomy in women: a population-based cohort study. Bone 2000;27:695-700.
20. Abe E, Marians RC, Yu W, Wu XB, Ando T, Li Y, et al. TSH is a negative regulator of
REFERENCES
skeletal remodeling. Cell 2003;115:151-62.
21. Sampath TK, Simic P, Sendak R, Draca N, Bowe AE, O’Brien S, et al. Thyroid- stimulating hormone restores bone volume, microarchitecture, and strength in aged ovariectomized rats. J Bone Miner Res 2007;22:849-59.
22. Bassett JH, O’Shea PJ, Sriskantharajah
S, Rabier B, Boyde A, Howell PG, et al.
Thyroid hormone excess rather than thyrotropin deficiency induces osteo- porosis in hyperthyroidism. Mol Endo- crinol 2007;21:1095-107.
23. Bassett JH, Williams AJ, Murphy E, Boyde A, Howell PG, Swinhoe R, et al. A lack of thyroid hormones rather than excess
thyrotropin causes abnormal skeletal development in hypothyroidism. Mol Endocrinol 2008;22:501-12.
24. Tsai JA, Janson A, Bucht E, Kindmark H, Marcus C, Stark A, et al. Weak evidence of thyrotropin receptors in primary cultures of human osteoblast-like cells. Calcif Tissue Int 2004;74:486-91.