Baseline Cardiovascular Characteristics of Adult Patients with Chronic Kidney Disease from the KoreaN Cohort Study for
Outcomes in Patients With Chronic Kidney Disease (KNOW-CKD)
Cardiovascular disease (CVD) is the most common cause of death in patients with chronic kidney disease (CKD). We report the baseline cardiovascular characteristics of 2,238 participants by using the data of the KoreaN Cohort Study for Outcomes in Patients With Chronic Kidney Disease (KNOW-CKD) study. The cohort comprises 5 subcohorts according to the cause of CKD: glomerulonephritis (GN), diabetic nephropathy (DN), hypertensive nephropathy (HTN), polycystic kidney disease (PKD), and unclassified. The average estimated glomerular filtration rate (eGFR) was 50.5 ± 30.3 mL/min−1/1.73 m−2 and lowest in the DN subcohort. The overall prevalence of previous CVD was 14.4% in all patients, and was highest in the DN followed by that in the HTN subcohort. The DN subcohort had more adverse cardiovascular risk profiles (higher systolic blood pressure [SBP], and higher levels of cardiac troponin T, left ventricular mass index [LVMI], coronary calcium score, and brachial-ankle pulse wave velocity [baPWV]) than the other subcohorts. The HTN subcohort exhibited less severe cardiovascular risk profiles than the DN subcohort, but had more severe cardiovascular risk features than the GN and PKD subcohorts. All these
cardiovascular risk profiles were inversely correlated with eGFR. In conclusion, this study shows that the KNOW-CKD cohort exhibits high cardiovascular burden, as other CKD cohorts in previous studies. Among the subcohorts, the DN subcohort had the highest risk for CVD. The ongoing long-term follow-up study up to 10 years will further delineate cardiovascular characteristics and outcomes of each subcohort exposed to different risk profiles.
Keywords: Cardiovascular Disease; Chronic Kidney Disease; KNOW-CKD; Diabetes;
Hypertension; Polycystic Kidney Disease; Glomerulonephritis; Epidemiology Hyoungnae Kim,1 Tae-Hyun Yoo,1
Kyu Hun Choi,1 Kook-Hwan Oh,2 Joongyub Lee,3 Soo Wan Kim,4 Tae Hee Kim,5 Suah Sung,6 Seung Hyeok Han,1 and KNOW-CKD Group
1Department of Internal Medicine, Yonsei University College of Medicine, Seoul, Korea; 2Department of Internal Medicine, Seoul National University, Seoul, Korea; 3Medical Research Collaborating Center, Seoul National University Hospital and Seoul National University College of Medicine, Seoul, Korea; 4Department of Internal Medicine, Chonnam National University Medical School, Gwangju, Korea; 5Department of Internal Medicine, Inje University, Pusan Paik Hospital, Busan, Korea;
6Department of Internal Medicine, Eulji Medical Center, Eulji University, Seoul, Korea
Received: 19 September 2016 Accepted: 11 November 2016 Address for Correspondence:
Seung Hyeok Han, MD, PhD
Division of Nephrology, Department of Internal Medicine, Yonsei University College of Medicine, 50-1 Yonsei-ro, Seodaemun-gu, Seoul 03722, Korea
E-mail: [email protected]
Funding: This study was supported by the Research Program funded by the Korea Centers for Disease Control & Prevention (2011E3300300, 2012E3301100, 2013E3301600, 2013E3301601, 2013E3301602, and 2016E3300200).
https://doi.org/10.3346/jkms.2017.32.2.231 • J Korean Med Sci 2017; 32: 231-239
INTRODUCTION
The number of patients with end-stage renal disease (ESRD) requiring renal replacement therapy has been consistently in- creasing during the last decades and has become a socio-eco- nomic burden worldwide, including in Korea. A recent survey from the ESRD registry database of the Korean Society of Ne- phrology showed that the annual growth rate of dialysis-depen- dent ESRD patients was 9% during 2000–2013 (1). The preva- lence of predialysis chronic kidney disease (CKD) has been re- ported to be 10%–14% in North America and Japan (2-5) and 8.2%–13.8% in Korea (6,7).
Cardiovascular disease (CVD) is the most common cause of death in ESRD patients, and even in predialysis patients with CKD, the risk of CVD increases as the estimated glomerular fil-
tration rate (eGFR) decreases, particularly at a level < 60 mL/
min−1/1.73 m−2 (8). Of note, many CKD patients die of CVD be- fore they progress to ESRD (9). It is well known that CVD is high- ly prevalent in patients with CKD. The Chronic Renal Insuffi- ciency Cohort study reported that 34.0% of CKD patients in the United States had ischemic heart disease or heart failure (10).
Interestingly, cardiovascular prevalence and mortality can vary among different ethnic groups, and racial differences and so- cioeconomic disparities can determine the clinical outcomes of CKD patients (11-14). However, studies examining cardiovas- cular characteristics in Asian patients with CKD are scarce. In a Japanese cohort study, the prevalence of CVD was 25.6% (15);
however, only patients with an eGFR of 10–59 mL/min−1/1.73 m−2 were included, and thus patients with early stages of CKD were excluded. Recently, the Kidney Disease: Improving Global
232 http://jkms.org https://doi.org/10.3346/jkms.2017.32.2.231 Outcomes (KDIGO) guidelines adopted the importance of al-
buminuria and proposed a new CKD staging based on cause, glomerular filtration rate category, and albuminuria category (the CGA staging system) (16). In fact, albuminuria is an impor- tant risk factor of CVD in the general population (17), and the risk of cardiovascular mortality significantly increases in patients with a urine albumin-creatinine ratio of > 30 mg/g with a pre- served eGFR of ≥ 60 mL/min/1.73 m2 (18).
With this background, the KoreaN Cohort Study for Outcome in Patients With Chronic Kidney Disease (KNOW-CKD) was initiated in 2011. The cohort comprises 5 subcohorts and en- compasses early stages of CKD. The main purposes of the KNOW- CKD study are to define the clinical characteristics of Korean CKD patients, and to identify factors associated with kidney dis- ease progression and mortality. This study particularly details the baseline cardiovascular characteristics of those patients.
MATERIALS AND METHODS Study protocol and population
The KNOW-CKD study is a nationwide prospective cohort study involving 9 tertiary-care general hospitals: Seoul National Uni- versity Hospital, Seoul National University Bundang Hospital, Yonsei University Severance Hospital, Kangbuk Samsung Med- ical Center, Seoul St. Mary’s Hospital, Gil Hospital, Eulji General Hospital, Chonnam National University Hospital, and Pusan Paik Hospital. The rationale, design, inclusion criteria, and meth- od of the study were described in detail elsewhere (19) (NCT- 01630486 at http://www.clinicaltrials.gov). Between 2011 and 2015, information of the study had been provided for the pati- ents who were treated in each center. Informed consent encom- passed study’s purpose, duration, procedures, alternatives, risks, benefits, and subject’s rights to withdraw of the study at any time.
As a result, 2,341 participants who voluntarily provided informed consent were enrolled. We additionally excluded 103 partici- pants who violated the inclusion criteria, or had no data of iso- tope dilution mass spectrometry (IDMS)-calibrated creatinine.
Therefore, a total of 2,238 participants were finally included in the study. The CKD stages were classified according to eGFR calculated by using the Modification of Diet in Renal Disease equation (20).
All subjects were categorized into 5 subcohorts according to the etiology of CKD: glomerulonephritis (GN), diabetic nephrop- athy (DN), hypertensive nephropathy (HTN), and polycystic kidney disease (PKD). The patients with CKD of unknown ori- gin was classified into ‘Unclassified’ group. The definition and diagnosis were defined on the basis of pathologic results in sub- jects who underwent kidney biopsy. Otherwise, clinical diagno- sis was made with caution by nephrologists based on demogra- phic, clinical, and laboratory data. The details of the definition of each disease category were described elsewhere (19).
Data collection
Baseline socio-demographic characteristics; clinical informa- tion such as comorbid diseases, family history, smoking status, and medication history; and anthropometric data such as height, weight, and waist-to-hip ratio were collected at enrollment. In addition, blood pressure was measured by using an electronic sphygmomanometer after 5 minutes of seated rest. The pres- ence of CVD was defined as a history of myocardial infarction (MI), coronary revascularization, coronary artery bypass graft, peripheral arterial disease, ischemic or hemorrhagic cerebro- vascular disease, or arrhythmia. To assess cardiovascular risk, the coronary arterial calcification (CAC) score, left ventricular mass index (LVMI), and pulse wave velocity (PWV) were mea- sured at each center. CAC and LVMI were determined by using multidetector computed tomography (CT) and 2-dimensional echocardiography, respectively. LVMI was calculated from the left ventricular mass divided by the body surface area. Left ven- tricular geometry was categorized into 4 groups according to relative wall thickness and LVMI: normal, concentric remodel- ing, eccentric left ventricular hypertrophy (LVH), and concen- tric LVH (21). PWV was defined as the calculated distance be- tween the arm and leg from the height divided by the time de- lay between proximal and distal foot waveforms obtained from plethysmographic and oscillometric sensors (brachial-ankle PWV [baPWV]). Blood samples were obtained at each center, and 10 mL of whole blood in a serum separation tube was cen- trifuged within 1 hour for serum separation and sent to a cen- tral laboratory. First-voided urine samples (15 mL) were col- lected to measure urine albumin, protein, and creatinine. Pa- tients were classified into 3 groups according to urine albumin to creatinine ratio (ACR): ACR < 30 mg/g for A1, 30 ≤ ACR < 300 mg/g for A2, ACR ≥ 300 mg/g for A3.
Statistical analysis
Continuous variables are expressed as mean ± standard devia- tion, and compared with 1-way analysis of variance. To compare variables between 2 groups, post-hoc analysis was performed with Bonferroni analysis. The normality of the distribution of parameters was analyzed by using the Kolmogorov-Smirnov test. Nonparametric variables are expressed as median and rang- es (mininum to maximum), and compared by using the Krus- kal-Wallis test. Categorical variables are expressed as numbers and percentages, and compared by using χ2 test. Univariate cor- relation analysis was performed with Spearman correlation anal- ysis to assess the relationship between eGFR and other param- eters. Statistical significance was defined as P < 0.05, and all anal- yses were conducted with SPSS version 20.0 (IBM Corporation, Armonk, NY, USA).
Ethics statement
The study was carried out in accordance with the principles of
the Declaration of Helsinki. The present study protocol was re- viewed and approved by the Institutional Review Boards at each participating center (IRB approval number of Yonsei University Severance Hospital: 4-2011-0163). Written informed consent was obtained from all participants before enrollment. The protocol summary was also registered at ClinicalTrials.gov (NCT01630486).
RESULTS
Baseline characteristics
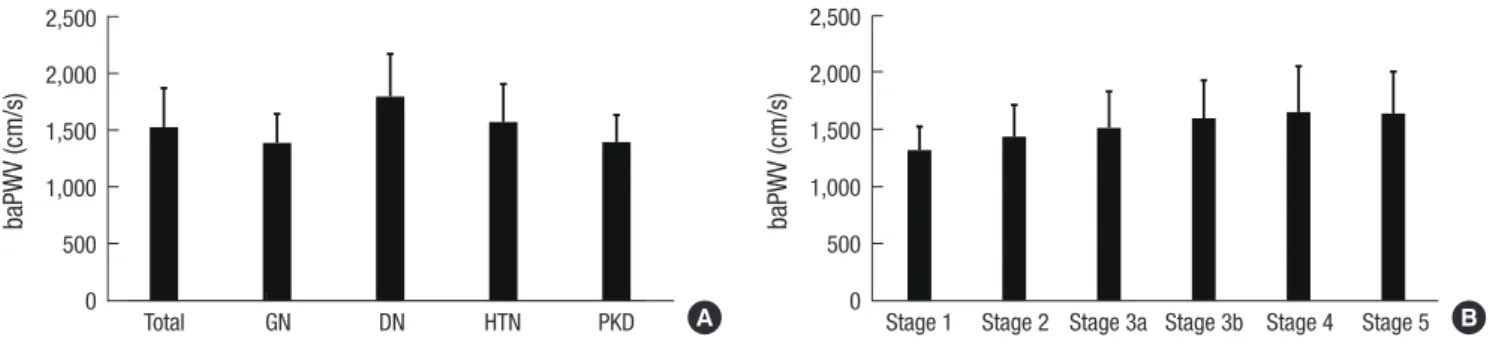
The baseline characteristics of the patients according to subco- horts are presented in Table 1. We compared 4 subcohorts whose etiology of CKD had been confirmed, and present baseline char-
Table 1. Baseline characteristics and prevalence of CVD according to the etiology of CKD
Characteristics Subcohort
Total P value
DN HTN GN PKD
Participants 519 409 810 364 2,238
Age, yr 59.3 ± 9.4 59.6 ± 10.8 49.8 ± 12.1 46.9 ± 10.6 53.7 ± 12.2 < 0.001
Female 162 (31.2) 114 (27.9) 359 (44.3) 180 (49.5) 869 (38.8) < 0.001
Hypertension 513 (99.8) 409 (100.0) 785 (96.9) 314 (86.3) 2,150 (96.1) < 0.001
DM 519 (100.0) 72 (17.6) 70 (8.6) 12 (3.3) 755 (33.7) < 0.001
Current smoker 84 (16.4) 71 (17.4) 115 (14.2) 55 (15.1) 349 (15.7) < 0.001
Height, cm 164.5 ± 8.2 164.8 ± 8.2 164.3 ± 8.2 166.1 ± 9.1 164.7 ± 8.4 0.040
Weight, kg 68.4 ± 11.4 68.4 ± 12.3 65.6 ± 11.7 65.2 ± 12.0 66.8 ± 11.9 < 0.001
BMI, kg/m2 25.2 ± 3.2 25.1 ± 3.5 24.2 ± 3.3 23.5 ± 3.0 24.6 ± 3.4 < 0.001
Waist-to-hip ratio 0.93 ± 0.06 0.91 ± 0.06 0.88 ± 0.07 0.88 ± 0.06 0.90 ± 0.07 < 0.001
SBP, mmHg 134.3 ± 18.5 127.8 ± 15.9 123.4 ± 14.2 128.3 ± 13.3 127.8 ± 16.2 < 0.001
DBP, mmHg 75.7 ± 11.7 77.7 ± 11.5 75.6 ± 10.1 81.0 ± 10.4 77.0 ± 11.1 < 0.001
CKD stages < 0.001
Stage 1 13 (2.5) 11 (2.7) 131 (16.2) 94 (25.8) 265 (11.8)
Stage 2 44 (8.5) 48 (11.7) 180 (22.2) 118 (32.4) 419 (18.7)
Stage 3a 72 (13.9) 95 (23.2) 163 (20.1) 52 (14.3) 403 (18.0)
Stage 3b 131 (25.2) 112 (27.4) 158 (19.5) 45 (12.4) 484 (21.6)
Stage 4 198 (38.2) 118 (28.9) 138 (17.0) 42 (11.5) 522 (23.3)
Stage 5 61 (11.8) 25 (6.1) 40 (4.9) 13 (3.6) 145 (6.5)
CVD
Any CVD 130 (25.0) 88 (21.5) 56 (6.9) 25 (6.9) 322 (14.4) < 0.001
Coronary disease 60 (11.6) 32 (7.8) 14 (1.7) 2 (0.5) 118 (5.3) < 0.001
MI 18 (3.5) 9 (2.2) 6 (0.7) 1 (0.3) 36 (1.6) < 0.001
Stroke 51 (9.8) 38 (9.3) 19 (2.3) 21 (5.8) 135 (6.0) < 0.001
PAD 32 (6.2) 20 (4.9) 13 (1.6) 1 (0.3) 78 (3.5) < 0.001
Arrhythmia 16 (3.1) 18 (4.4) 18 (2.2) 2 (0.5) 56 (2.5) 0.006
Urine ACR, mg/g < 0.001
A1 ( < 30) 21 (4.3) 101 (26.1) 44 (5.8) 151 (42.9) 336 (15.9)
A2 (30–300) 101 (20.5) 126 (32.6) 214 (28.4) 169 (48.0) 641 (30.4)
A3 ( ≥ 300) 370 (75.2) 160 (41.3) 496 (65.8) 32 (9.1) 1,134 (53.7)
Creatinine, mg/dL 2.4 ± 1.3 2.0 ± 1.2 1.6 ± 1.0 1.3 ± 0.9 1.8 ± 1.1 < 0.001
Cystatin C, mg/L 2.3 ± 1.0 1.9 ± 0.9 1.6 ± 0.9 1.3 ± 0.7 1.8 ± 0.9 < 0.001
eGFR, mL/min/1.73 m2 35.2 ± 20.6 40.8 ± 21.2 56.9 ± 31.8 68.1 ± 33.3 50.5 ± 30.3 < 0.001
Total cholesterol, mg/dL 178.9 ± 33.5 167.3 ± 43.7 169.3 ± 35.6 178.4 ± 39.0 178.9 ± 33.5 < 0.001
LDL cholesterol, mg/dL 91.0 ± 33.9 94.1 ± 30.8 100.1 ± 32.4 101.8 ± 27.1 96.9 ± 31.8 < 0.001
HDL cholesterol, mg/dL 43.6 ± 14.1 46.7 ± 14.1 51.5 ± 15.8 54.6 ± 14.0 49.2 ± 15.4 < 0.001
Hemoglobin, g/dL 11.7 ± 1.8 13.3 ± 2.0 13.2 ± 1.9 13.2 ± 1.8 12.8 ± 2.0 < 0.001
Albumin, g/dL 4.0 ± 0.5 4.3 ± 0.3 4.1 ± 0.4 4.4 ± 0.3 4.2 ± 0.4 < 0.001
Phosphorus, mg/dL 4.0 ± 0.8 3.6 ± 0.6 3.6 ± 0.6 3.6 ± 0.6 3.7 ± 0.7 < 0.001
Troponin T, ng/mL 0.029 ± 0.031 0.015 ± 0.015 0.01 ± 0.009 0.007 ± 0.004 0.015 ± 0.019 < 0.001
hsCRP, mg/L* 0.7 (0.1–52.7) 0.8 (0.0–67.0) 0.5 (0.0–68.0) 0.4 (0.0–35.3) 0.6 (0.0–68.0) < 0.001
Intact PTH, pg/mL* 63.4 (14.2–1,078.0) 52.3 (19.1–660.3) 44.4 (7.0–552.3) 56.3 (21.8–414.9) 51.0 (7.0–1,078.0) < 0.001
ARB 419 (80.7) 318 (77.8) 669 (82.6) 270 (74.2) 1,785 (79.8) 0.025
ACEi 63 (12.1) 33 (8.1) 123 (15.2) 18 (4.9) 249 (11.1) < 0.001
CCB 295 (56.8) 218 (53.3) 216 (26.7) 120 (33.0) 906 (40.5) < 0.001
Statin 329 (63.4) 234 (57.2) 419 (51.7) 98 (26.9) 1,152 (51.5) < 0.001
Values are presented as number (%) or mean ± standard deviation.
CVD = cardiovascular disease, CKD = chronic kidney disease, DN = diabetic nephropathy, HTN = hypertensive nephropathy, GN = glomerulonephritis, PKD = polycystic kidney disease, BMI = body mass index, DM = diabetes mellitus, SBP = systolic blood pressure, DBP = diastolic blood pressure, MI = myocardial infarction, PAD = peripheral arterial disease, ACR = albumin-to-creatinine ratio, eGFR = estimated glomerular filtration rate, LDL = low-density lipoprotein, HDL = high-density lipoprotein hsCRP = high-sensitive C-reactive protein, PTH = parathyroid hormone, ARB = angiotensin receptor blocker, ACEi = angiotensin converting enzyme inhibitor, CCB = calcium channel blocker.
*Data are expressed as median and ranges (minimum to maximum).
234 http://jkms.org https://doi.org/10.3346/jkms.2017.32.2.231 acteristics of unclassified subcohort in Supplementary Table 1.
The mean age was 53.7 ± 12.2 years, and patients in the DN and HTN subcohorts were older than those in the other 2 subcohorts (P < 0.001). Almost all patients (96.1%) had hypertension, and the mean systolic blood pressure (SBP) and diastolic blood pres- sure (DBP) were 127.8 ± 16.2 and 77.0 ± 11.1 mmHg, respec-
tively. The mean level of random urine albumin-to-creatinine ratio was 901.4 mg/g. The mean creatinine level and eGFR of the entire cohort were 1.8 ± 1.1 mg/dL and 50.5 ± 30.3 mL/min−1/ 1.73 m−2, respectively. The HTN subcohort had more male pa- tients and current smokers than the other subcohorts. The DN subcohort had higher body mass index (BMI) and lower levels
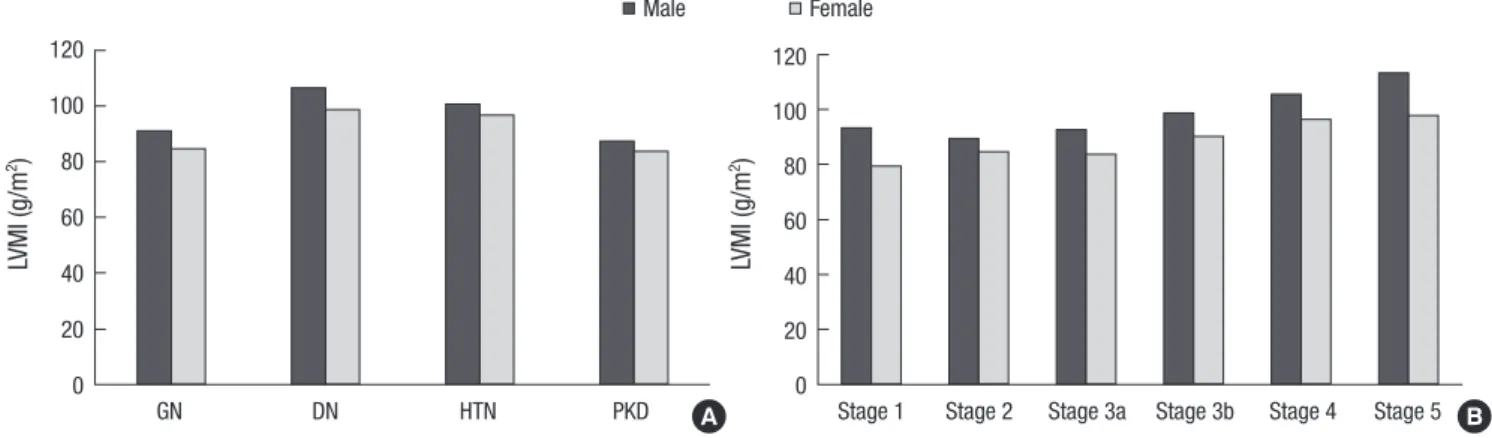
Table 2. Baseline characteristics and prevalence of CVD according to CKD stages
Characteristics CKD stage P for
trend
Stage 1 Stage 2 Stage 3a Stage 3b Stage 4 Stage 5
Participants 265 419 403 484 522 145
Age, yr 43.2 ± 11.7 50.5 ± 11.7 54.9 ± 11.7 56.7 ± 11.0 57.2 ± 11.1 55.7 ± 11.4 < 0.001
Female 138 (52.1) 142 (33.9) 127 (31.5) 177 (36.6) 208 (39.8) 77 (53.1) 0.720
Hypertension 225 (84.9) 399 (95.2) 395 (98.0) 475 (98.1) 515 (98.7) 143 (98.6) < 0.001
DM 40 (15.1) 87 (20.8) 119 (29.5) 192 (39.7) 249 (47.7) 68 (46.9) < 0.001
Current smoker 42 (15.8) 69 (16.5) 78 (19.4) 66 (13.6) 76 (14.6) 18 (12.4) 0.120
Height, cm 165.2 ± 8.2 166.6 ± 8.6 165.5 ± 8.2 164.0 ± 8.0 163.6 ± 8.3 161.5 ± 8.5 < 0.001
Weight, kg 66.3 ± 13.4 68.7 ± 12.5 68.0 ± 12.0 66.7 ± 10.4 65.7 ± 11.6 63.5 ± 11.5 < 0.001
BMI, kg/m2 24.2 ± 3.8 24.6 ± 3.4 24.7 ± 3.3 24.8 ± 3.2 24.4 ± 3.4 24.2 ± 3.4 0.840
Waist-to-hip ratio 0.88 ± 0.07 0.89 ± 0.07 0.90 ± 0.06 0.91 ± 0.08 0.91 ± 0.06 0.90 ± 0.06 < 0.001
SBP, mmHg 126.6 ± 14.3 126.4 ± 14.7 126.5 ± 15.7 126.8 ± 15.5 129.7 ± 17.6 135.1 ± 20.0 < 0.001
DBP, mmHg 78.6 ± 10.5 78.3 ± 11.3 76.6 ± 10.3 76.0 ± 10.5 76.4 ± 12.1 77.4 ± 11.8 0.003
Primary kidney disease < 0.001
GN 131 (49.4) 180 (43.0) 163 (40.4) 158 (32.6) 138 (26.4) 40 (27.6)
DN 13 (4.9) 44 (10.5) 72 (17.9) 131 (27.1) 198 (37.9) 61 (42.1)
HTN 11 (4.2) 48 (11.5) 95 (23.6) 112 (23.1) 118 (22.6) 25 (17.2)
PKD 94 (35.5) 118 (28.2) 52 (12.9) 45 (9.3) 42 (8.0) 13 (9.0)
Unclassified 16 (6.0) 29 (6.9) 21 (5.2) 38 (7.9) 26 (5.0) 6 (4.1)
CVD
Any CVD 15 (5.7) 38 (9.1) 59 (14.6) 76 (15.7) 110 (21.1) 24 (16.6) < 0.001
Coronary disease 2 (0.8) 10 (2.4) 17 (4.2) 33 (6.8) 48 (9.2) 8 (5.5) < 0.001
MI 0 (0.0) 3 (0.7) 5 (1.2) 12 (2.5) 14 (2.7) 2 (1.4) 0.002
Stroke 6 (2.3) 15 (3.6) 28 (6.9) 32 (6.6) 45 (8.6) 9 (6.2) < 0.001
PAD 3 (1.1) 7 (1.7) 18 (4.5) 16 (3.3) 29 (5.6) 5 (3.4) 0.002
Arrhythmia 5 (1.9) 9 (2.1) 11 (2.7) 9 (1.9) 19 (3.6) 3 (2.1) 0.280
Urine ACR, mg/g < 0.001
A1 ( < 30) 79 (31.1) 114 (29.2) 65 (17.2) 51 (11.1) 23 (4.7) 4 (2.9)
A2 (30–300) 80 (31.5) 124 (31.7) 130 (34.3) 154 (33.6) 129 (26.3) 24 (17.3)
A3 ( ≥ 300) 95 (37.4) 153 (39.1) 184 (48.5) 253 (55.2) 338 (69.0) 111 (79.9)
Creatinine, mg/dL 0.7 ± 0.1 1.0 ± 0.2 1.3 ± 0.2 1.7 ± 0.3 2.7 ± 0.6 4.8 ± 1.6 < 0.001
Cystatin C, mg/L 0.8 ± 0.1 1.0 ± 0.2 1.3 ± 0.2 1.8 ± 0.3 2.6 ± 0.5 3.9 ± 0.7 < 0.001
eGFR, mL/min/1.73 m2 110.9 ± 20.6 73.3 ± 8.6 52.2 ± 4.3 37.3 ± 4.2 23.1 ± 4.4 11.8 ± 2.4 < 0.001
Total cholesterol, mg/dL 185.3 ± 38.1 179.5 ± 35.7 173.3 ± 35.9 170.6 ± 39.3 169.6 ± 42.3 168.9 ± 42.8 < 0.001 LDL cholesterol, mg/dL 107.3 ± 33.1 102.3 ± 30.5 96.5 ± 30.4 92.4 ± 30.2 92.7 ± 32.4 93.7 ± 34.4 < 0.001 HDL cholesterol, mg/dL 56.9 ± 15.6 52.6 ± 15.6 49.6 ± 14.1 47.2 ± 14.3 45.3 ± 14.7 45.3 ± 16.6 < 0.001
Hemoglobin, g/dL 14.0 ± 1.5 14.1 ± 1.7 13.5 ± 1.9 12.7 ± 1.8 11.5 ± 1.5 10.5 ± 1.2 < 0.001
Albumin, g/dL 4.3 ± 0.4 4.3 ± 0.4 4.2 ± 0.4 4.2 ± 0.4 4.0 ± 0.5 3.9 ± 0.4 < 0.001
Phosphorus, mg/dL 3.5 ± 0.5 3.5 ± 0.6 3.5 ± 0.5 3.6 ± 0.6 3.9 ± 0.7 4.7 ± 0.8 < 0.001
Troponin T, ng/mL 0.006 ± 0.003 0.008 ± 0.006 0.011 ± 0.007 0.015 ± 0.014 0.025 ± 0.027 0.032 ± 0.033 < 0.001 hsCRP, mg/L* 0.4 (0.0–68.0) 0.6 (0.0–32.0) 0.6 (0.0–60.2) 0.6 (0.0–54.5) 0.8 (0.1–67.0) 0.7 (0.1–26.1) 0.001 Intact PTH, pg/mL* 37.3 (9.7–95.6) 38.4 (7.0–140.3) 44.6 (8.4–225.0) 53.5 (14.0–184.7) 87.8 (14.1–590.9) 175.1 (37.6–1,078.0) < 0.001
ARB 186 (70.2) 344 (82.1) 330 (81.9) 398 (82.2) 411 (78.7) 116 (80.0) 0.120
ACEi 33 (12.5) 51 (12.2) 53 (13.2) 49 (10.1) 49 (9.4) 14 (9.7) 0.060
CCB 56 (21.1) 133 (31.7) 150 (37.2) 212 (43.8) 268 (51.3) 87 (60.0) < 0.001
Statin 92 (34.7) 193 (46.1) 224 (55.6) 285 (58.9) 277 (53.1) 81 (55.9) < 0.001
Data are expressed as number (%) or mean ± standard deviation.
CVD = cardiovascular disease, CKD = chronic kidney disease, BMI = body mass index, DM = diabetes mellitus, SBP = systolic blood pressure, DBP = diastolic blood pressure, GN = glomerulonephritis, DN = diabetic nephropathy, HTN = hypertensive nephropathy, PKD = polycystic kidney disease, MI = myocardial infarction, PAD = peripheral arterial disease, ACR = albumin-to-creatinine ratio, eGFR = estimated glomerular filtration rate, LDL = low-density lipoprotein, HDL = high-density lipoprotein, hsCRP = high-sensitive C-reactive protein, PTH = parathyroid hormone, ARB = angiotensin receptor blocker, ACEi = angiotensin converting enzyme inhibitor, CCB = calcium channel blocker.
*Data are expressed as median and ranges (minimum to maximum).
http://jkms.org 235
https://doi.org/10.3346/jkms.2017.32.2.231
of eGFR, cholesterol, hemoglobin, and albumin than the other subcohorts (P < 0.001 for all). Of the entire cohort, 85.2% had been treated with an angiotensin receptor blocker (79.8%) or an angiotensin-converting enzyme inhibitor (11.1%) and 127 (5.7%) patients had taken dual blockades.
The baseline characteristics according to CKD stages are pre- sented in Table 2. The prevalences of hypertension, diabetes, and macroalbuminuria were significantly higher in patients with advanced stages of CKD (P < 0.001 for all). These groups were older and included more female patients (P < 0.001, re- spectively). In addition, the serum levels of cholesterol, hemo- globin, and albumin were lower, whereas those of phosphorus, high-sensitive C-reactive protein (hsCRP), and intact parathy- roid hormone were higher across the CKD stages (P = 0.001 for hsCRP, P < 0.001 for the others).
Cardiovascular risk profiles by 4 subcohorts
The prevalence of any CVD in the entire cohort was 14.4% (Ta- ble 1). A total of 1.6% and 6.0% patients had prior history of MI and stroke, respectively. The overall prevalence of CVD was higher in the DN and HTN subcohorts than in the GN and PKD subcohorts. Approximately 5% of patients had coronary disease, and the prevalence was significantly higher in the DN subco- hort (11.6%). The DN subcohort also had higher levels of SBP
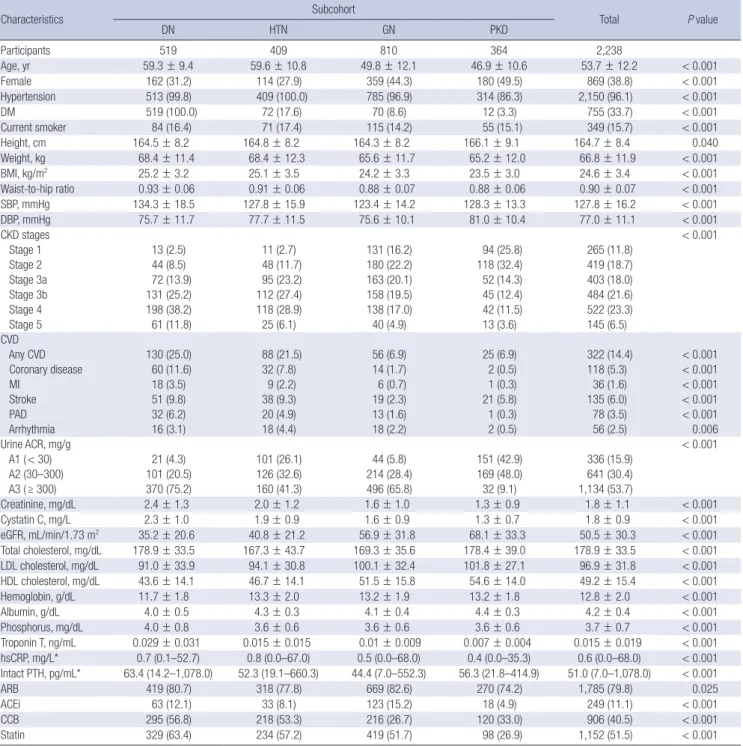
(P < 0.001 for each subcohort), and cardiac troponin T (P < 0.001 for each subcohort) than the other subcohorts. To further delin- eate cardiovascular risk, arterial stiffness, CAC score, and left ventricular geometry were evaluated. Compared with the other subcohorts, the DN subcohort had significantly higher baPWV (Fig. 1A) (1,803.8 ± 375.2 cm/s, P < 0.001 for each subcohort).
When the CAC score was grouped into 4 categories based on the cutoff values of 0, 1–400, 401–1,000, and > 1,000, the preva- lence of each group was as follows: 47.7% for the 0 group, 39.5%
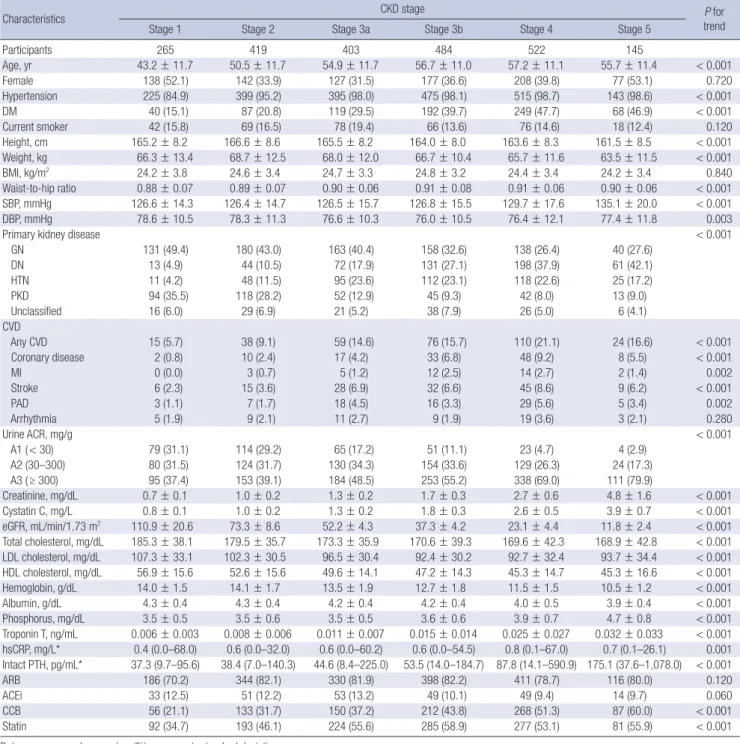
for the 1–400 group, 7.1% for the 401–1,000 group, and 5.7% for the > 1,000 group (Fig. 2A). The DN subcohort had significantly higher CAC scores (495.5 ± 826.9, P < 0.001 for each subcohort) and more patients with a CAC score of > 1,000 than the other subcohorts (15.8%). The mean LVMI was 88.5 ± 23.4 g/m2 in fe- male patients and 97.3 ± 25.9 g/m2 in male patients (Fig. 3). The level of LVMI was significantly higher in the DN subcohort than in the GN and PKD subcohorts (103.0 ± 25.0 g/m2, P < 0.001 for each subcohort). In addition, both eccentric LVH and concen- tric LVH were more predominant in the DN subcohort (eccen- tric LVH, 16.4%; concentric LVH, 21.3%) than in the GN and PKD subcohorts (Fig. 4, P < 0.001 for each subcohort). All these adverse features were also observed in the HTN subcohort. The degree of cardiovascular risk profiles was less severe than that in the DN subcohort, but worse than those in the other 2 subcohorts.
Fig. 1. baPWV of the participants. (A) baPWV according to the etiology of CKD. (B) baPWV according to the CKD stages.
baPWV = brachial-ankle pulse wave velocity, CKD = chronic kidney disease, GN = glomerulonephritis, DN = diabetic nephropathy, HTN = hypertensive nephropathy, PKD = polycystic kidney disease.
0 500 1000 1500 2000 2500
Total GN DN HTN PKD
baPWV (cm/s)
A
B
baPWV (cm/s)
Total GN DN HTN PKD
2,500 2,000 1,500 1,000 500 0
0 500 1000 1500 2000 2500
Total GN DN HTN PKD
baPWV (cm/s)
A
B
baPWV (cm/s)
Stage 1 Stage 2 Stage 3a Stage 3b Stage 4 Stage 5 2,500
2,000 1,500 1,000 500
A 0 B
Fig. 2. Categories of CAC score in the participants. (A) CAC according to the etiology of CKD. (B) CAC according to CKD stages.
CAC = coronary arterial calcium, CKD = chronic kidney disease, GN = glomerulonephritis, DN = diabetic nephropathy, HTN = hypertensive nephropathy, PKD = polycystic kid- ney disease.
0%
20%
40%
60%
80%
100%
Total GN DN HTN PKD
Percent of patients
0%
20%
40%
60%
80%
100%
Percent of patients
A
B
Percent of patients (%)
Total GN DN HTN PKD
100 80 60 40 20 0
0%
20%
40%
60%
80%
100%
Total GN DN HTN PKD
Percent of patients
0%
20%
40%
60%
80%
100%
Stage1 Stage2 Stage3a Stage3b Stage4 Stage5
Percent of patients
0 1~400 401~1000 >1000
A
B
Percent of patients (%)
Stage 1 Stage 2 Stage 3a Stage 3b Stage 4 Stage 5 100
80 60 40 20
A 0 B
0%
20%
40%
60%
80%
100%
Total GN DN HTN PKD
Percent of patients
0%
20%
40%
60%
80%
100%
Stage1 Stage2 Stage3a Stage3b Stage4 Stage5
Percent of patients
0 1~400 401~1000 >1000
A
B
0 0%
20%
40%
60%
80%
100%
Total GN DN HTN PKD
Percent of patients
0%
20%
40%
60%
80%
100%
Stage1 Stage2 Stage3a Stage3b Stage4 Stage5
Percent of patients
0 1~400 401~1000 >1000
A
B
1-400 0%
20%
40%
60%
80%
100%
Total GN DN HTN PKD
Percent of patients
0%
20%
40%
60%
80%
100%
Stage1 Stage2 Stage3a Stage3b Stage4 Stage5
Percent of patients
0 1~400 401~1000 >1000
A
B
401-1,000 0%
20%
40%
60%
80%
100%
Total GN DN HTN PKD
Percent of patients
0%
20%
40%
60%
80%
100%
Stage1 Stage2 Stage3a Stage3b Stage4 Stage5
Percent of patients
0 1~400 401~1000 >1000
A
B
> 1,000
Kim H, et al. • Cardiovascular Characteristics in the KNOW-CKD Cohort
236 http://jkms.org https://doi.org/10.3346/jkms.2017.32.2.231 Cardiovascular risk profiles according to CKD stages
We also compared the cardiovascular risk profiles according to CKD stages. The prevalence of CVD increased as the CKD stage became more advanced (Table 2). In addition, SBP and the lev- els of hsCRP and cardiac troponin T were significantly higher in patients with advanced stages of CKD. Furthermore, the baPWV, CAC score, and LVMI were also higher across the CKD stages.
When the relation between eGFR and these parameters was as- sessed by using the Spearman correlation coefficient, eGFR was found to be inversely correlated with hsCRP (r = −0.129,
P < 0.001), cardiac troponin T (r = −0.637, P < 0.001), baPWV (r = −0.340, P < 0.001), CAC score (r = −0.245, P < 0.001), and LVMI (r = −0.272, P < 0.001) (Table 3). In subgroup analyses, baPWV (r = −0.111, P = 0.02), troponin T (r = −0.273, P < 0.001), hsCRP (r = −0.098, P = 0.030), and LVMI (r = −0.267, P < 0.001) was correlated with eGFR in DN subgroup, whereas LVMI (r =
−0.187, P < 0.001) was only correlated with eGFR in HTN sub- group. We also examined the relationship between these pa- rameters and urinary ACR (Table 4). In all subjects, cardiovas- cular parameters except hsCRP were significantly correlated Fig. 3. LVMI of the participants. (A) LVMI according to the etiology of CKD. (B) LVMI according to CKD stages.
LVMI = left ventricular mass index, CKD = chronic kidney disease, GN = glomerulonephritis, DN = diabetic nephropathy, HTN = hypertensive nephropathy, PKD = polycystic kidney disease.
Male Female
LVMI (g/m2)
GN DN HTN PKD
120 100 80 60 40 20 0
LVMI (g/m2)
Stage 1 Stage 2 Stage 3a Stage 3b Stage 4 Stage 5 120
100 80 60 40 20 0
A B
Fig. 4. LV geometry of the participants. (A) LV geometry according to the etiology of CKD. (B) LV geometry according to CKD stages.
LV = Left ventricular, CKD = chronic kidney disease, GN = glomerulonephritis, DN = diabetic nephropathy, HTN = hypertensive nephropathy, PKD = polycystic kidney disease.
0%
20%
40%
60%
80%
Total GN DN HTN PKD
Percent of patients
0%
20%
40%
60%
80%
100%
Stage1 Stage2 Stage3a Stage3b Stage4 Stage5
Percent of patients
Normal Concentric remodeling Eccentric LVH Concentric LVH
B
Normal
0%
20%
40%
60%
80%
Total GN DN HTN PKD
Percent of patients
0%
20%
40%
60%
80%
100%
Stage1 Stage2 Stage3a Stage3b Stage4 Stage5
Percent of patients
Normal Concentric remodeling Eccentric LVH Concentric LVH
B
Concentric remodeling
0%
20%
40%
60%
80%
Total GN DN HTN PKD
Percent of patients
0%
20%
40%
60%
80%
100%
Stage1 Stage2 Stage3a Stage3b Stage4 Stage5
Percent of patients
Normal Concentric remodeling Eccentric LVH Concentric LVH
B
Eccentric LVH
0%
20%
40%
60%
80%
Total GN DN HTN PKD
Percent of patients
0%
20%
40%
60%
80%
100%
Stage1 Stage2 Stage3a Stage3b Stage4 Stage5
Percent of patients
Normal Concentric remodeling Eccentric LVH Concentric LVH
B
Concentric LVH
0%
20%
40%
60%
80%
100%
Total GN DN HTN PKD
Percent of patients
0%
20%
40%
60%
80%
100%
Stage1 Stage2 Stage3a Stage3b Stage4 Stage5
Percent of patients
Normal Concentric remodeling Eccentric LVH Concentric LVH
A
B
0%
20%
40%
60%
80%
100%
Total GN DN HTN PKD
Percent of patients
0%
20%
40%
60%
80%
100%
Stage1 Stage2 Stage3a Stage3b Stage4 Stage5
Percent of patients
Normal Concentric remodeling Eccentric LVH Concentric LVH
A
B
Percent of patients (%)
Total GN DN HTN PKD
100 80 60 40 20 0
Percent of patients (%)
Stage 1 Stage 2 Stage 3a Stage 3b Stage 4 Stage 5 100
80 60 40 20
A 0 B
Table 3. Correlations of cardiovascular parameters with eGFR
Variables Total DN HTN
r P value r P value r P value
baPWV −0.340 < 0.001 −0.111 0.020 −0.036 0.510 Troponin T −0.637 < 0.001 −0.273 < 0.001 −0.112 0.080 hsCRP −0.129 < 0.001 −0.098 0.030 −0.045 0.380 LVMI −0.272 < 0.001 −0.267 < 0.001 −0.187 < 0.001
CAC −0.245 < 0.001 −0.057 0.210 0.033 0.520
eGFR = estimated glomerular filtration rate, DN = diabetic nephropathy, HTN = hyper- tensive nephropathy, baPWV = brachial-ankle pulse wave velocity, hsCRP = high-sen- sitive C-reactive protein, LVMI = left ventricular mass index, CAC = coronary arterial calcium.
Table 4. Correlation of cardiovascular parameters with urine ACR
Variables Total DN non-DN
r P value r P value r P value
baPWV 0.285 < 0.001 0.119 0.133 0.167 < 0.001 Troponin T 0.212 < 0.001 0.262 0.001 0.114 0.004
hsCRP 0.019 0.564 0.052 0.511 0.021 0.581
LVMI 0.251 < 0.001 0.313 < 0.001 0.135 < 0.001
CAC 0.110 0.001 −0.041 0.588 0.080 0.029
ACR = albumin to creatinine ratio, DN = diabetic nephropathy, baPWV = brachial-an- kle pulse wave velocity, hsCRP = high-sensitive C-reactive protein, LVMI = left ven- tricular mass index, CAC = coronary arterial calcium.
with albuminuria, and this association also found in non-DN subcohort. However, only troponin T (r = 0.262, P = 0.001) and LVMI (r = 0.313, P < 0.001) were significantly associated with ACR in DN subcohort.
DISCUSSION
In this study, we evaluated the baseline cardiovascular charac- teristics in Korean adult patients with CKD. We found that the prevalence of CVD was 14.4%, and higher in the DN and HTN subcohorts. The DN subcohort exhibited worst cardiovascular risk profiles, followed by the HTN subcohort. In addition, the cardiovascular risk profiles became worse in advanced stages of CKD and all parameters representing cardiovascular risk were inversely correlated with eGFR. These findings suggest that CKD patients have a high cardiovascular risk, particularly in the pres- ence of DN and severe kidney disease.
It should be noted that the prevalence of CVD in our study was relatively lower than that reported in previous CKD cohorts from the United States and Japan (10,15). A direct comparison of CVD prevalence is not feasible because there are many dif- ferences between the study cohorts. In particular, the KNOW- CKD study had more patients with earlier stages of CKD than the other cohorts. Nevertheless, when we compared only pa- tients with advanced stages of CKD (eGFR < 30 mL/min/1.73 m2), the prevalence of CVD in our study (20.0%) was still lower than that in the United States (39.6%) and Japan (27.9%). Some demographic and clinical factors may explain these differences.
The subjects in our cohort (53.7 years) were younger than those in the U.S. and Japanese cohorts (58.2 and 60.8 years, respec- tively), and the prevalence of diabetes (33.7%) was lower than those in the 2 cohorts (48.0% and 37.6%, respectively). The blood pressure, BMI, lipid profiles, and hsCRP levels also differed among the cohorts—they were more favorably controlled in our cohort.
Ethnicity may also have an influence on the different prevalenc- es of CVD. Generally, it has been suggested that Asians have a lower cardiovascular burden than the other ethnic groups. In the United States, Asian Americans had lower ESRD mortality than white Americans (22). In line with this finding, the Dialysis Outcomes and Practice Patterns Study showed that the mortal- ity rates in ESRD patients in the United States and Europe were significantly higher than those in Japan (23). This observational study also found that the prevalences of coronary disease and cerebrovascular disease were lower in Japanese patients. The practical patterns of dialysis vary across countries, which can also contribute to differences in cardiovascular burden. CVD is a consequence of complex interactions between genetic and environmental risk factors. Differences in regional socio-eco- nomic status, dietary habits, and genetic factors may result in different cardiovascular risks. In this regard, it would be inter- esting to see whether this relatively low cardiovascular burden
in our cohort will lead to superior outcomes in the future, after these patients start dialysis therapy, compared with those seen in Western countries.
Not surprisingly, the KNOW-CKD study showed that diabetic patients were at a high risk for CVD, as previously reported in other cohort studies (10,15,24). With the rapid transition to a Westernized lifestyle, the prevalence of diabetes has increased during the last decades in Korea, and about 10% of persons with- out CKD aged ≥ 30 years had diabetes (25). A recent study us- ing the Korean National Health and Nutrition Examination Sur- vey V reported that the prevalence of CKD was 5 times higher in patients with diabetes than in those without, and that diabetic patients were more likely to have advanced stages of CKD (26).
Accordingly, it is not surprising that diabetes has been a leading cause of ESRD, and that half of the ESRD patients started recei- ving dialysis because of DN in Korea. In this study, all parame- ters representing adverse cardiovascular risk were significantly higher in the DN subcohort. Because the cardiovascular risk profiles deteriorated in patients with advanced stages of CKD and were inversely correlated with eGFR, the lower eGFR in the DN subcohort may further aggravate the cardiovascular bur- den. Therefore, it is very likely that these patients will develop adverse cardiovascular events in the future, although most of the patients did not have overt CVD at baseline.
The baseline cardiovascular characteristics in the KNOW- CKD cohort are similar to those of other cohorts in that cardio- vascular risks were high in the advanced stages of CKD. In this study, we showed that the baPWV, LVMI, and CAC score were higher in the advanced stages of CKD and were inversely corre- lated with eGFR. These findings are not novel, but are in agree- ment with many other studies (27-29). All 3 parameters have been considered important determinants of adverse cardiovas- cular outcomes in CKD patients (30-32). However, most studies have not conducted follow-up examinations, and their findings were based on cross-sectional analyses. Arterial stiffness, LVH, and vascular calcification are dynamic processes that inevitably progress as the kidney function declines. The KNOW-CKD study will observe the changes of these parameters by performing follow-up tests such as PWV, echocardiography, and CT scan, and will be able to provide novel insights with respect to struc- tural and functional alterations of vasculature in CKD patients.
In addition, our cohort study will perform follow-up on a vari- ety of cardiovascular biomarkers such as hsCRP, cardiac tropo- nin T, adiponectin, klotho, and fibroblast growth factor 23. More in-depth investigations will be performed to clarify the associa- tions between these biomarkers and the future adverse cardio- vascular outcomes, and to explore whether the biomarkers can play a role in the dynamic alterations of vasculature in CKD pa- tients.
Our study has several limitations. First, although the KNOW- CKD is the first and largest CKD cohort study in Korea, its find-
238 http://jkms.org https://doi.org/10.3346/jkms.2017.32.2.231 ings may not represent the entire population of CKD in Korea.
The prevalence of CVD can significantly vary among etiologies of CKD, and different proportions of causative diseases can re- sult in differences in cardiovascular risk. In fact, our cohort in- cluded more patients with PKD than the other cohort studies.
As seen in our study, the cardiovascular risk profiles in these patients were lower than those in the DN and HTN cohorts. How- ever, a high prevalence of CVD in PKD patients was also report- ed previously because hypertension, LVH, cardiac valvular ab- normalities, and intracranial aneurysm can occur during the disease course (33). Therefore, it is reasonable to include a vari- ety of kidney diseases in a CKD cohort study. Second, our ob- servations were based on cross-sectional analyses and could not confirm causality. This is a common limitation of all cohort studies. However, cohort studies have many strengths, includ- ing their ability to clarify the temporal sequence between expo- sure and outcome, estimate the precise incidence of outcome and relative risk, and allow the examination of multiple compli- cated effects of a specific causative factor. From the viewpoint of cardiovascular risk in CKD, we hope that this cohort study will be able to find some novel biomarkers and therapeutic tar- gets, and also to provide guidelines for preventing adverse car- diovascular events and mortality in patients with CKD.
In conclusion, this study shows that the KNOW-CKD cohort exhibits a high cardiovascular burden, as other CKD cohorts in previous studies. Among the subcohorts, the DN subcohort posed the greatest risk for CVD. The ongoing long-term follow-up study up to 10 years will further delineate the cardiovascular charac- teristics and outcomes of each subcohort with different risk pro- files.
ACKNOWLEDGMENT
We thank the Korea Center for Disease Control and Prevention for funding this large-scale long-term cohort study. We also thank the clinical research coordinators of each participating institu- tion and the Medical Research Collaborating Center, Seoul Na- tional University Hospital for the data management and data quality control.
DISCLOSURE
The authors have no potential conflicts of interest to disclose.
AUTHOR CONTRIBUTION
Conceptualization: Oh KH, Han SH. Data curation: Oh KH, Lee J, Kim SW, Kim TH, Sung S, Han SH. Formal analysis: Kim H, Yoo TH, Choi KH, Han SH. Writing - original draft: Kim H. Writ- ing - review & editing: Kim H, Yoo TH, Choi KH, Oh KH, Lee J, Kim SW, Kim TH, Sung S, Han SH.
ORCID
Hyoungnae Kim http://orcid.org/0000-0002-5359-0214 Tae-Hyun Yoo http://orcid.org/0000-0002-9183-4507 Kyu Hun Choi http://orcid.org/0000-0003-0095-9011 Kook-Hwan Oh http://orcid.org/0000-0001-9525-2179 Joongyub Lee http://orcid.org/0000-0003-2784-3772 Soo Wan Kim http://orcid.org/0000-0002-3540-9004 Tae Hee Kim http://orcid.org/0000-0002-3588-0146 Suah Sung http://orcid.org/0000-0001-8434-9944 Seung Hyeok Han http://orcid.org/0000-0001-7923-5635
REFERENCES
1. Jin DC. Major changes and improvements of dialysis therapy in Korea:
review of end-stage renal disease registry. Korean J Intern Med 2015; 30:
17-22.
2. Coresh J, Selvin E, Stevens LA, Manzi J, Kusek JW, Eggers P, Van Lente F, Levey AS. Prevalence of chronic kidney disease in the United States. JAMA 2007; 298: 2038-47.
3. Hallan SI, Coresh J, Astor BC, Asberg A, Powe NR, Romundstad S, Hallan HA, Lydersen S, Holmen J. International comparison of the relationship of chronic kidney disease prevalence and ESRD risk. J Am Soc Nephrol 2006; 17: 2275-84.
4. Arora P, Vasa P, Brenner D, Iglar K, McFarlane P, Morrison H, Badawi A.
Prevalence estimates of chronic kidney disease in Canada: results of a nationally representative survey. CMAJ 2013; 185: E417-23.
5. Imai E, Horio M, Watanabe T, Iseki K, Yamagata K, Hara S, Ura N, Kiyoha- ra Y, Moriyama T, Ando Y, et al. Prevalence of chronic kidney disease in the Japanese general population. Clin Exp Nephrol 2009; 13: 621-30.
6. Park JI, Baek H, Jung HH. Prevalence of chronic kidney disease in Korea:
the Korean National Health and Nutritional Examination Survey 2011- 2013. J Korean Med Sci 2016; 31: 915-23.
7. Kim S, Lim CS, Han DC, Kim GS, Chin HJ, Kim SJ, Cho WY, Kim YH, Kim YS. The prevalence of chronic kidney disease (CKD) and the associated factors to CKD in urban Korea: a population-based cross-sectional epi- demiologic study. J Korean Med Sci 2009; 24 Suppl: S11-21.
8. Go AS, Chertow GM, Fan D, McCulloch CE, Hsu CY. Chronic kidney dis- ease and the risks of death, cardiovascular events, and hospitalization. N Engl J Med 2004; 351: 1296-305.
9. Shulman NB, Ford CE, Hall WD, Blaufox MD, Simon D, Langford HG, Sch- neider KA. Prognostic value of serum creatinine and effect of treatment of hypertension on renal function. Results from the hypertension detec- tion and follow-up program. The Hypertension Detection and Follow-up Program Cooperative Group. Hypertension 1989; 13: I80-93.
10. Lash JP, Go AS, Appel LJ, He J, Ojo A, Rahman M, Townsend RR, Xie D, Cifelli D, Cohan J, et al. Chronic renal insufficiency cohort (CRIC) study:
baseline characteristics and associations with kidney function. Clin J Am Soc Nephrol 2009; 4: 1302-11.
11. Ricardo AC, Lash JP, Fischer MJ, Lora CM, Budoff M, Keane MG, Kusek JW, Martinez M, Nessel L, Stamos T, et al. Cardiovascular disease among hispanics and non-hispanics in the chronic renal insufficiency cohort (CRIC) study. Clin J Am Soc Nephrol 2011; 6: 2121-31.
12. Mehrotra R, Kermah D, Fried L, Adler S, Norris K. Racial differences in