INTRODUCTION
Prevention of risk factors for cardiovascular diseases (CVD) such as obesity and dyslipidemia has been an important chal- lenge in developing countries due to the westernization of diet and lifestyle changes (1). One approach to preventing the condition was the identification of individuals at risk by screening with simple anthropometric measurements, fol- lowed by individualized counseling or treatment (2). The anthropometric measurements of interest include waist cir- cumference (WC) (3), waist-to-hip ratio (WHR) (4), waist- to-height ratio (WHtR) (5), skin fold thickness (6), and body mass index (BMI) (7). These indexes were considered mea- surements of obesity and diagnostic components of the meta- bolic syndrome (8, 9).
Interpretation of WC and other anthropometric parame- ters depended on ethnicity and cultural background, because adult anthropometry has been recognized as a biomarker of
‘early life’ (10). Careful analysis and interpretation lead to a comprehension of obesity as a risk factor for cardiovascular disease (CVD) (11, 12) and dementia or cognitive impair- ment (13). In the Korean peninsula, there have been several periods of impoverishment in recent history, including colo-
nial dominion under the rule of Japanese imperialism from 1910 to 1945 and the Korean War from 1950 to 1953 (14).
Now, about 50 yr after the Korean War, CVD including stroke has become the leading cause of mortality and morbidity in Korea, as it is in many developed and developing countries (15). Rapid economic improvements and modernization have led to an increasing epidemic of obesity and dyslipidemia (16).
Studies of anthropometric measurements can present impor- tant strategies for the control of dyslipidemia and obesity, and, ultimately, CVD (17). We therefore sought to assess the use- fulness of the four anthropometric measures, WC, WHtR, WHR, and BMI, in identifying individuals with dyslipidemia, in a population-based sample of Korean adults, as well as to determine any sex-based differences in these associations.
MATERIALS AND METHODS Subjects
Potential participants for this study were recruited in 1999 from all inhabitants aged 50 yr and over recorded in national residents registration lists within three rural areas (Ayoung,
Seul-Ki Jeong, Man-Wook Seo, Young-Hyun Kim, Sun-Seog Kweon*, Hae-Sung Nam�
Department of Neurology, Chonbuk National Unversity School of Medicine, Jeonju; *Department of Preventive Medicine, Seonam University School of Medicine, Namwon; �Department of Preventive Medicine, Chungnam National University School of Medicine, Daejeon, Korea
Address for correspondence Hae-Sung Nam, M.D.
Department of Preventive Medicine, Chungnam National University School of Medicine,
6 Munhwa-1-dong, Jung-gu, Daejeon 301-747, Korea Tel : +82.42-580-8266, Fax : +82.42-586-8875 E-mail : [email protected]
*This study was funded by grants for National Health Promotion from the Ministry of Health & Welfare, Korea (1999).
7
Does Waist Indicate Dyslipidemia better than BMI in Korean Adult Population?
Obesity is an independent and modifiable risk factor for cardiovascular disease, and known as a core of the metabolic syndrome. Obesity has been largely diag- nosed based upon anthrompometric measurements like waist circumference (WC) and body mass index (BMI). We sought to determine associations between anthro- pometric measurements and dyslipidemia in a community adult sample composed of 1,032 community residents (356 men, 676 women) aged 50 yr and over in Nam- won, Korea. Blood tests for lipid profiles, including total cholesterol (TC) and HDL cholesterol (HDL) were performed, and dyslipidemia was defined as TC/HDL greater than 4. Anthropometric measurements included WC, waist-to-height ratio (WHtR), waist-to-hip ratio, and BMI. All anthropometric measures were categorized into quartiles and evaluated for associations with dyslipidemia. TC/HDL showed the significant associations with the anthropometric measures, independently of potential confounders. In women, increases of obesity indexes by quartile analyses showed linear increases of odds ratios for dyslipidemia (p values <0.01 by trend test). In men, except BMI, same patterns of association were noted. WC and WHtR were significantly associated with dyslipidemia in Korean adult population. As a simple and non-invasive method for a detection of obesity and dyslipidemia, anthro- pometric measurements could be efficiently used in clinical and epidemiologic fields.
Key Words : Anthropometry; Waist Circumference; Body Mass Index; Hyperlipidemia; Population
Received : 21 July 2004 Accepted : 5 October 2004
Ibaek, and Jucheon) of Namwon city, Jeonbuk province, Korea. These three rural areas are comprised of 31 local dis- tricts, of which 21 were selected by multi-stage cluster sam- pling (68%). These 21 districts cover a land area of 90 km2 and have a population of 3,984, of whom 1,787 (44.9%), 704 men and 1,083 women, were aged 50 yr and over. Among the 1,787 eligible individuals, 1,032 (57.8%) responded to the survey. The 1,032 participants were slightly older (65.9± 8.2 yr) than the 755 non-participants (64.9±8.9 yr) and con- sisted of more women (62.4% vs. 37.6%). Subjects who had severe unilateral weakness due to previous strokes or known CVD were excluded from our cohort. All participants gave written informed consent, and the study was approved by the institutional research ethics committee.
Assessments and measurements
The study was conducted by medical personnel in the health care center of Namwon city, all of whom were trained and supervised by preventive medicine physicians. A blood sam- ple was taken from each participant, and an interview was conducted, according to standard protocols. The adminis- tered questionnaire was designed to determine prior history of CVD, stroke, diabetes, hypertension, and medication usage.
Lifestyle questions included alcohol drinking status, as esti- mated by frequency, duration, amounts and kinds of liquor, and standard drinks (9.5 g of alcohol) per day were calculat- ed. Smoking status was categorized into current smokers, ex- smokers and non-smokers. Blood pressure was measured on the right arm, with the subject in the sitting position, using a standard mercury manometer after at least 5 min of rest. First appearance (phase I) and disappearance (phase V) of Korotkoff’s sounds were used to define systolic and diastolic pressure.
Readings were recorded to the nearest even number, and two readings at 5 min intervals were taken from each participant.
The lower of the two readings was recorded as the individu- al’s blood pressure (18).
Anthropometric measurements
WC was measured, with the subject standing and wear- ing only underwear, at the level midway between the lower rib margin and the iliac crest. Hip circumference (HC) was measured at the fullest point around the buttocks. A digital scale, with an accuracy of ±100 g, was used to measure body weight (BW). Subjects were weighed without shoes, in their underwear. Standing body height (BH) was measured to the nearest 0.5 cm with a commercial stadiometer without shoes and with the shoulders in a relaxed position and the arms hanging freely. WC (cm) was divided by HC (cm) and BH (m) to calculate WHR and WHtR, respectively. BMI was calculated by a computer as weight divided by height squared (kg/m2).
Biochemical analyses
Laboratory procedures have previously been documented in detail (9). Blood samples were taken after an overnight fast and before breakfast. Blood lipids were analyzed at Seonam University Research Laboratory on the day of collection using a 550 Express Chemistry Analyzer (Ciba-Corning 550 Express, GMI Inc, Minnesota, U.S.A.). Total cholesterol (TC) was assayed by an enzymatic colorimetric test with cholesterol esterase and cholesterol oxidase, and HDL cholesterol (HDL) was quantitatively determined based on immunoinhibition by antihuman -lipoprotein antibody kits (Wako Pure Chemi- cal Industries, Ltd, Osaka, Japan). The ratio of TC to HDL (TC/HDL) was calculated. Fasting blood glucose was mea- sured using an enzymatic colorimetric assay with hexokinase.
Definitions
Obesity was defined as BMI greater than 25 kg/m2(19).
High WC was defined as greater than 90 cm in men and 80 cm in women (19). Lipid profiles were evaluated for cor- relations with anthropometric measurements, and individu- als with TC/HDL ≥4 and those taking lipid-lowering agents were defined as having dyslipidemia (20). TC/HDL has been found to better predict the occurrence of CVD events than measurements of various cholesterol levels (21). Subjects with persistent elevation of blood pressure (≥140/90 mmHg) or taking antihypertensive medications were classified as hyper- tensive (22). Type 2 diabetes mellitus (DM) was defined as a self-reported history of being told by a physician that dia- betes was present or having a fasting blood glucose of 126 mg/dL or greater, according to the criteria defined by the American Diabetic Association (23).
Statistical analysis
Age, lipid profile, and anthropometric measures were report- ed as mean±SD. The proportion of subjects having CVD risk factors was recorded. The differences in various anthropo- metric parameters and cardiovascular risk factors in men and women were compared by Student’s t-test or 2test, as appro- priate. Independent associations between TC/HDL and anthro- pometric measurements were evaluated with linear regression models, adjusting for the potential confounders. Subjects were categorized separately by gender according to their WC, WHR, WHtR, and BMI quartiles. Multiple logistic regres- sion analysis was used to compute odds ratios (OR) and 95%
confidence intervals (CI). Four categories were considered as explanatory variables, with the first quartile each of WC, WHR, WHtR, and BMI as reference categories and dyslipi- demia as a dichotomous outcome variable, and a likelihood ratio test for trend was performed. All statistical calculations were performed using Stata 8.2 for Windows package (Stata Corporation, College Station, TX, U.S.A.). P values <0.05
were considered statistically significant.
RESULTS
Mean ages were comparable among men and women as in Table 1. The prevalence of smoking and alcohol drinking was each significantly higher in men (p<0.001 for each). The amount of alcohol ingested (standard drinks per day) was also significantly higher in men (p<0.001). The proportion of individuals with no formal education was significantly high- er in women (p<0.001). Prevalence of type 2 DM and hyper- tension was similar in men and women. And the prevalence of obesity (defined by BMI ≥25 kg/m2), abdominal obesi- ty, and dyslipidemia were all significantly higher in women than in men.
TC/HDL showed independent associations with WC, WHtR, WHR, and BMI, adjusting for age, sex, education-
al years, smoking, alcohol, manual occupation, hypertension, and type 2 DM as in Table 2. Correlation analyses showed that the coefficients between TC/HDL and WC, WHtR, WHR, and BMI were 0.17, 0.25, 0.13, and 0.22, respec- tively (all p<0.001).
Quartile analyses represented that the first quartiles (ref- erence values) were WC <77 cm, WHR 0.85, WHtR 48.0, and BMI 20.4 in men and WC <77 cm, WHR 0.83, WHtR 51.5, and BMI 21.5 in women as in Table 3. BMI obesity criteria were present in the fourth quartile in men and the third quartile in women. The cut-offs for high WC were in- cluded in the fourth quartile in men and the second quartile in women.
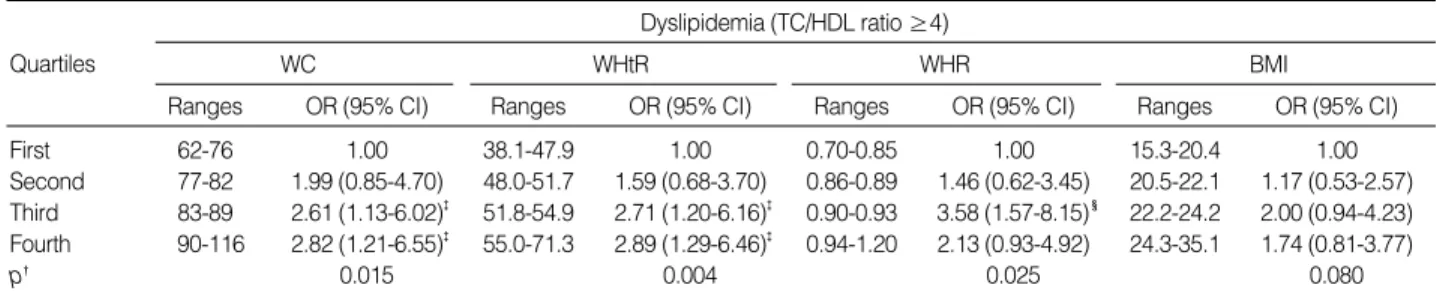
The associations between dyslipidemia and quartiles for all anthropometric measurements were calculated, indepen- dent of age, education, smoking, alcohol, occupation, hyper- tension, and type 2 DM as in Table 3, 4. As for dyslipidemia, WC and WHtR showed significant linear increases of OR in men as in Table 3. Compared to the reference quartile, the highest quartile represents OR and 95% CI of 2.82 (1.21- 6.55) in WC and 2.89 (1.29-6.46) in WHtR. For men, we observed linear increases in the ORs with increases in WC (p=0.015) and WHtR (p=0.004). Even the trend was sig- nificant, WHR did not show linearly increased ORs com- pared to WC and WHtR. The trend test was not significant for BMI.
For women, all four anthropometric measurements showed
Values are mean±SD or proportion as appropriate. BMI, body mass index; TC, total cholesterol; HDL, high density lipoprotein cholesterol.
*p<0.001, compared with men.
Men Women (n=356) (n=676) Demographics and risk factors
Age (yr) 66.2±7.7 65.8±8.4
No formal education (%) 34.6 77.5*
Smoking (current & ex-smoker) (%) 63.2 11.2*
Alcohol drinking (%) 59.6 19.8*
Standard drinks (alcohol 9.5 g per day) 3.0±5.5 0.1±0.5*
Manual occupation (%) 82.6 61.6*
Hypertension (reported & measured) (%) 48.9 43.6
Type 2 Diabetes 13.5 12.3
(reported & measured) (%)
General obesity (BMI >25 kg/m2) (%) 17.3 33.0*
Abdominal obesity (%) 25.3 63.9*
Lipid profiles
Total cholesterol, mg/dL 173.9±33.0 195.0±36.1*
HDL cholesterol, mg/dL 52.5±10.5 52.3±8.9
Ratio of TC to HDL 3.5±1.1 3.8±0.9*
Dyslipidemia (TC/HDL ≥4) (%) 21.6 38.0*
Table 1.Descriptive data by gender
WC, waist circumference; WHtR, waist-to-height ratio; WHR, waist-to- hip ratio; BMI, body mass index.
*Lipid levels denote ratio of total cholesterol to HDL cholesterol (TC/HDL ratio).�Adjusted for age, sex, educational years, smoking, alcohol, man- ual occupation, hypertension, and type 2 DM.
95% CI Lower Higher
� SE p
WC 0.014 0.003 0.000 0.01 0.02
WHtR 0.023 0.005 0.000 0.01 0.03
WHR 1.440 0.431 0.001 0.59 2.29
BMI 0.047 0.009 0.000 0.03 0.06
Table 2.Associations between lipid levels* and anthropometric measurements
OR, odds ratio; CI, confidence intervals; WC, waist circumference; WHtR, waist-to-height ratio; WHR, waist-to-hip ratio; BMI, body mass index.
*Adjusted for age, education, smoking, alcohol drinking, occupation, hypertension, and type 2 DM. �p values of trend test. �p<0.05, �p<0.01, ‖p<0.001 compared to the reference quartiles.
Dyslipidemia (TC/HDL ratio ≥4)
WC WHtR WHR BMI
First 62-76 1.00 38.1-47.9 1.00 0.70-0.85 1.00 15.3-20.4 1.00
Second 77-82 1.99 (0.85-4.70) 48.0-51.7 1.59 (0.68-3.70) 0.86-0.89 1.46 (0.62-3.45) 20.5-22.1 1.17 (0.53-2.57) Third 83-89 2.61 (1.13-6.02)� 51.8-54.9 2.71 (1.20-6.16)� 0.90-0.93 3.58 (1.57-8.15)� 22.2-24.2 2.00 (0.94-4.23) Fourth 90-116 2.82 (1.21-6.55)� 55.0-71.3 2.89 (1.29-6.46)� 0.94-1.20 2.13 (0.93-4.92) 24.3-35.1 1.74 (0.81-3.77)
p� 0.015 0.004 0.025 0.080
Ranges OR (95% CI) Ranges OR (95% CI) Ranges OR (95% CI) Ranges OR (95% CI)
Quartiles
Table 3.Adjusted* odds ratios for dyslipidemia by quartiles of anthropometric measurements in men
strongly significant results from the likelihood ratio test for trend (Table 4). The adjusted ORs (95% CI) in the highest quartiles of WC and BMI were 2.29 (1.45-3.63) and 2.29 (1.42-3.69), respectively. WHR showed slightly decreased OR in the highest quartile compared to the third, which was the same pattern observed in men.
DISCUSSION
This study showed that anthropometric measurements like WC and WHtR could be used as an indicator of risk factor for CVD, like dyslipidemia in Korean adult population. We also found sex differences in the associations between dylipi- demic status and BMI. Even BMI was independently asso- ciated with TC/HDL, BMI showed inconsistent results in men and women. This finding should be carefully considered when using BMI, as for a marker of vascular risk factor.
In the subsequent context, details of the anthropometric measurements would be discussed. Three concepts related to anthropometric measurements should be considered. First, all the anthropometric parameters measured here were influ- enced by lipidemic status, so they could be used as markers of vascular risk factors (2). Second, these anthropometric mea- surements in late adulthood were closely associated with early childhood growth patterns and birth weights (24, 25). Final- ly, anthropometric parameters may differ, depending on sex, ethnicity, and socio-economic conditions (26, 27).
Higher WC and WHtR were significantly associated with dyslipidemia in men and women. This might be due to male type (android) adiposity in men (26) and changes in body composition after menopause (28) in late adult women. The combination of WC and height, that is WHtR, could mani- fest better the morphology of an enlarged abdomen with dis- proportionately short stature. This finding was in part con- sistent with the previous report, which showed the superi- ority of WHtR to WC (5). But, as in the Table 3 and 4, the cut point for metabolic indexes could be different in Korean population. In Japanese population, WHtR of 50.0 was sug- gested as cut-point. But, in Korean adult population, WHtR of 50.0 was included in second quartile in men and first in
women. The cut-points for the last quartiles were 55 and 60 in men and women, respectively, even these values should be re-evaluated for their usefulness.
And WHR did not show linear associations, suggesting that WHR could be lower in predicting dyslipidemia com- pared to WC and WHtR in both sexes, BMI in women. This finding differed from those in Asian Indians, in which WHR had a higher discriminant ability than WC (29).
We found that, in women but not in men, BMI showed a statistically significant association by the trend test for dys- lipidemia. This might be largely due to a difference in fat dis- tribution between sexes, in that women were known to have more subcutaneous fat than men (26). This difference was manifested as early as 5-7 yr old (30) and affected energy home- ostasis (31). The differences in sex might also be related to socio-economic factors. Drinking intensity was known to affect the distribution of body fat and was positively associ- ated with central adiposity (32). Larger amounts and higher percentage of alcohol drinking, as in the present study, could affect fat distribution more viscerally in men than in women.
Education also affects obesity (27). The population studied here was largely deprived of educational attainment, espe- cially for women. Considering the effects of early life envi- ronment upon the late vascular risk factors (33), this low edu- cational attainment should be dealt with special attention.
Finally both WC and BMI could be associated with dyslipi- demia in women, and that was differed from those in Guade- loupean women, in which WC had a higher discriminant ability than BMI (34).
There were some limitations to this analysis. We could not determine individual levels of nutrition, even the participants born before the Korean War were supposed to be suffered from severe malnutrition when they were young. At that time, the Korean peninsula had no systematized social structures, including those for public health. Second, we did not acquire any information about the hormonal status of our women subjects. Thus, we do not know whether these women went through earlier menopause and whether this was related to redistribution of fat. Finally, participation rates in our survey were somewhat low. On average, nonparticipants were younger than participants, and there was a higher percentage of men
All the abbreviations are same as table 3. *Adjusted for age, education, smoking, alcohol drinking, occupation, hypertension, and type 2 DM. �p val- ues of trend test. �p<0.05, �p<0.01, ‖p<0.001 compared to the reference quartiles.
Dyslipidemia (TC/HDL ratio ≥4)
WC WHtR WHR BMI
First 60-76 1.00 38.7-51.4 1.00 0.44-0.82 1.00 15.7-21.4 1.00
Second 77-83 1.99 (1.25-3.16)� 51.5-55.6 1.92 (1.19-3.08)� 0.83-0.88 1.64 (1.01-2.66)� 21.5-23.8 1.33 (0.83-2.13) Third 84-89 2.27 (1.40-3.69)� 55.7-60.4 1.73 (1.07-2.79)‖ 0.89-0.92 2.60 (1.62-4.17)� 23.9-26.0 1.79 (1.12-2.88)� Fourth 90-145 2.29 (1.45-3.63)‖ 60.5-94.5 2.67 (1.66-4.28)‖ 0.93-1.13 2.33 (1.45-3.74)‖ 26.1-43.7 2.29 (1.42-3.69)�
p� 0.001 <0.001 <0.001 <0.001
Ranges OR (95% CI) Ranges OR (95% CI) Ranges OR (95% CI) Ranges OR (95% CI)
Quartiles
Table 4.Adjusted* odds ratios for dyslipidemia by quartiles of anthropometric measurements in women
in the former. Even if all the nonparticipants had participated in the study, however, our results would not change, although additional statistical power would be added to our analysis.
Obesity has been extensively studied as a main cause of metabolic disturbances, including metabolic syndrome (8), nonalcoholic fatty liver disease (9), and type 2 DM (23). As a simple and non-invasive method for a detection of obesity and dyslipidemia, anthropometric measurements could be efficiently used in clinical and epidemiologic fields.
REFERENCES
1. Yamada M, Wong FL, Kodama K, Sasaki H, Shimaoka K, Yamakido M. Longitudinal trends in total serum cholesterol levels in a Japanese cohort, 1958-1986. J Clin Epidemiol 1997; 50: 425-34.
2. Paccaud F, Schluter-Fasmeyer V, Wietlisbach V, Bovet P. Dyslipi- demia and abdominal obesity: an assessment in three general popu- lations. J Clin Epidemiol 2000; 53: 393-400.
3. Okosun IS, Liao Y, Rotimi CN, Choi S, Cooper RS. Predictive values of waist circumference for dyslipidemia, type 2 diabetes and hyper- tension in overweight White, Black, and Hispanic American adults.
J Clin Epidemiol 2000; 53: 401-8.
4. Snehalatha C, Viswanathan V, Ramachandran A. Cutoff values for normal anthropometric variables in Asian Indian adults. Diabetes Care 2003; 26: 1380-4.
5. Hsieh SD, Yoshinaga H, Muto T. Waist-to-height ratio, a simple and practical index for assessing central fat distribution and metabolic risk in Japanese men and women. Int J Obes Relat Metab Disord 2003; 27: 610-6.
6. Durnin JV, Womersley J. Body fat assessed from total body density and its estimation from skinfold thickness: measurements on 481 men and women aged from 16 to 72 years. Br J Nutr 1974; 32: 77-97.
7. Vikram NK, Misra A, Pandey RM, Dudeja V, Sinha S, Ramadevi J, Kumar A, Chaudhary D. Anthropometry and body composition in northern Asian Indian patients with type 2 diabetes: receiver oper- ating characteristics (ROC) curve analysis of body mass index with percentage body fat as standard. Diabetes Nutr Metab 2003; 16:
32-40.
8. Executive Summary of The Third Report of The National Choles- terol Education Program (NCEP) Expert Panel on Detection, Eval- uation, And Treatment of High Blood Cholesterol In Adults (Adult Treatment Panel III). JAMA 2001; 285: 2486-97.
9. Jeong SK, Nam HS, Rhee JA, Shin JH, Kim JM, Cho KH. Metabol- ic syndrome and ALT: a community study in adult Koreans. Int J Obes Relat Metab Disord 2004; 28: 1033-8.
10. Gunnell D. Can adult anthropometry be used as a ‘biomarker’ for prenatal and childhood exposures? Int J Epidemiol 2002; 31: 390-4.
11. Lawlor DA, Davey Smith G, Ebrahim S. Association between leg length and offspring birthweight: partial explanation for the trans- generational association between birthweight and cardiovascular disease: findings from the British Women’s Heart and Health Study.
Paediatr Perinat Epidemiol 2003; 17: 148-55.
12. Choi YS, Park SH, Kim BW. The clinical significance of anthropo-
metric measurements of obesity in Type 2 diabetics. J Korean Dia- bet Assoc 2000; 24: 365-74.
13. Jeong SK, Nam HS, Son MH, Son EJ, Cho KH. Interactive effect of obesity indexes on cognition. Dement Geriatr Cogn Disord 2004; 19:
91-6.
14. Lee JC. Korea’s health care policy of the twentieth century. Uisahak 1999; 8: 137-45.
15. Suh I. Cardiovascular mortality in Korea: a country experiencing epidemiologic transition. Acta Cardiol 2001; 56: 75-81.
16. Park Y, Lee H, Koh CS, Min H. Community-based epidemiologic study on atherosclerotic cardiovascular risk factors. Diabetes Res Clin Pract 1996; 34: S65-72.
17. Jee SH, Appel LJ, Suh I, Whelton PK, Kim IS. Prevalence of cardio- vascular risk factors in South Korean adults: results from the Korea Medical Insurance Corporation (KMIC) Study. Ann Epidemiol 1998;
8: 14-21.
18. Alderman MH. Measures and meaning of blood pressure. Lancet 2000; 355: 159.
19. World Health Organization (2000) The Asia-Pacific perspective.
Redefining obesity and its treatment. In: Health Communcations Australia Pty Limited. International Diabetes Institute.
20. Morar N, Seedat YK, Naidoo DP, Desai DK. Ambulatory blood pres- sure and risk factors for coronary heart disease in black and Indian medical students. J Cardiovasc Risk 1998; 5: 313-8.
21. Natarajan S, Glick H, Criqui M, Horowitz D, Lipsitz SR, Kinosian B. Cholesterol measures to identify and treat individuals at risk for coronary heart disease. Am J Prev Med 2003; 25: 50-7.
22. Chobanian AV, Bakris GL, Black HR, Cushman WC, Green LA, Izzo JL Jr, Jones DW, Materson BJ, Oparil S, Wright JT Jr, Roccel- la EJ. The seventh report of the joint national committee on preven- tion, detection, evaluation, and treatment of high blood pressure: the JNC 7 report. JAMA 2003; 289: 2560-72.
23. Report of the Expert Committee on the Diagnosis and Classification of Diabetes Mellitus. Diabetes Care 1997; 20: 1183-97.
24. Li H, Stein AD, Barnhart HX, Ramakrishnan U, Martorell R. Asso- ciations between prenatal and postnatal growth and adult body size and composition. Am J Clin Nutr 2003; 77: 1498-505.
25. Te Velde SJ, Twisk JW, Van Mechelen W, Kemper HC. Birth weight, adult body composition, and subcutaneous fat distribution. Obes Res 2003; 11: 202-8.
26. Sumner AE, Farmer NM, Tulloch-Reid MK, Sebring NG, Yanovs- ki JA, Reynolds JC, Boston RC, Premkumar A. Sex differences in visceral adipose tissue volume among African Americans. Am J Clin Nutr 2002; 76: 975-9.
27. Cabrera C, Wilhelmson K, Allebeck P, Wedel H, Steen B, Lissner L. Cohort differences in obesity-related health indicators among 70-year olds with special reference to gender and education. Eur J Epidemiol 2003; 18: 883-90.
28. Lovejoy JC. The menopause and obesity. Prim Care 2003; 30: 317- 25.
29. Vikram NK, Pandey RM, Misra A, Sharma R, Devi JR, Khanna N.
Non-obese (body mass index <25 kg/m2) Asian Indians with normal waist circumference have high cardiovascular risk. Nutrition 2003;
19: 503-9.
30. Webster-Gandy J, Warren J, Henry CJ. Sexual dimorphism in fat patterning in a sample of 5 to 7-year-old children in Oxford. Int J Food Sci Nutr 2003; 54: 467-71.
31. Woods SC, Gotoh K, Clegg DJ. Gender differences in the control of energy homeostasis. Exp Biol Med 2003; 228: 1175-80.
32. Dorn JM, Hovey K, Muti P, Freudenheim JL, Russell M, Nochajski TH, Trevisan M. Alcohol drinking patterns differentially affect cen- tral adiposity as measured by abdominal height in women and men.
J Nutr 2003; 133: 2655-62.
33. Gunnell DJ, Smith GD, Frankel SJ, Kemp M, Peters TJ. Socio-eco- nomic and dietary influences on leg length and trunk length in child- hood: a reanalysis of the Carnegie (Boyd Orr) survey of diet and health in prewar Britain (1937-39). Paediatr Perinat Epidemiol 1998;
12 (Suppl 1): 96-113.
34. Foucan L, Hanley J, Deloumeaux J, Suissa S. Body mass index (BMI) and waist circumference (WC) as screening tools for cardiovascular risk factors in Guadeloupean women. J Clin Epidemiol 2002; 55:
990-6.