Downloaded from http://journals.lww.com/md-journal by BhDMf5ePHKbH4TTImqenVGEOlA4BTqbSWb5Xz9A3XfzAdGvpdh0azukI3zlFLFKh+9adx4CMMIg= on 07/20/2020 Downloadedfrom http://journals.lww.com/md-journalby BhDMf5ePHKbH4TTImqenVGEOlA4BTqbSWb5Xz9A3XfzAdGvpdh0azukI3zlFLFKh+9adx4CMMIg=on 07/20/2020
The effects of blood pressure components on
cardiovascular events in a Korean hypertensive
population according to age and sex
A nationwide population-based cohort study
Eungyu Kang, MD
a, Seulbi Lee, PhDc
b, Eunhee Ha, MD, PhD
c,d,e, Hyung Jung Oh, MD, PhD
d,e,∗,
Dong-Ryeol Ryu, MD, PhD
a,d,f,∗Abstract
There is no known study regarding the usefulness of each blood pressure (BP) component based on stratification by age and sex for predicting cardiovascular (CV) events among hypertensive populations without chronic kidney disease (CKD) or diabetes mellitus (DM). This study was performed to investigate the association of BP components and CV events in a Korean hypertensive population according to age and sex. A total of 22,853 Korean hypertensive participants without CKD and DM were stratified into six groups according to age [40–49, 50–59, and 60 years or older] and sex. In each group, multivariate Cox proportional regression analysis was performed to reveal the associations of BP components [systolic BP (SBP), diastolic BP (DBP), mean arterial pressure (MAP) and pulse pressure (PP)] with CV events. The increase in PP and decrease in DBP were significantly associated with increase of CV events in males, but neither BP component was significantly associated with risk of CV events in females. When subjects were stratified by age and sex, an increase of SBP or PP was significantly related to the increased risk of CV events in 40’s male group, and only the elevation of PP was significantly associated with increase in incidence of CV events in 50’s male group, while a decrease in DBP was significantly associated with increased risk of CV events in older male group. In addition, there were no the significant associations with the incidence of CV events in MAP, after stratification according to age and sex. In conclusion, this study suggests that, in hypertensive populations, BP management may need to be performed after full consideration of age and sex.
Abbreviations:BP= blood pressure, CKD = chronic kidney disease, CV = cardiovascular, DBP = diastolic blood pressure, DM = diabetes mellitus, MAP= mean arterial pressure, PP = pulse pressure, SBP = systolic blood pressure.
Keywords:age and sex stratification, blood pressure components, cardiovascular events, hypertensive population
1. Introduction
Although hypertension (HTN) is a well-known risk factor for cardiovascular disease (CVD), studies on the effect of each blood pressure (BP) component on CVD have been inconsistent,[1,2] Borghi et al[3]demonstrated that, in a European cohort, systolic
BP (SBP) was a stronger predictor of coronary heart disease (CHD) and cerebrovascular events compared with diastolic BP (DBP), and this result has been generally consistent in other reports,[4–7]pointing to the importance of SBP. In contrast, data from the Framingham cohort with a mean age of 61 years, SBP was directly related to, but DBP was inversely associated with, the incidence of CHD risk, which means that pulse pressure (PP: SBP–DBP) is the strongest predictor among the three BP components (SBP, DBP, and PP).[8–10]On the other hand, Glynn and colleagues[11] described that SBP is more important than DBP, even in a younger population, but they could not show that PP was the most powerful predictor of adverse clinical events in the younger population. Moreover, a few analyses had also focused on the role of mean arterial pressure (MAP) and PP in CVD,[6,7]and several studies using different methodologies have demonstrated the relative importance of all 4 BP components. Therefore, we determined that the effect of all 4 BP components on CV events may need to be investigated case by case, that is, subjects with normal-range BP with prehypertension and with HTN. As a study on the impact of BP components on CV events among prehypertensive individuals was published,[12]a study on
Editor: Stefano Omboni.
EK and SL contributed equally to this work.
This research was supported by a National Research Foundation of Korea (NRF) grant funded by the Korean government (MSIT) (2010–0027945). It was also supported by a grant from the Korea Health Technology R&D Project through the Korea Health Industry Development Institute (KHIDI), funded by the Ministry of Health & Welfare, Republic of Korea (grant number: HI18C0844).
The authors have no conflicts of interest to disclose.
a
Department of Internal Medicine,b
Department of Medical Science,
c
Department of Preventive Medicine, School of Medicine, Ewha Womans University,dResearch Institute for Human Health Information,eEwha Institute of Convergence Medicine, Ewha Womans University Mokdong Hospital,f
Tissue Injury Defense Research Center, College of Medicine, Ewha Womans University, Seoul, Republic of Korea.
∗
Correspondence: Hyung Jung Oh, Ewha Institute of Convergence Medicine and Research Institute for Human Health Information, Ewha Womans University, Seoul, Republic of Korea (e-mail: [email protected]); Dong-Ryeol Ryu, Department of Internal Medicine, School of Medicine, Ewha Womans University, Seoul, Republic of Korea (e-mail: [email protected]).
Copyright© 2019 the Author(s). Published by Wolters Kluwer Health, Inc. This is an open access article distributed under the terms of the Creative Commons Attribution-Non Commercial-No Derivatives License 4.0 (CCBY-NC-ND), where it is permissible to download and share the work provided it is properly cited. The work cannot be changed in any way or used commercially without permission from the journal.
Medicine (2019) 98:33(e16676)
Received: 2 February 2019 / Received infinal form: 11 June 2019 / Accepted: 9 July 2019
http://dx.doi.org/10.1097/MD.0000000000016676
Observational Study
Medicine
the effect of each BP component on the risk of CV complications among hypertensive populations is necessary.
In addition, the prevalence of HTN and incidence of CV events are different based on sex. A study at Wake Forest Baptist Medical Center of 100 hypertensive subjects with a mean age of 53 years showed 30 to 40 percent higher incidence of vascular disease in women than in men, despite no differences between males and females in terms of BP, heart rate (HR), and body mass index (BMI). The study also found significant differences in the hemodynamic and hormonal mechanisms accounting for the increased BP in women compared to men. Therefore, physicians may need to choose selective BP management considering the age and sex of their patients. Hence, the aim of the current study was to investigate and compare the usefulness of each BP component based on stratification by age and sex for predicting CV events among 22,853 hypertensive patients without chronic kidney disease (CKD) or diabetes mellitus (DM).
2. Materials and methods
2.1. Health examination sample cohort database
In Korea, the National Health Insurance Service (NHIS) provides general health examinations to several populations:
1. regional insurance subscribers that include a regional household member 40 years or older and other household members,
2. employee subscribers who are 40 years or older and their dependents, and
3. medical aid beneficiaries who are household representatives 19 to 64 years of age and other household members 40 to 64 years of age.[13]
With the exception of non-office workers, these individuals are asked to undergo biennial health medical examination; non-office workers are required to undergo annual examinations. The health examination sample cohort database included 10% of all participants who underwent a health examination provided by the NHIS during calendar years 2002 and 2003, using simple random sampling, and they were followed until December 31, 2013.[14] The number of participants that received health
examinations among the general same-aged population in Korea was approximately 40% in 2002 and increased up to 68% in 2013.
2.2. Participants
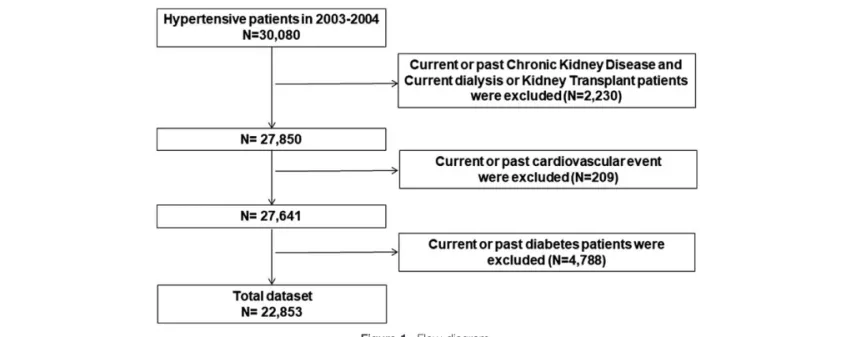
We enrolled participants that underwent medical examinations provided by the Korea Medical Insurance Corporation (KMIC) between January 1, 2003 and December 31, 2004. These examinations are referred to as the“baseline”. Among the people who received a medical examination during this timeframe, a total of 30,080 people were found to have HTN, we excluded 2230 people that had been diagnosed with current or past CKD and had received chronic dialysis or kidney transplantation at the enrollment point. Another 209 participants were excluded because they had experienced prior CV events, and 4788 people were excluded due to current or past DM. Finally, a total of 22,853 participants with HTN were involved in this study (Fig. 1). The study protocol was approved by the Institutional Review Board of Ewha Womans University, College of Medicine (EUMC 2018–01–039), and informed consent was waived because of retrospective study.
2.3. Data collection
Demographic and clinical data that were recorded during the health examination included age, sex, BMI calculated as weight/ height2and the Charlson Comorbidities Index (CCI).[15]BP was measured at mobile examination centers by trained examiners. SBP and DBP were measured three times, and the average of second and third measurements was used for analysis.[16,17]
MAP was calculated as 2/3 DBP + 1/3 SBP, and PP as SBP- DBP. The following laboratory data were measured as part of the health examinations: fasting blood glucose, total cholesterol, hemoglobin, and proteinuria with the dipstick test [( ), +, 1+, 2+, or over 3+].
2.4. Definitions
1. HTN was defined on the basis of a prior diagnosis of HTN, prior use of any antihypertensive medications within six
months of the defined enrollment time, or as measured BP ≥ 140/90 mmHg.[18]
2. DM subjects were defined as those with at least two recorded prescriptions of insulin or oral hypoglycemic agents with a diagnosis code of“E10–14 [International Statistical Classifi-cation of Disease and Related Health Problems (ICD)-10code]”.[19]
3. CV endpoints consisted of new onset mortality or hospitali-zation due to myocardial infarction, angina, or acute coronary syndrome.[20]
4. Hospitalization was defined as admission to a hospital for treatment lasting more than 2 days.
5. Smoking status was defined based on guidelines from the Centers for Disease Control and Prevention (https://www.cdc. gov/nchs/nhis/tobacco/tobacco_glossary.htm).
(1) A current smoker was defined as an adult who had smoked 100 cigarettes in his or her lifetime and who currently smokes cigarettes.
(2) A former smoker was defined as an adult who had smoked at least 100 cigarettes in his or her lifetime but who had quit smoking at the time of the interview.
(3) A never smoker was defined as an adult who had never smoked or who had smoked less than 100 cigarettes in his or her lifetime.
2.5. Study outcomes
All study participants were monitored for CV events during 9 years of follow-up, from January 1, 2005 through December 31, 2013.
2.6. Statistical analysis
Continuous variables were expressed as mean±standard devia-tion and categorical variables as number (percentage). Continu-ous variables were compared using the independent Student‘s t test, and categorical variables were compared with Pearson chi-square test. Then, we stratified the patients into 3 groups according to age [40–49, 50–59, and 60 years or older] and sex [male and female], respectively. Among the groups, the crude incidence rates were calculated by dividing the number of subjects with a given event by the person-years of follow-up, which were expressed as cases per 1000 person-years; confidence intervals (CIs) were estimated based on a Poisson distribution. In addition, a Cox proportional hazards analysis was performed to examine the time-to-event association with CV events. We selected adjusted covariates using stepwise selection for analysis of age, sex, total cholesterol level, smoking status, and CCI using a multivariate model. This analysis was conducted using R 3.2.3 software (R Development Core Team, 2013) and SAS 9.4 software (SAS Institute Inc., Cary, NC). TheP value less than .05 was considered statistically significant.
3. Results
3.1. Baseline characteristics
Among the 22,853 subjects, the mean age was 51.1±8.87 years and 69.2% were male. The mean BMI was 24.4±2.9kg/m2. Out
of the total individuals, 106 (0.5%) had cancer as a co-morbidity, congestive heart failure (CHF) was diagnosed in 98 (0.4%), and only four were treated for acute myocardial infarction (AMI). In
addition, mean SBP, DBP, PP, and MAP were 140.9±13.9, 89.8 ±9.0, 51.2±12.6, and 106.8±9.14 mmHg, respectively. At the initial health examination, 5,945 (26%) subjects were current smokers, and the number of non-smokers was 15,996 (70.0%), including past smokers.
Laboratory data indicated that mean fasting blood glucose and total cholesterol concentration were 89.8±10.4 and 200.4± 36.8 mg/dL, respectively, the mean hemoglobin level was 14.3± 1.5 g/dL, and CCI was 0.38±0.70.
Additionally, 377 (1.7%) hypertensive patients had protein-uria with a score greater than 1+ [1+: 264 (1.2%), 2+: 96 (0.4%), and over 3+: 17 (0.1%)] (Table 1). Subjects were stratified based on clinical outcomes of CV events. The non-event group included those in which CV events did not occur during the study period, and the event group included those in which CV events occurred during the study period. Study results demonstrated that SBP and PP were significantly elevated in the CV event group (142.8 mmHg SBP and 54.3 mmHg PP, respectively) compared with the CV non-event group (140.8 mmHg SBP and 51.0 mmHg PP), while DBP and MAP were significantly lower in the CV event group (88.5 mmHg in DBP and 106.6 mmHg in MAP) compared to the CV non-event group (89.8 mmHg in DBP and 106.8 mmHg in MAP). Moreover, the hypertensive patients who experienced CV events were significantly older (age 57.0 vs 50.6 years), had a history of previous AMI and CHF, and had a higher CCI (0.62 vs 0.36) compared with the hypertensive patients without CV events (Table 1). There was a significant difference in smoking status, while there was no significant difference in proteinuria level between the two groups. In the laboratory findings, the average total cholesterol level was significantly higher in the CV event group compared with the CV non-event group (203.5 vs 200.2 mg/dL), whereas the mean hemoglobin level was significantly lower in the CV event group compared to the CV non-event group (14.2 vs 14.3 g/dL) (Table 1).
3.2. The effects of baseline BP components on CV events among the hypertensive population
During the median 9 years of follow-up, the incidence rate of CV events was 7.56 (95% CI, 7.18–7.95) per 1000 person-years. When these patients were classified into 2 groups according to sex (male vs female) and then each stratified into 3 groups according to age (40–49, 50–59, and over 60), the crude incidence rates of CV events in ages 40–49, 50–59, and over 60 years in males were 4.43 (95% CI, 3.99–4.89), 8.17 (95% CI, 7.21–9.22), and 2.01 (95% CI, 1.82–2.22), respectively; those in females were 1.13 (95% CI, 1.09–1.17), 6.01 (95% CI, 4.98–7.19), and 1.68 (95% CI, 1.48–1.90) (Table 2).
In univariate Cox proportional regression analyses, a 10 mmHg increase of SBP and PP was significantly associated with the occurrence of more CV events [10 mmHg increase of SBP: hazard ration (HR)=1.105, 95% CI (1.067–1.144), P<.001; 10 mmHg increase of PP: HR=1.202, 95% CI (1.160–1.247), P<.001]; while 10 mmHg increase of DBP was significantly related to reduced risk of CV events [10 mmHg increase of DBP: HR=0.866, 95% CI (0.818–0.916), P<.001] and 10 mmHg increase of MAP could not observed significant association with the incidence of CV events [10 mmHg increase of MAP; HR= 0.965, 95% CI (0.912 -1.022), P=.223] (Table 3). However, multivariate Cox proportional regression analyses revealed that the HR of 10 mmHg increase in PP was 1.063 (95% CI; 1.022– 1.106,P=.002), but the HR of 10 mmHg increase in DBP was
0.923 (95% CI; 0.873–0.976, P=.005) for the risk of CV events after adjusting for age, sex, BMI, total cholesterol concentration, smoking status, and CCI. SBP and MAP were not significantly associated with increased incidence of CV events (Table 3 and Fig. 2).
3.3. The different effects of baseline BP components on CV events according to age and sex among the
hypertensive population
Table 4 illustrates that an increase in PP or decrease in DBP was significantly associated with higher occurrence of CV events in males, even after adjusting for age, BMI, total cholesterol concentration, smoking status, and CCI (PP; HR=1.102, 95%
CI; 1.051–1.156, P<.001, and DBP; HR=0.912, 95% CI; 0.851–0.978, P=.010), while an increase in SBP was marginally related to increase in risk of CV events (HR=1.043, 95% CI; 0.998–1.090, P=.059) and an increase in MAP could not observe the association with incidence in risk of CV events (HR= 0.975, 95% CI; 0.910–1.0432, P=.461) (Table 4 and Fig. 2). In contrast, there was no significant association in females between change of each BP component and incidence of CV events (Table 4 and Fig. 2).
When these patients were stratified according to age and sex, a 10 mmHg increase in SBP or PP was significantly related to increase in risk of CV events among the 40- to 49-year-old male group (SBP; HR=1.114, 95% CI; 1.031–1.203, P=.006, and PP; HR=1.158, 95% CI; 1.061–1.264, P=.001). A 10 mmHg elevation of PP was significantly associated with increased incidence of CV events among the 50- to 59-year-old male group (HR=1.161, 95% CI; 1.048–1.286, P=.004), whereas a decrease of DBP was significantly associated with increased risk of CV events among the 60-year-old and older male group (HR= 0.879, 95% CI; 0.795–0.972, P=.012) (Table 5 and Fig. 3). However, there was no significant relationship in the female groups between change in BP components and occurrence of CV events, and we could not observe the significant association of MAP with the incidence of CV events, even in the sub-analysis after being stratified by age and sex. (Table 5 and Fig. 3) 4. Discussion
Consistent with other studies,[4–7]we found that, for hypertensive male subjects, the importance of an increase in SBP and PP for
Table 1
Baseline characteristics.
Cardiovascular Event
Variables Total (N = 22,853) Non-Event (N = 21,373) Event (N = 1480) P value
Age, years 51.1±8.87 50.6±8.6 57.0±10.5 <.001
Male sex, n (%) 15,811 (69.2) 14,782 (69.2) 1029 (69.5) .791
Body mass index, kg/m2 24.4±2.9 24.4±2.9 24.2±3.1 .200
Comorbidities, n (%)
Cancer 106 (0.5) 96 (0.4) 10 (0.7) .230
Acute myocardial infraction 4 (0.0) 2 (0.01) 2 (0.14) .023
Congestive heart failure 98 (0.4) 81 (0.4) 17 (1.1) <.001
SBP, mmHg 140.9±13.9 140.8±13.8 142.8±15.4 <.001
DBP, mmHg 89.8±9.0 89.8±8.9 88.5±10.4 <.001
PP, mmHg 51.2±12.6 51.0±12.5 54.3±13.0 <.001
MAP, mmHg 106.8±9.14 106.8±9.03 106.6±10.6 <.001
Smoking, n (%) .019
Non or Past smoker 15,996 (70.0) 14,996 (70.2) 1000 (67.6)
Current smoker 5,945 (26.0) 5,514 (25.8) 431 (29.1)
missing 912 (4.0) 863 (4.0) 49 (3.3)
Laboratory data
Fasting blood glucose, mg/dL 89.8±10.4 89.8±10.4 89.7±10.6 .946
Total cholesterol, mg/dL 200.4±36.8 200.2±36.5 203.5±40.6 .002 Hemoglobin, g/dL 14.3±1.5 14.3±1.5 14.2±1.5 .002 Proteinuria, n (%) .171 22,184 (97.1) 20,751 (97.1) 1,433 (96.8) ± 292 (1.3) 277 (1.3) 15 (1.0) + 264 (1.2) 245 (1.1) 19 (1.3) ++ 96 (0.4) 85 (0.4) 11 (0.7) ≥+++ 17 (0.1) 15 (0.1) 2 (0.1)
Charlson comorbidity index 0.38±0.70 0.36±0.68 0.62±0.94 <.001
Data are expressed as mean (with standard deviation) or n (%).
CI=confidence rate, DBP =diastolic blood pressure, PP=pulse pressure, SBP=systolic blood pressure.
Table 2
Incidence rate of cardiovascular events per 1000 person-years. Events/1000 person-years Hypertension population 7.56 (7.18–7.95) Male 40–49 4.43 (3.99–4.89) 50–59 8.17 (7.21–9.22) 60– 2.01 (1.82–2.22) Female 40–49 1.13 (1.09–1.17) 50–59 6.01 (4.98–7.19) 60– 1.68 (1.48–1.90)
Person-years and confidence intervals were calculated by Mid-P exact test.BP =blood pressure, CI= confidence interval, CV=cardiovascular,
risk of CV events was demonstrated in the younger generation; however, a decrease in DBP was significantly associated with increase in the incidence of CV events in older generations. However, there was no significant association between variation in BP components and CV events in hypertensive female subjects irrespective of age stratification and there were no significant associations of MAP in sub-analysis after stratification according to age and sex.
The reasons why there was no significant relation between change of BP components and CV events in the hypertensive female populations have not been elucidated. However, it is well-known that there are differences in prevalence of HTN and incidence of CV events between men and women.[21]Moreover,
women are considered to be protected from most CV events compared to men, and the risk for CV events accelerates after menopause. Therefore, postmenopausal women are at increased risk of CV complications compared to premenopausal wom-en.[22]In our study, the crude incidence rates for CV events were lower in female groups compared with male groups, as in other studies (Table 2),[21] which might result in no significant
association between variation in BP components and occurrence of CV events in female groups.
However, the relative ratio (RR) of incidence rate for CV events between older males and females was greater than that in
the younger age groups (RR in 60 years or more: 0.84, RR in age 50 s group: 0.74, and RR in age 40s group: 0.26) when we examined the RR as incidence rate of CV events in the female group incidence rate of CV events in the male group at the same age. This indicates that the occurrence of CV events in hypertensive females after menopause rapidly increased compared to that in hyperten-sive males of the same age. Moreover, in women aged 65 years or older, the prevalence of HTN was higher than that found in men aged 65 years or older in 2007 (61.8% in women vs 49.3% in men) and 2011 (68.9% in women vs 58.4% in men).[22]Nevertheless, we could notfind as significant association between change of BP components and risk of CV events even in the 60 years and older, hypertensive female population.
The pathophysiological mechanisms for sexual differences in the prevalence of HTN and incidence of CV events have not been established but are not likely as simple as the presence or absence of estrogens, since hormone replacement therapy in older women in the Women’s Health Initiative or the HERS Trials did not provide primary or secondary prevention. However, our results demonstrate that BP management should be selectively per-formed according to age and sex to reduce CV events among hypertensive populations.
In this study, a 10 mmHg increase of PP was significantly associated with increase in incidence of CV events among the
Table 3
Multivariate Cox proportional regression analysis of each blood pressure component for cardiovascular events.
Unadjusted model Adjusted model
HR 95% CI P value HR 95% CI P value
SBP (per 10 mmHg increase) 1.105 1.067 1.144 <.001 1.017 0.981 1.054 .352
DBP (per 10 mmHg increase) 0.866 0.818 0.916 <.001 0.923 0.873 0.976 .005
PP (per 10 mmHg increase) 1.202 1.160 1.247 <.001 1.063 1.022 1.106 .002
MAP (per 10 mmHg increase) 0.965 0.912 1.022 .223 0.962 0.910 1.017 .170
Adjusted for age, sex, body mass index, total cholesterol concentrations, smoking status, and Charlson comorbidity index. CI=confidence interval, DBP=diastolic blood pressure, HR=hazard ratio, PP=pulse pressure, SBP=systolic blood pressure.
Figure 2. Forest plot of the risk of CV events in males and females Among the total population studied, HRs for the incidence of CV events were 1.063 and 0.923 per increase of 10 mmHg in PP and DBP, respectively, whereas there was no significant association between increase in SBP and risk of CV events. In addition, increase of PP and decrease of DBP were also significantly associated with incidence of CV events in males, but neither BP component was significantly associated with risk of CV events in females. BP=blood pressure, CV=cardiovascular, DBP =diastolic blood pressure, HR=hazard ratio, PP =pulse pressure, SBP=systolic blood pressure.
total hypertensive population. Several pathogenic mechanisms for the relationship between PP and CV events have been explained as due to increased arterial stiffness, which causes SBP to increase and DBP to decrease by shifting the wave reflection from diastole to systole.[23] SBP elevation has
deleterious effects on myocardial oxygen demands, and a reduction of DBP might compromise diastolic perfusion time and coronary perfusion. Finally, widened PP can lead to presence of a clinical or subclinical comorbid condition, such as aortic insufficiency.[24] However, in our study, there was no
significant association between increase in SBP and risk of CV events, which indicates that diastolic perfusion time and coronary perfusion may be more of an issue for the occurrence of CV events among hypertensive populations compared with myocardial oxygen demands.
In Korea, a routine health examination is recommended every other year for those over 40 years of age, and BP is always measured during these examinations.[13,14]However, it
is still controversial whether a health examination is beneficial based on cost-effective analysis. Unfortunately, we did not examine serial BP variations or investigate the effect of variability of BP components on the risk of CV events. Thus, it is hard to emphasize the benefit of periodic health examina-tions based on study results. Nevertheless, this study implies that physicians may need to choose selective BP management based on baseline BP and considering the age and sex of their patients.
There were several limitations to our study. First, the health examination sample cohort database included 10% of all participants who underwent a health examination provided by the NHIS from January 1, 2002 through December 31, 2003, using simple random sampling and who were followed until December 31, 2013. Thus, these data do not represent the entire healthy Korean population. Second, the study was a retrospective cohort observational study. Thus, selection bias could not be excluded. In the future, interventional prospective studies will be
Table 5
Multivariate Cox proportional regression analysis of each blood pressure component for cardiovascular events according to age group and sex. Cardiovascular Event Male Female N HR 95% CI P value N HR 95% CI P value 40–49 9572 3037 SBP (per 10 mmHg increase) 1.114 1.031 1.203 .006 0.995 0.859 1.153 .945 DBP (per 10 mmHg increase) 0.979 0.865 1.109 .742 0.824 0.662 1.026 .083 PP (per 10 mmHg increase) 1.158 1.061 1.264 .001 1.104 0.938 1.299 .235
MAP (per 10 mmHg increase) 1.072 0.953 1.206 .245 0.878 0.705 1.094 .245
50–59 3640 2176
SBP (per 10 mmHg increase) 1.075 0.985 1.174 .103 0.957 0.844 1.085 .494
DBP (per 10 mmHg increase) 0.903 0.779 1.048 .180 0.898 0.742 1.088 .272
PP (per 10 mmHg increase) 1.161 1.048 1.286 .004 1.003 0.866 1.162 .967
MAP (per 10 mmHg increase) 0.999 0.868 1.149 .986 0.906 0.753 1.090 .295
60 - 2599 1829
SBP (per 10 mmHg increase) 0.983 0.919 1.051 .610 0.954 0.877 1.037 .267
DBP (per 10 mmHg increase) 0.879 0.795 0.972 .012 0.964 0.850 1.093 .567
PP (per 10 mmHg increase) 1.047 0.975 1.124 .205 0.964 0.882 1.055 .428
MAP (per 10 mmHg increase) 0.905 0.818 1.002 .054 0.941 0.829 1.068 .344
Adjusted for age, body mass index, total cholesterol concentrations, smoking status, and Charlson comorbidity index.
CI=confidence interval, DBP=diastolic blood pressure, HR=hazard ratio, MAP=mean arterial pressure, PP=pulse pressure, SBP=systolic blood pressure.
Table 4
Multivariate Cox proportional regression analysis of each blood pressure component for cardiovascular events according to sex. Cardiovascular Event N HR 95% CI P value Male 15,811 SBP (per 10 mmHg increase) 1.043 0.998 1.090 .059 DBP (per 10 mmHg increase) 0.912 0.851 0.978 .010 PP (per 10 mmHg increase) 1.102 1.051 1.156 <.001
MAP (per 10 mmHg increase) 0.975 0.910 1.0432 .461
Female 7042
SBP (per 10 mmHg increase) 0.964 0.905 1.027 .255
DBP (per 10 mmHg increase) 0.919 0.836 1.011 .083
PP (per 10 mmHg increase) 1.000 0.933 1.071 .999
MAP (per 10 mmHg increase) 0.920 0.837 1.011 .085
Adjusted for age, body mass index, total cholesterol concentrations, smoking status, and Charlson comorbidity index.
required to confirm these results. Third, we could not measure serial BP variations individually. Thus, there is a limitation to showing how to manage BP in hypertensive populations. Fourth, there was a relatively small number of women (30.8%) compared to men (69.2%). Thus, future investigation with larger number of women is needed to delineate the effects of BP components in the female hypertensive group. Despite these limitations, the study is the first, to our knowledge, to investigate BP components according to age and sex among hypertensive populations without CKD or DM.
This study suggests that BP management in hypertensive populations may need to be performed after full consideration of patient age and sex. However, an interventional, prospective study with larger populations is needed to confirm these results.
Author contributions
Conceptualization: Hyung Jung Oh, Eungyu Kang, Seulbi Lee, Dong-Ryeol Ryu.
Data curation: Eungyu Kang, Seulbi Lee, Eunhee Ha. Formal analysis: Eungyu Kang, Seulbi Lee, Eunhee Ha. Investigation: Eungyu Kang, Seulbi Lee, Eunhee Ha.
Methodology: Hyung Jung Oh, Eungyu Kang, Seulbi Lee, Dong-Ryeol Ryu.
Project administration: Hyung Jung Oh, Dong-Ryeol Ryu. Software: Hyung Jung Oh, Seulbi Lee, Eunhee Ha. Supervision: Hyung Jung Oh, Dong-Ryeol Ryu.
Validation: Hyung Jung Oh, Eungyu Kang, Seulbi Lee, Dong-Ryeol Ryu.
Visualization: Hyung Jung Oh, Eungyu Kang, Seulbi Lee, Dong-Ryeol Ryu.
Writing– original draft: Hyung Jung Oh, Eungyu Kang, Seulbi Lee, Eunhee Ha, Dong-Ryeol Ryu.
Writing– review & editing: Hyung Jung Oh, Eungyu Kang, Seulbi Lee, Eunhee Ha, Dong-Ryeol Ryu.
References
[1] Sever PS. Abandoning diastole. BMJ 1999;318:1513–8.
[2] Staessen JA, Gasowski J, Wang JG, et al. Risks of untreated and treated isolated systolic hypertension in the elderly: meta-analysis of outcome trials. Lancet 2000;355:865–72.
[3] Borghi C, Dormi A, L‘ltalien G, et al. The relationship between systolic blood pressure and cardiovascular risk– Results of the Brisighella Heart Study. J Clin Hypertens (Greenwich) 2003;5:47–52.
[4] Lewingtons S, Clarke R, Qizilbash N, et al. Age-specific relevance of usual blood pressure to vascular mortality: a meta-analysis of individual data for one million adults in 61 prospective studies. Lancet 2002;360:1903–13.
[5] Asia Pacific Cohort Studies CollaborationBlood pressure indices and cardiovascular disease in the Asia Pacific region: a period analysis. Hypertension 2003;42:69–75.
[6] Miura K, Dyer AR, Greenland P, et al. Pulse pressure compared with other blood pressure indexes in the prediction of 25-year cardiovascular and all-cause mortality rates. The Chicago Heart Association Detection Project in Industry Study. Hypertension 2001;38:232–7.
[7] Sesso HD, Stampfer MJ, Rosner B, et al. Systolic and diastolic blood pressure, pulse pressure, and mean arterial pressure as predictors of cardiovascular disease risk in men. Hypertension 2000;36:801–7. [8] Franklin SS, Khan SA, Wong ND, et al. Is pulse pressure useful in
predicting risk for coronary heart disease? The Framingham Heart Study. Circulation 1999;100:354–60.
Figure 3. Forest plot of the risk of CV events after stratification by age and sex Among the 40- to 49-year-old male group, a 10 mmHg increase of SBP or PP was significantly related to increase of risk of CV events (SBP: HR=1.114, 95% CI, 1.031–1.203, P=.006, and PP: HR=1.158, 95% CI, 1.061–1.264, P=.001), and 10 mmHg elevation of PP was significantly associated with increase of incidence of CV events among the 50- to 59-year-old male group (HR =1.161, 95% CI, 1.048– 1.286, P=.004), whereas decrease of DBP was significantly associated with elevation of risk of CV events among the 60 years and older male group (HR =0.879, 95% CI, 0.795–0.972, P=.012). However, there was no significant relation among female groups between change of BP components and occurrence of CV events. BP=blood pressure, CV =cardiovascular, DBP =diastolic blood pressure, HR =hazard ratio, PP=pulse pressure, SBP =systolic blood pressure.
[9] Casiglia E, Tikhonoff V, Mazza A, et al. Pulse pressure and coronary mortality in elderly men and women from general population. J Hum Hypertensions 2002;16:611–20.
[10] Safar ME. Pulse pressure, arterial stiffness and cardiovascular risk. Curr Opin Cardiol 2000;15:258–63.
[11] Glynn RJ, L‘Italien GJ, Sesso HD, et al. Development of predictive models for long-term cardiovascular risk associated with systolic and diastolic blood pressure. Hypertension 2002;39:105–10.
[12] Oh HJ, Lee S, Lee EK, et al. Association of blood pressure components with mortality and cardiovascular events in prehypertensive individuals: a nationwide population-based cohort study. Ann Med 2018;21:1–0. [13] Kim NH, Lee J, Kim TJ, et al. Body mass index and mortality in the
general population and in subjects with chronic disease in Korea: a nationwide cohort study (2002-2010). PLos One 2045;10:e0139924. [14] Lee YH, Han K, Ko SH, et al. Data analytic process of a nationwide
population-based study using national health information database estab-lished by national health insurance service. Diabetes Metab J 2016;40:79–82. [15] Roffman CE, Buchanan J, Allison GT. Charlson Comorbidities Index.
J Physiother 2016;62:171.
[16] Chobanian AV, Bakris GL, Black HR, et al. Seventh report of the joint national committee on prevention, detection, evaluation, and treatment of high blood pressure. Hypertension 2003;42:1206–52.
[17] de Boer IH, Bangalore S, Benetos A, et al. Diabetes and hypertension: aposition statement by the american diabetes association. Diabetes Care 2017;40:1273–84.
[18] James PA, Oparil S, Carter BL, et al. 2014 Evidence-Based Guideline for the Management of High Blood Pressure in Adults: Report From the Panel Members Appointed to the Eighth Joint National Committee (JNC 8). JAMA 2014;311:507–20.
[19] Kerner W, Brukel J. German Diabetes Association. Definition, classification and diagnosis of diabetes mellitus. Exp Clin Endocrinol Diabetes 2014;122:384–6.
[20] Cimino JJ. Desiderata for controlled medical vocabularies in the twenty-first century. Methods Inf Med 1998;37:394–403.
[21] Bairey Merz CN, Ramineni T, Leong D. Sex-specific risk factors for cardiovascular disease in women– making cardiovascular disease real. Curr Opin Cardiol 2018;33:500–5.
[22] Appleman Y, van Rijn BB, Ten Haaf ME, et al. Sex differences in cardiovascular risk factors and disease prevention. Atherosclerosis 2015;241:211–8.
[23] Nichols WW, O‘Rourke MF, Vlachopoulos C. McDonald’s blood flow in arteries. 6th ed. London, UK: Arnold; 2011.
[24] O‘Rourke Mi, Frohlich ED. Pulse pressure: is this a clinically useful risk factor? Hypertension 1999;34:372–4.