30(6); 487~500; June 2021 https://doi.org/10.5322/JESI.2021.30.6.487
ORIGINAL ARTICLE
낙동강 하구 표층 퇴적물의 지화학적 특성 및 오염도 평가
전혜린․이혜윤․양득석․김신* 국립환경과학원 낙동강물환경연구소
Geochemical Characteristics and Pollution Assessment of Surface Sediments in the Nakdong River Estuary
Hye-Lyn Jeon, Hye-Yun Lee, Deuk-Seok Yang, Shin Kim*
Nakdong River Environment Research Center, National Institute of Environmental Research, Daegu 43008, Korea
Abstract
To evaluate the geochemical characteristics and assess the pollution in surface sediments of the Nakdong River estuary, two sites adjacent to the estuary bank (Hh1 and Hh2) and one site at the upper part of the estuary bank (Hh3) were investigated. The surface sediments were analyzed for their contents of metals (Cu, Pb, Ni, Cr, Zn, and Al), organic matter (IL, COD, TOC, and TN), and grain size from 2018 to 2020. As a result of the pollution assessment, there was little anthropogenic contamination by most of the metals. The surface sediments in Hh2 had comparatively abundant silt and clay, whereas the other sites were mainly composed of sand. The organic index and contents of organic matter were highest at Hh2.
Multivariate statistical analyses (cluster analysis and Pearson correlation analysis) showed that the contents of organic matter and pollution were associated with fine sediment. These results suggest that the geochemical characteristics were changed by the estuary bank built in the research area and that the increase in fine sediment attributable to the low-energy environment resulted in an increase in organic matter pollution.
Key words : Nakdong River estuary, Surface sediments, Pollution assessment, Metals, Grain size, Organic matter
1. 서 론1)
인간과 밀접한 연관이 있는 하천, 연안 및 하구 지역은 인간 활동으로 발생하는 유기물, 영양염류 및 미량 금속 등의 오염 물질이 유입되어 다양한 생화학적 반응을 통 해 수계에 체류하고 퇴적물에 침전된다. 퇴적물은 단기 간의 환경 변화를 반영하는 수질에 비해 시·공간적 변화 가 적고 오염물질의 저장소 역할을 하기 때문에 환경 오
염을 평가하는 중요한 모니터링 도구로 활용되고 있다 (Thornton, 1983). 또한, 퇴적물에 침전된 오염 물질들 은 재부유 및 용출 등의 작용에 의하여 수질과 수생태계 에 악영향을 미치게 된다(Dekov et al., 1997; Kim and Jeong, 2007). 특히, 하구는 육상환경과 해양환경이 인 접한 지역으로 담수와 해수의 상호작용으로 시·공간적으 로 복잡하게 변화하며(Lee et al., 2007), 조석 및 파랑의 상호작용뿐만 아니라 유량 및 퇴적물 공급에 의해 영향을
Received 3 May, 2021; Revised 7 June, 2021;
Accepted 14 June, 2021
*Corresponding author: Shin Kim, Nakdong River Environment Research Center, National Institute of Environmental Research, Daegu 43008, Korea
Phone : +82-53-602-2754 E-mail : [email protected]
ⓒ The Korean Environmental Sciences Society. All rights reserved.
This is an Open-Access article distributed under the terms of the Creative Commons Attribution Non-Commercial License (http://
creativecommons.org/licenses/by-nc/3.0) which permits unrestricted non-commercial use, distribution, and reproduction in any medium, provided the original work is properly cited.
받는다(Kim et al., 2011). 이와 같이 하구의 환경과 오 염에 의한 영향을 이해하기 위해서는 퇴적물 분석을 통 하여 지화학적 특성과 오염을 지속적으로 파악하고 인공 적으로 건설된 구조물 등에 대한 물리적 환경 변화를 고 려한 연구가 수행되어야 한다.
낙동강 하구는 1983년부터 1987년에 건설되어 (MOE, 2015) 담수와 해수의 교환이 제한되고 하구의 가장 큰 기능인 기수역을 상실하였으며, 하굿둑을 기준 으로 담수역의 상부와 해수역의 하부로 분명하게 구분되 고 있다. 하굿둑 건설은 하천과 해양의 자연적인 물질순 환을 차단시켜 유속의 감소와 조간대의 감소, 조석의 진 폭 확장 등과 같이 수층과 퇴적물에서의 물리 화학적 특 성을 변화하게 하는 원인으로 작용하며(Byun et al., 2004), 수위 조절을 위한 간헐적 방류를 통해 해양 환경 과 하구 생태계의 순환이 이루어질 수 있다(Choi et al., 2020). 낙동강 하구 퇴적물에 관한 연구는 지형 변화에 관한 연구(Yoon et al., 2007), 낙동강 하구 퇴적환경 변 화(Williams et al., 2013), 퇴적물 수송 메커니즘(Chang et al., 2020), 삼각주 연안 사주의 퇴적 환경 변화(Kim and Ha, 2001) 및 오염도 평가에 대한 연구(Lee, 2019;
Lee et al., 2020) 등이 진행되어왔으나, 낙동강 하굿둑 상부 담수역 내 시·공간 변화를 파악한 연구는 다소 부족 한 실정이다. 이에 본 연구에서는 낙동강 하구에 분포하 는 표층 퇴적물을 대상으로 금속류, 입도, 유기물을 분석 하여 퇴적물 조성을 파악하고 금속류와 유기물의 오염도 평가를 실시하였다. 퇴적물 오염도 평가를 위해 국내·외 환경기준과 비교하였으며, 유기물의 오염도를 평가하는 유기물 지표(Organic index, Org-index)와 금속류의 오 염도를 평가하는 농축계수(Enrichment Factor, EF), 농 집지수(Index of geoaccumulation, Igeo) 및 금속의 전 체적인 오염도 평가를 위한 오염부하계수(Pollution Load Index, PLI)를 산출하였다. 또한, 퇴적물의 오염 특성 파악을 위한 많은 연구들이 다변량 통계기법 (Multivariate statistics analysis)을 이용하고 있으며 (Fernandes and Nayak, 2012; Chung el al., 2016), 이 와 같이 본 연구에서도 분석 항목 간 유사성과 상관관계 를 파악하기 위하여 분석 결과를 바탕으로 군집 분석 (Cluster analysis)과 상관 분석(Correlation analysis)을 실시하였다. 본 연구는 하굿둑 건설 이후 낙동강 하구 표 층 퇴적물의 지화학적 특성을 이해하고 오염도 변화를
파악하는데 목적을 두고 있으며, 향후 낙동강 하구의 표 층 퇴적물 관리 및 평가에 관한 연구에 활용될 수 있을 것 으로 생각된다.
2. 연구지역
연구지역은 낙동강 수계에 포함되며, 낙동강은 총 유 로연장 약 521.5 ㎞, 유역면적은 23,656 ㎢로 국내에서 두 번째로 긴 하천으로(Park et al., 2001; MOCT, 2006), 행정구역은 부산광역시, 대구광역시, 울산광역시, 경상 남·북도, 전라 남·북도 및 강원도 등 3광역시 5도의 일부를 포함하고 있다(Lee et al., 2013). 낙동강 하구는 국내 유일의 조석, 파랑 혼합 삼각주 형태로서 농업용수 와 공업용수의 염해를 방지하고 교통망 확충과 주변 지 역의 안정적 생수 및 공용수 공급을 목적으로 1983년부 터 1987년에 걸쳐 낙동강 하굿둑이 건설되었다(Lee et al., 2014). 또한 하굿둑으로부터 약 40 km의 상류 구간 은 원래 기수역으로 본류 구간이었으나 하굿둑 건설로 인해 담수화되었으며, 하굿둑을 경계로 낙동강 본류와 기수역인 하구로 구분된다(Kim et al., 2005).
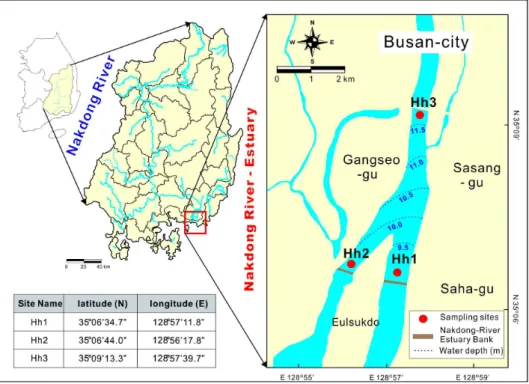
본 연구에서는 낙동강 하굿둑 상부에서부터 서부산낙 동강교 부근까지의 담수역을 연구지역으로 선정하고 총 3개의 지점을 조사하였다. Hh1은 을숙도 서쪽에 위치한 좌안배수문에서 상류를 향해 약 0.27 km 지점에, Hh2는 을숙도 동쪽에 위치한 우안배수문에서 상류를 향해 약 0.26 km의 지점에 위치하며, Hh3은 서부산낙동강교에 인접한 지점에 위치한다. Hh3 지점의 수심은 11.6 m, Hh1과 Hh2 지점의 수심은 각 9.0 m, 9.9 m로 측정되어 상류에서 하류로 갈수록 수심이 감소하는 양상을 보이고 있다(Fig. 1).
3. 재료 및 방법 3.1. 시료 채취
본 연구에서는 총 3개의 지점에서 2018년부터 2020 년까지 연 1회, 총 3회에 걸쳐 수질오염공정시험기준(ES 04160.1, ES 04160.2; 2017)에 따라 중력식 퇴적물 시 료 채취기인 포나 그랩(ponar grab)을 이용하여 상부 약 3 cm 깊이의 해당하는 표층 퇴적물을 채취하였다. 채취 된 시료는 2 mm와 0.15 mm 체를 이용하여 체걸음을 실 시하였으며, 이 중 2 mm 체를 이용한 시료는 자연 건조
Fig. 1. Sampling sites, water depth, and geographical position of the study area.
후 분쇄기(Pulverisette 6, Fritsch, Germany)를 이용하 여 분말화하여 금속류 분석에 이용하였다. 그리고 0.15 mm 시료는 습시료와 건조 후 분말화된 시료로 구분하여 습시료는 입도, 화학적산소요구량(Chemical Oxidation Demand, COD), 완전연소가능량(Ignition Loss, IL) 분석에 이용하였고, 분말 시료는 총유기탄소(Total Organic Carbon, TOC), 총질소(Total Nitrogen, TN) 분석에 이용하였다.
3.2. 분석 방법
본 연구에서 실시된 모든 항목의 분석은 수질오염공 정시험기준 중 하천·호소 등 퇴적물 공정시험기준에 따 라 분석하였다(MOE, 2017).
퇴적물의 금속류 분석은 ES 04870에 따라 퇴적물이 완전분해 되도록 시료를 테플론 재질의 비커에 넣고 질 산(HNO3), 과염소산(HClO4), 불산(HF)을 2:1:2 비율로 첨가 후 흑연 블록에서 전처리하였다. 전처리 과정을 거 친 시료는 유도결합 플라즈마 질량 분석기인 ICP-MS(820-MS, Analytik jena, Germany)를 이용하
여 Cr, Ni, Cu, Zn, Pb 및 Al(ES 04878.2, ES 04873.2, ES 04871.2, ES 04876.2, ES 04872.2, ES 04880.2) 총 6종의 금속을 분석하였다.
입도 분석(ES 04853.1)은 과산화수소(H2O2)를 이용 하여 유기물을 제거하는 전처리 후 세 방향 회절 패턴을 바탕으로 입도를 측정하는 입도 분석기(S3500, Microtrac, USA)를 이용하여 분석하였으며, 측정된 결 과는 모래(sand), 실트(silt), 점토(clay)로 구분하여 입자 크기별 함량을 구하였다.
IL 분석(ES 04852.1)은 110℃에서 건조시킨 습시료 의 무게를 측정한 후 550℃에서 2시간 동안 가열하여 소 실된 무게의 차이를 백분율로 나타내었으며, COD 분석 (ES 04854.1)은 0.1 N 과망간산포타슘(KMnO4)을 넣 고 수욕상에서 가열하여 식힌 후 여과를 거쳐 과망간산 포타슘에 의하여 유리된 아이오딘의 양을 0.1 N 티오황 산나트륨(Na2O3S2)으로 적정하여 함량을 구하는 망간법 (COD-permanganate)을 이용하였다. TOC(ES 04861.1) 와 TN(ES 04862.1) 함량은 아황산 수용액(H2SO3)으로 무기탄소를 제거하는 전처리 과정을 거친 후 고온 연소
class
a)metals d b)organic matter
Cr (mg/kg)
Ni (mg/kg)
Cu (mg/kg)
Zn (mg/kg)
Pb (mg/kg)
IL (%)
COD (%)
TOC (%)
TN (mg/kg)
NIER
Ⅰ ≤112 ≤53 ≤60 ≤363 ≤65 - - - -
Ⅱ ≤224 ≤87.5 ≤228 ≤1,170 ≤154 - - - -
Ⅲ ≤991 ≤330 ≤1,890 ≤13,000 ≤459 - - - -
Ⅳ >991 >330 >1,890 >13,000 >459 >13 - - >5,600
Ontario
LEL 26 16 16 120 31 - - 1 550
SEL 110 75 110 820 250 - - 20 4,800
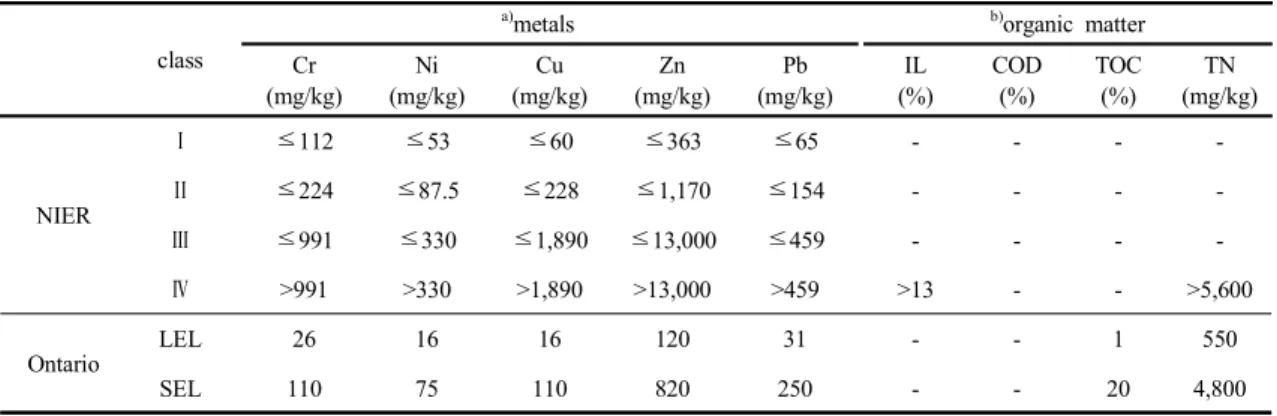
Table 1. Sediment pollution evaluation standards of NIER and Ontario sediment quality guidelines (a : standards of metals, b : standards of organic matter)
(high temperature combustion) 원리인 원소분석기 (Vario MACRO, Elementar, Germany)를 이용하여 분 석하였다.
3.3. 오염도 평가 방법 3.3.1. 환경기준 비교
퇴적물 내 유기물과 금속류의 오염도를 평가하기 위 하여 많은 선행 연구들은 퇴적물 환경기준을 활용하고 있다(Kim et al., 2015; Kim et al., 2017; Yang et al., 2020; Yang et al., 2021). 본 연구에서도 오염도 평가를 위하여 퇴적물 환경기준과의 비교를 실시하였으며, 저서 생물에 미치는 영향에 따라 오염도를 분류한 국립환경과 학원 퇴적물 오염평가 기준과 캐나다 온타리오 환경부의 퇴적물 환경기준을 이용하였다(Table 1). 국립환경과학 원 퇴적물 오염평가 기준은 퇴적물의 금속 함량이 저서 생물에 미치는 영향에 따라 저서생물에 독성이 나타날 가능성이 거의 없는 I 등급, 독성이 나타날 가능성이 있 는 II 등급, 독성이 나타날 가능성이 비교적 높은 III 등 급, 독성이 나타날 가능성이 매우 높은 IV 등급의 총 4 단계로 분류하고 있다(NIER, 2015). 캐나다 온타리오 환경부에서 제시한 담수 퇴적물 환경기준은 금속류 및 유기물의 함량에 따라 퇴적물이 저서생물에 대한 악영향 을 확률적으로 표현하였다. LEL (Lowest Effect Level) 은 대부분의 저서생물이 견딜 수 있는 오염 수준이며, SEL (Severe Effect Level)은 저서생물에 악영향을 미 칠 수 있는 함량으로 이를 초과하는 퇴적물은 심하게 오 염된 것으로 간주한다(CCME, 1995).
3.3.2. 오염지수 산출 3.3.2.1. 금속류 오염지수
퇴적물 금속류 오염은 퇴적물에 인공적 또는 자연적 인 요인의 영향과 금속류 오염의 정도를 보여주기 위하 여 정량적인 요인을 사용하여 평가한다(Alghamdi et al., 2019). 금속의 오염도를 파악하기 위해 EF, Igeo, PLI 등과 같은 오염지수 산출을 이용한 방법이 주로 사용되 고 있다(Hwang et al., 2015; Yang et al., 2018; Kim et al., 2019; Hoang et al., 2020). 이와 같이 본 연구에서 도 분석된 금속류 함량을 바탕으로 퇴적물 내 금속의 농 축 및 오염도를 파악하기 위하여 EF, Igeo와 PLI를 산출 하였다.
EF는 지각물질 중 높은 함량으로 존재하거나 보존적 성질을 가진 표준화 원소를 이용하여 미량금속의 농축 정도에 따라 오염을 평가하는 방법으로 본 연구에서는 Al를 표준화 원소로 사용하였으며, 식 (1)과 같이 계산된 다(Bruland et al., 1974; Hwang et al., 2014).
(1)
식 (1)에서 (Cmetal/Creference)sample는 연구지역 내 퇴적 물 시료 중 Al에 대한 각 금속류의 농도비이며, (Cmetal/Creference)background는 배경농도 내 Al에 대한 각 금 속류의 농도비를 나타낸다. 여기서 Al의 배경농도는 Taylor(1964)가 제시한 값을 사용하였으며, 나머지 금속 류의 배경농도는 국립환경과학원에 보고된 하천 배경
농도를 이용하였다(NIER, 2011). EF 값은 1.5 이하일 경우 오염이 되지 않은 자연적인 농도임을 의미하고, 1.5 보다 클 경우에는 대기나 하천을 통해 유입되는 각 금속 류에 의한 인위적 오염이 있음을 의미한다(Zhang and Liu, 2002). EF는 총 7가지 등급으로 나누어지며, EF 값 이 1 미만일 경우 no enrichment, 1~3 사이는 minor enrichment, 3~5는 moderately enrichment, 5~10은 moderately severe enrichment, 10~25는 severe enrichment, 25~50은 very severe enrichment 그리고 50을 초과할 경우 extremely severe enrichment으로 구 분된다(Grant and Middleton, 1990; Loska et al., 1997).
Igeo는 연구지역 내 지질 특성을 반영한 오염 상태를 파악할 수 있으며 식 (2)와 같이 계산된다(Muller, 1979).
log
×
(2) 여기서 Csample은 측정된 퇴적물 내 금속 함량을,Cbackground는 해당 금속의 배경농도를 의미하며 Igeo 값
은 총 7가지 등급으로 나누어진다. 0 이하의 값은 비오염 (practically unpolluted), 0~1 사이는 비오염에서 보통 오염(practically unpolluted~moderately polluted), 1~2는 보통 오염(moderately polluted), 2~3는 보통에 서 강한 오염(moderately polluted~strongly polluted), 3~4는 강한 오염(strong polluted), 4~5는 강한 오염에 서 매우 강한 오염(strongly~very strongly polluted), 5 를 초과할 경우 매우 강한 오염(very strong polluted)으 로 구분된다.
PLI는 각 금속류에 대한 오염도 평가를 하는 EF, Igeo 와 달리 모든 중금속을 포함하여 해당 지역에 분포하는 전체적인 오염도를 평가할 수 있는 방법으로 식(3)과 같 이 계산된다.
×
×⋯
(3)
식 (3)에서 n은 분석에 사용된 금속류의 총 개수를 의 미하며 PLI 값이 1 이하의 경우 오염되지 않음 (unpolluted)을 의미하고, 1 보다 크면 오염(polluted)을 나타내며 값이 클수록 오염도가 높은 것으로 판단한다 (Tomlinson et al., 1980).
3.3.2.2. 유기물 오염지수
퇴적물의 유기물 오염지수를 평가하기 위하여 Org-index를 사용하였으며, 식 (4)와 같이 산출된다. 여 기서 Org-N은 무게비로 산정된 유기질소의 함량으로 식 (5)와 같이 구할 수 있다(Yu et al., 2010).
× (4)
× (5)
Org-index가 0.05 미만일 때는 unpolluted, 0.05~0.35 사이는 unpolluted~marginally polluted, 0.35~0.75 사이는 moderately polluted, 0.75를 초과할 시 heavily polluted에 해당된다.
3.4. 통계 분석 방법
낙동강 하구 퇴적물의 지화학적 특성을 파악하기 위 해 SPSS 20.0 version를 이용하여 군집 분석과 상관 분 석을 실시하였다. 군집 분석은 군집 대상 사이의 정보 손 실을 최소화할 수 있는 계층적 군집 분석(hierarchical clustering analysis)의 Ward’s method를 적용하였으며, 거리 측정은 모든 변수의 차이를 제곱하여 합산해서 결 정하는 유클리디안 제곱거리(squared euclidian distance) 방법을 사용하여 데이터의 유사도를 바탕으로 각 cluster 을 설정하였다. 상관 분석은 2개 이상의 변수 사이에 존 재하는 상관관계의 밀접한 정도를 측정하는 분석 방법으 로 피어슨 상관계수(Pearson correlation coefficient, r) 를 이용하였다(Noh, 2005).
4. 결과 및 고찰
4.1. 금속류 함량 및 오염도
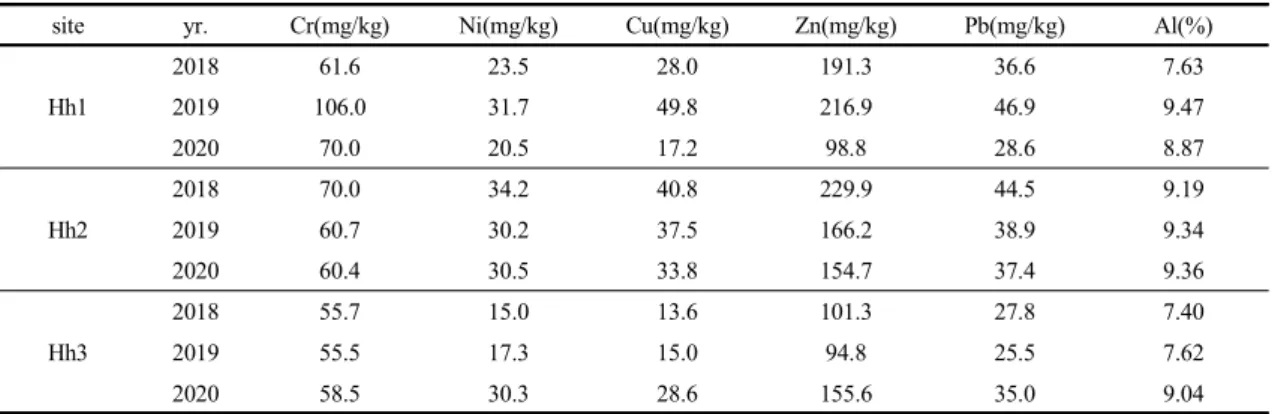
6종의 금속류 함량 분석 결과를 Table 2에 나타내었 다. Al은 모든 지점에서 7.40~9.47%의 범위로 변화하 며, 오염도 평가에 이용된 5종의 금속류 함량은 평균적으 로 Zn (avg. 156.61 mg/kg) > Cr (avg. 66.49 mg/kg) >
site yr. Cr(mg/kg) Ni(mg/kg) Cu(mg/kg) Zn(mg/kg) Pb(mg/kg) Al(%)
Hh1
2018 61.6 23.5 28.0 191.3 36.6 7.63
2019 106.0 31.7 49.8 216.9 46.9 9.47
2020 70.0 20.5 17.2 98.8 28.6 8.87
Hh2
2018 70.0 34.2 40.8 229.9 44.5 9.19
2019 60.7 30.2 37.5 166.2 38.9 9.34
2020 60.4 30.5 33.8 154.7 37.4 9.36
Hh3
2018 55.7 15.0 13.6 101.3 27.8 7.40
2019 55.5 17.3 15.0 94.8 25.5 7.62
2020 58.5 30.3 28.6 155.6 35.0 9.04
Table 2. The contents of metals (Cr, Ni, Cu, Zn, Pb, and Al) in the surface sediments of the study area
Pb (avg. 35.69 mg/kg) > Cu (avg. 29.37 mg/kg) > Ni (avg. 25.91 mg/kg)의 범위로 분포한다. 금속류 중 Pb, Cu, Cr은 2019년 Hh1 지점에서 최대 함량을 보였으며, Zn, Ni은 2018년 Hh2 지점에서 최대 함량이 나타났다.
지점마다 금속류 함량은 다소 차이가 있으나 시간에 따 른 증가와 감소 변화는 뚜렷하지 않은 것으로 나타났다.
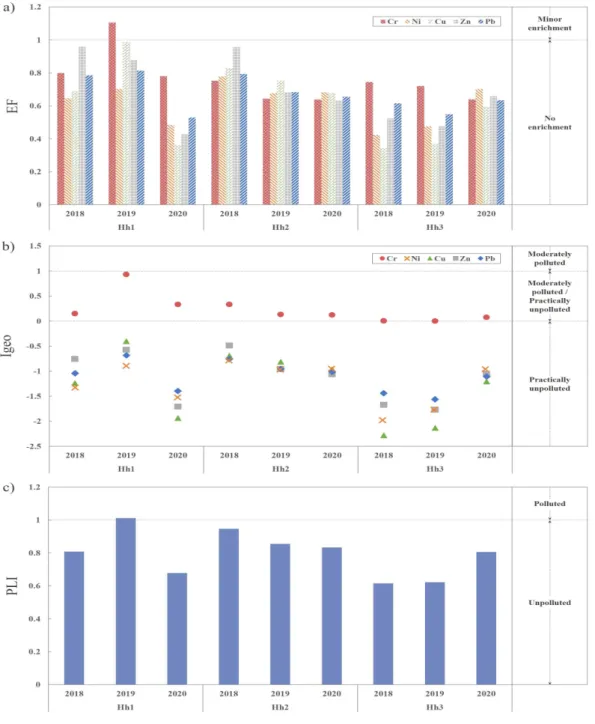
연구지역에서 조사된 금속류 함량을 Table 1a에 제시 된 국내외 퇴적물 환경기준과 비교하였다. 국립환경과학 원 퇴적물 오염평가 기준과 비교한 경우, 모든 금속류 항 목의 오염도는 I 등급으로 저서생물에 독성이 나타날 가 능성이 거의 없는 것으로 나타났다. 캐나다 온타리오 환 경부의 담수 퇴적물 환경기준과 비교한 경우, Ni은 2018 년 Hh3 지점에서, Cu는 2018년과 2019년 Hh3 지점, Zn과 Pb은 2020년 Hh1 지점과 2018년, 2019년 Hh3 지점에서 LEL 기준치 미만이었으며 이를 제외한 모든 지점에서는 LEL 이상 SEL 미만으로 저서생물에 악영향 을 미칠 수 있는 심각한 오염은 아닌 것으로 나타났다. 결 과적으로 금속류에 의한 오염은 저서생물에 미치는 영향 이 매우 미약한 것으로 평가된다. EF 산출 결과, 2019년 Hh1 지점 Cr은 1.11로 minor enrichment에 해당된다.
이를 제외한 나머지 항목은 전 지점에서 1 이하의 값을 보이며 no enrichment 등급에 해당된다(Fig. 2a). Igeo 산출 결과 또한 EF 결과와 유사한 양상을 보이고 있으며 대부분의 금속류는 음의 값으로 산출되어 practically unpolluted 상태를 보였으나, Cr의 경우 모든 지점에서 0~1 사이의 값을 나타내며 moderately polluted로 나타 났다(Fig. 2b). 전체적인 오염도를 평가하기 위해 PLI를 산출한 결과, 2019년 Hh1 지점에서 기준 1을 초과하였
으나 나머지 지점에서는 기준치 미만의 값으로 인위적 오염이 존재하지 않는 것으로 나타났다(Fig. 2c). 따라서 연구지역은 Cr을 제외한 다른 금속류는 인위적 영향에 의한 오염은 극히 미약한 것으로 유추된다.
4.2. 입도 조성 및 조직변수
입도 분석 결과 및 조직변수를 산출하여 Table 3에 나 타내었다. Hh1 지점은 모래의 함량이 90% 이상으로 나 타나고 Hh3 지점은 모래 함량이 약 85~95%로 Hh1 지 점과 유사하게 분포하며 Hh2 지점은 실트 함량이 약 50~77% 사이로 실트가 우세하다. Hh2 지점은 2019년 도 모래 함량의 증가로 실트가 감소하며 조립해진 후 세 립해지는 경향이 나타나고 Hh3 지점은 2020년도 실트 함량 증가로 인해 Hh1 지점보다 상대적으로 세립한 경 향이 나타났다. Hh1과 Hh3 지점은 모래가 우세하며 Hh2 지점은 실트가 우세한 경향을 나타내며 연구지점 중 가장 세립한 퇴적물로 구성되어 있다. 입도 분석 결과 를 바탕으로 Folk and ward(1957)법에 따라서 평균입 도(mean grain size, Mz), 분급(sorting, So), 왜도 (skewness, Sk)를 산출하였다. 평균입도는 Hh1 지점에 서 1.4Ф~1.8Ф로 중립사, Hh3 지점은 2.3Ф~2.6Ф로 세 립사로 나타났다. Hh2 지점은 4.6Ф~6.5Ф의 분포를 보 이며 실트로 나타났다. 분급은 입도의 분포양상을 나타 내는 것으로 Hh1 지점은 0.66Ф~1.03Ф 범위로 moderately well sorted에서 poorly sorted에 해당되고 Hh2 지점은 1.62Ф~2.17Ф 범위로 poorly sorted에서 very poorly sorted에 속하며, Hh3 지점은 0.94Ф~1.51 Ф, moderately sorted에서 poorly sorted에 해당된다.
Fig. 2. (a) The EF (Enrichment factor), (b) Igeo (Index of geoaccumulation) and (c) PLI (Pollution load index) in the surface sediments of the study area.
site yr. sand (%)
silt (%)
clay (%)
mean grain size(Ф)
sorting skewness
value
(Ф) type value type
Hh1
2018 93.6 6.4 0.0 1.4 1.00 poorly sorted 0.19 positively
skewness
2019 96.3 3.6 0.1 1.7 0.66 moderately well
sorted 0.23 positively skewness
2020 97.0 3.0 0.0 1.8 1.03 poorly sorted 0.22 positively
skewness
Hh2
2018 6.8 76.2 17.0 6.5 1.62 poorly
sorted -0.01 symmetrical
2019 40.8 53.7 5.5 4.6 2.17 very poorly
sorted -0.04 symmetrical
2020 20.1 70.1 9.8 5.6 1.82 poorly
sorted 0.04 symmetrical
Hh3
2018 91.1 8.9 0.0 2.6 1.03 poorly sorted 0.15 positively
skewness
2019 94.9 5.1 0.0 2.4 0.94 moderately sorted 0.13 positively
skewness
2020 85.4 14.1 0.5 2.3 1.51 poorly sorted 0.38 very positively
skewness Table 3. Grain size parameter (mean grain size, sorting, and skewness) in the surface sediments of the study area
2019년도를 제외한 모든 지점에서 poorly sorted로 나 타났다. 왜도는 환경 변화를 예민하게 나타내는 척도로 사용한다(Folk and Ward, 1957). Hh1 지점은 positively skewed, Hh2 지점은 symmetrical, Hh3 지 점은 positively skewed에서 very positively skewed에 해당된다. Hh2 지점은 왜도 값이 0을 중심으로 대칭성이 나타나고 음의 값을 가지며 세립질 퇴적물이 나타나는 지역이다. 이는 퇴적물을 공급·운반하는 물리적 작용이 비교적 약한 저에너지 환경에서 퇴적작용이 활발하게 일 어나는 것을 시사한다(Hails, 1967; Folk, 1974).
이와 같은 결과로 보아 Hh1과 Hh2 지점은 하굿둑에 근접해 있는 유사한 환경임에도 불구하고 Hh1 지점은 조립질 퇴적물이 우세한 Hh3 지점과 유사한 입도 조성 을 보이고 있으며, Hh2 지점은 상대적으로 세립한 입도 분포를 보이고 있다. 현재 낙동강 하굿둑은 수위 조절을 위하여 간조시마다 좌안배수문을 상시 개방하고 있으며 (MOE, 2015), 우안배수문 방류에 따른 하류 생태 영향 을 최소화하기 위하여 좌안배수문 만을 통하여 개방하고 우안배수문은 추가적으로 개방하고 있다(An, 2014). 이
와 같은 하굿둑 배수문 운영방식에 의하여 비교적 높은 빈도로 개방되고 있는 좌안배수문의 상류에 위치하는 Hh1 지점에서는 유속 등의 물리에너지 증가로 세립질 퇴적물이 확산 및 이동된 반면, 우안배수문의 상류에 위 치하는 Hh2 지점은 저에너지 환경으로 인하여 세립질 퇴적물이 비교적 우세하게 나타나며 두 지점 간 입도 조 성의 차이가 뚜렷한 것으로 판단된다.
4.3. 유기물 함량 및 오염도
연구지역의 유기물 항목에 대한 지점별 함량을 Table 4에 나타내었다. Hh2 지점은 모든 유기물 항목에서 다른 지점보다 높은 함량을 보이고 있으며, 유기물 최대 함량 또한 2018년도에 Hh2 지점에서 나타났다. 시간에 따른 IL, COD, TOC의 함량 변화를 보면 Hh1 지점에서는 세 유기물 항목의 함량이 점차 감소하였으나, Hh2 와 Hh3 지점은 감소 후 증가하는 경향을 보이고 있다. TN 함량 은 모든 지점에서 감소 후 증가하는 경향이 나타나며, 2020년도 Hh1 지점의 TN을 제외하면 연구지역의 모든 유기물 함량의 시간적 변화는 실트 함량의 시간적 변화 와 동일한 경향을 나타내었다. 이와 같은 결과를 연구
site yr. IL (%)
COD (%)
TOC (%)
TN (mg/kg)
Hh1
2018 1.78 0.43 0.38 1034
2019 0.90 0.17 0.14 776
2020 0.80 0.12 0.12 1128
Hh2
2018 10.56 2.92 2.19 3665
2019 5.98 1.86 1.10 1925
2020 7.99 2.22 1.65 2952
Hh3
2018 2.23 0.37 0.36 814
2019 1.26 0.19 0.19 794
2020 2.40 0.40 0.55 1572
Table 4. The contents of organic matter (IL, COD, TOC, and TN) in the surface sediments of the study area
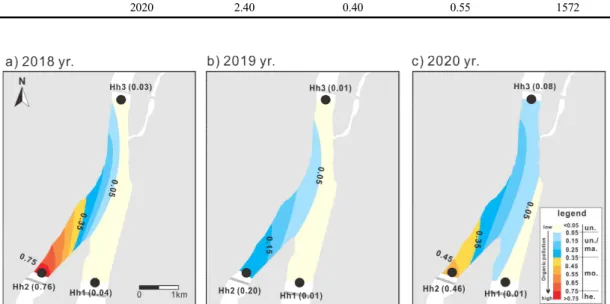
Fig. 3. Temporal and spatial variations of Org-index in surface sediments of the study area (un. : unpolluted, un./ma. : unpolluted/marginally polluted, mo. : moderately polluted, he. : heavily polluted).
지역과 유사한 환경적 특성을 가지는 영산강 하굿둑 상 부의 담수역 내 세 지점의 유기물 함량과 비교하였다. 영 산강 하굿둑 상부의 TOC 및 TN 함량은 각 1.10~1.13%
와 1500~1700 mg/kg의 범위로 나타났으며(Woo et al., 2014), 두 항목 모두 영산강 하구보다 Hh1과 Hh3 지점 에서 상대적으로 낮은 함량을 보이고 있는 반면, Hh2 지 점 함량은 비교적 높은 함량으로 나타났다.
한편, 유기물의 오염도 평가를 위해 Table 1b에 제시 된 국내 퇴적물 및 캐나다 온타리오 환경부의 담수 퇴적 물 오염 기준과 비교하였다. 국내 퇴적물 오염평가 기준 에 따르면 IL과 TN의 함량은 전 지점에서 Ⅳ등급 기준치
이내로 나타났다. 캐나다 온타리오 환경부의 담수 퇴적 물 환경기준으로 평가하였을 때, TOC는 Hh2 지점에서 LEL 이상 SEL 미만으로 나타나며, 그 외의 지점은 LEL 미만으로 평가되었다. TN은 모든 지점에서 LEL 이상 SEL 미만으로 나타났다.
또한 퇴적물 내 유기물 오염지수를 평가하기 위하여 Org-index를 산출하여 Fig. 3에 도시하였다. Hh1 지점 의 Org-index는 0.01~0.04의 범위를 보이고 있으며 시 간에 따른 변화 없이 unpolluted 등급으로 나타났다.
Hh3 지점은 0.01~0.08에서 분포하며 polluted에서 unpolluted/marginally polluted로 나타났으나 시간적
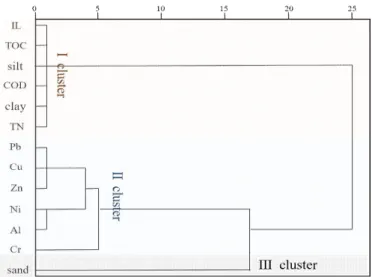
Fig. 4. Dendrogram of sediment composition, grain size parameters (Mz, So, and Sk), organic matter (IL, COD, TOC, and TN), and metals (Cr, Ni, Cu, Zn, Pb, and Al) using hierarchical clustering analysis in the study area.
Fig. 5. Pearson correlation coefficient among the sediment composition, grain size parameters (Mz, So, and Sk), organic matter (IL, COD, TOD, and TN), metals (Cu, Pb, Ni, Cr, and Zn), Org-index and PLI.
변화는 크지 않았다. 반면에 Hh2 지점은 상대적으로 높 은 값인 0.20~0.76을 보이며 연구기간 동안 heavily polluted, unpolluted/marginally polluted, moderately polluted로 변화하며 세 지점 중 시간에 따른 유기물 오
염도의 변화가 가장 뚜렷하게 나타났다. 즉, Hh2 지점은 상대적으로 유기물에 의한 오염이 높게 나타났으며, 이 는 Hh2 지점에 근접한 우안배수문이 간헐적으로 운영되 어 하굿둑 상부에 유기물의 정체가 뚜렷하게 나타난다고
보고한 Kim and An(2017)의 연구결과와 일치한다.
4.4. 통계 분석
입도, 유기물 및 금속류 등 총 13개 분석 항목에 대하 여 실시된 군집 분석 결과를 덴드로그램(dendrogram)으 로 나타내었다. 분석 결과, 항목들은 3개의 cluster로 구 분되었다. Ⅲ cluster은 모래만으로 구성되어있고, Cr, Ni, Cu, Zn, Pb 및 Al은 서로 간에 유사성을 보이며 Ⅱ cluster로 분류되었으며, 특히 Pb-Cu-Zn과 Ni-Al 간의 유사성이 높은 것으로 나타났다. Ⅰ cluster은 실트, 점토, IL, COD, TOC 및 TN으로 분류되어 세립질 퇴적물은 유기물과 매우 높은 유사성을 보이고 있다(Fig. 4).
상관 분석은 입도 조성 및 조직변수, 유기물 함량 및 Org-index, 금속류 함량 및 PLI 간의 상관계수를 산출하 여 Fig. 5에 나타내었다. 상관 분석 결과, 왜도는 모래와 양의 상관관계 (r = 0.761)를 나타냈으며 실트 (r = 0.765) 및 점토 (r = 0.704)와는 음의 상관관계로 나타났 다. 모든 유기물 항목과 모래는 음의 상관관계, 실트와 점 토는 양의 상관관계로 0.9 이상의 높은 상관계수가 나타 났다. 이와 같은 결과는 세립질 퇴적물과 유기물이 밀접 한 관계가 있다는 선행 연구와 일치한다(Horowitz, 1991; Kim et al., 2005). Org-index는 입도와 유기물과 강한 상관관계를 보였고, 평균입도와 강한 양의 상관관 계를 보이고 있다. 금속은 입도와 약한 상관관계를 보이 며, 유기물 역시 유의할만한 상관관계는 나타나지 않았 다.
통계 분석 결과 군집 분석은 유기물과 세립질 퇴적물 사이의 유사성이 나타났으며 상관 분석 역시 유기물과 세립질 퇴적물은 강한 양의 상관관계를 보이고 있다. 퇴 적물 입도는 유기물의 분포와 함량에 중요한 영향을 미 친다고 알려져 있으며(Calvert et al., 1995), 이와 같이 연구지역의 유기물 함량은 세립질 퇴적물이 강한 영향을 미치는 것으로 판단된다.
5. 결 론
낙동강 하구 표층 퇴적물의 지화학적 특성 및 오염도 변화를 파악하기 위하여 2018년부터 2020년 동안 총 3 회에 걸쳐 3개의 지점에서 금속류 6종, 입도 및 유기물 분석을 실시하였다.
금속류 함량은 지점에 따른 각 금속류 함량의 증가와
감소 경향이 뚜렷하지 않아 시간적 변화는 크지 않은 것 으로 나타났다. EF, Igeo 및 PLI는 Cr에 의한 오염은 다 소 존재하고 있으나 대부분 금속류에 의한 인위적인 오 염은 미약한 것으로 나타났다.
입도 분석 결과 Hh1과 Hh3 지점은 모래가 우세하고 Hh2 지점은 실트가 우세한 경향이 나타나며 연구지점 중 가장 세립한 퇴적물로 구성되어있다. Hh2 지점은 음 의 왜도 값으로 나타나며 비교적 저에너지 환경으로 인 하여 퇴적작용이 활발한 것으로 판단된다. 이는 Hh1 지 점에 인접한 좌안배수문보다 Hh2 지점에 인접한 우안배 수문의 개방 빈도가 낮으므로, 수문 운영 방식에 따라 지 점 간의 입도 분포 및 조성이 다르게 나타나는 것으로 사 료된다.
유기물(IL, COD, TOC, TN) 함량은 전반적으로 실 트 함량의 시간적 변화와 유사한 경향이 나타났다. 그리 고 국내·외 퇴적물 환경기준과 비교하면 저서생물이 악 영향을 받는 심각한 오염상태는 아닌 것으로 나타났으며, Org-index는 Hh2 지점에서 0.20~0.76으로 다른 지점에 비해 높은 값을 보이고 있다. 즉, 우안배수문과 인접하고 실트 함량이 높은 Hh2 지점에서 비교적 높은 유기물 오 염이 내재되어 있는 것을 의미한다.
통계 분석 결과, 군집 분석은 3개 그룹으로 나타나며
Ⅰ cluster은 실트 및 점토와 유기물 항목, Ⅱ cluster는 금속류, Ⅲ cluster은 모래로 분류된다. 상관 분석 결과, 금속류는 다른 항목들과 비교적 약하거나 무시할 수 있 는 수준이고, 세립질 퇴적물(실트, 점토)과 음의 상관관 계로 나타났다. 유기물과 세립질 퇴적물은 군집 분석에 서 유사성을 보이며 상관 분석에서도 강한 양의 상관관 계가 나타나 유기물은 세립질 퇴적물에 강한 영향을 받 는 것으로 판단된다.
연구기간 동안 모든 지점은 금속류에 의한 오염은 미 약하며 우안배수문의 간헐적 개방에 따라 Hh2 지점에 세립질 퇴적물이 비교적 높은 함량으로 분포하므로 유기 물에 의한 오염도가 높은 것으로 판단된다. 이와 같이 연 구지역에 건설된 하굿둑과 같은 인공구조물은 퇴적환경 을 변화시키는 주요인으로 작용하며, 저에너지 환경으로 인한 세립질 퇴적물의 증가가 유기물 오염에 큰 영향을 미치는 것으로 사료된다. 또한 본 연구에서 제시된 결과 들은 낙동강 하구뿐만 아니라 향후 하천, 연안 등의 지역 에서 표층 퇴적물을 관리하고 평가하는 중요한 참고자료에
활용될 수 있을 것으로 생각된다.
감사의 글
본 논문은 환경부의 재원으로 국립환경과학원의 지원 을 받아 수행하였습니다(NIER-2021-01-01-042).
REFERENCES
Alghamdi, B. A., Mannoubi, I. E., Zabin, S. A., 2019, Heavy metals’ contamination in sediments of Wadi Al-Aqiq water reservoir dam at Al-Baha region, KSA: Their identification and assessment, Hum. Ecol. Risk Assess., 25, 793-818.
An, S. D., 2014, Investigation of flood stage on the upstream waterfront area in floodplain depending on the operation rule of the Nakdong River estuary barrage, Crisisonomy, 10, 139-148.
Bruland, K. W., Bertine, K., Koide, M., Golberg, E. D., 1974, History of metal pollution in southern California coastal zone, Environmental Science and Technology, 8, 425-432.
Byun, D. S., Wang, X. H., Holloway, P. E., 2004, Tidal characteristic adjustment due to dyke and seawall construction in the Mokpo coastal zone, Korea, Estuar.
Coast. Shelf Sci., 59, 185-196.
Calvert, S. E., Pedersen, T. F., Naidu, P. D., von Stackelberg, U., 1995, On the organic carbon maximum on the continental slope of the eastern Arabian Sea, Journal of Marine Research, 53, 269-296.
Canadian Council of Ministers of the Environmental Protection (CCME), 1995, Protocol for the derivation of canadian sediment quality guidelines for the protection of aquatic life, EPA-98E, CCME, Canada.
Chang, J. W., Lee, G. H., Harris, C. K., Song, Y. S., Figueroa, S. M., Schieder, N. W., Lagamayo, K. D., 2020, Sediment transport mechanisms in altered depositional environments of the anthropocene Nakdong Estuary: a numerical modeling study, Marine Geology, 430, 106364.
Choi, J. H., An, S. U., Kim, S. H., Shin, J. H., Lee, H. J., Hyun, J. H., Mok, J. S., 2020, Biogeochemical properties of Phosphorus during summer in the sediment of Yeongsan River, lake and estuary, J. Korean Soc. Mar.
Environ. Energy, 23, 286-296.
Chung, S. Y., Venkatramanan, S., Park, N., Ramkumar, T., Sujitha, S. B., Jonathan, M. P., 2016, Evaluation of physico-chemical parameters in water and total heavy metals in sediments at Nakdong River Basin, Korea, Environ. Earth. Sci., 75, 1-12.
Dekov, V. M., Komy, Z., Araujo, F., Put, A. V., Grieken, R.
V., 1997, Chemical composition of sediments, suspended matter, river water and ground water of the Nail(Aswan-Sohag traverse), Sci. Total Environ., 201, 195-210.
Fernandes, L. L., Nayak, G. N., 2012, Heavy metals contamination in mudflat and mangrove sediments (Mumbai, India), Chemistry and Ecology, 28, 435-445.
Folk, R. L., Ward, W. C., 1957, Brazos River bar: a study in the significance of grain size parameters, J. Sediment.
Petrol., 27, 3-26.
Folk, R. L., 1974, Petrology of sedimentary rocks, Hemphill publishing Co., Austin, Texas, 1-182.
Grant, A., Middleton, R., 1990, An Assessment of metal contamination of sediments in the Humber esturay, Estuar. Coast. Shelf Sci., 31, 71-85.
Hails, J. R., 1967, Significance of statistical parameters for distinguishing sedimentary environments in New South Wales, Australia, J. Sediment. Petrol., 37, 1059-1069.
Hoang, H. G., Lin, C., Tran, H. T., Chiang, C. F., Bui, X. T., Cheruiyot, N. K., Shern, C. C., 2020, Heavy metal contamination trends in surface water and sediments of a river in a highly-industrialized region, Environ. Technol.
Innov., 21, 101043.
Horowitz, A. J., 1991, A Primer on sediment-trace element chemistry, 2nd ed., Lewis Publishers Inc., Michigan, 1-136.
Hwang, D. W., Lee, I. S., Choi, M. K., Choi, H. G., 2014, Distribution and pollution assessment of organic matter and trace metals in surface sediment around Ulsan harbor, J. Korean Soc. Environ. Anal., 17, 146-160.
Hwang, D. W., Lee, I. S., Choi, M. K., Kim, C. S., Kim, H. C., 2015, Evaluation of pollution level for organic matter and trace metals in sediments around Taehwa River estuary, Ulsan, Korean J. Fish Aquat. Sci., 48, 542-554.
Kim, B. O., Lee, S. R., Kim, B. K., 2011, Temporal change of grain size of the beach sediments in the Sinjado, Nakdong River estuary, J. Korean Soc. Coast. Ocean Eng., 23, 304-312.
Kim, G. H., Jeong, W. H., 2007, Management and
remediation technologies of contaminated sediment, J.
Soil Groundw. Environ., 12, 1-9.
Kim, G. Y., Lee, C. W., Yoon, H. S., Joo, G. J., 2005, Changes of distribution of bascular hydrophytes in the Nakdong River estuary and growth dynamics of Schenoplectus triqueter, waterfowl food plant, Kor. J.
Ecol., 28, 335-345.
Kim, S., Ahn, J. M., Lee, H. Y., Kim, B., Park, S. J., Kim, Y.
S., Yang, D. S., 2019, Contamination assessment of trace metals in surface sediments from the Nakdong River main stream, J. Korean Soc. Environ. Anal., 22, 10-21.
Kim, S., Ahn, J. M., Jung, K. Y., Lee, K. C., Kwon, H. G., Shin, D. S., Yang, D. S., 2017, Contamination assessment of heavy metals in river sediments (For the surface sediments from Nakdong River), J. Korean Soc.
Water Environ., 33, 460-473.
Kim, S., Lee, K. Y., Kim, J. E., Lee, K. C., Ahn, J. M., Lee, I.
J., Jung, K. Y., Im, T. H., 2015, Vertical variation of sediment structure and geochemical characteristics of core sediment in Nakdong River midstream, J. Korean Soc. Water Environ., 31, 304-312.
Kim, S. K., Lee, M. K., Ahn, J. H., Kang, S. W., Jeon, S. H., 2005, The effects of mean grain size and organic matter contents in sediments on the nutrients and heavy metals concentrations, J. Korean Soc. Environ. Eng., 27, 923-931.
Kim, S. Y., Ha, J. S., 2001, Sedimentary facies and environmental changes of the Nakdong River estuary and adjacent coastal area, J. Korean Fish. Soc., 34, 268-278.
Kim, Y. J., An, S. M., 2017, The impact of Nakdong estuarine barrage on distribution of Biogenic Silica (BSi) in surface sediment, J. Korean soc. Oceanogr., 22, 172-186.
Lee, I. C., Yoo, C. I., Yoon, H. S., 2007, Correlation between sandbar development and environmental factors in the Nakdong River estuary, J. Korean Soc. Mar. Environ.
Energy, 10, 13-20.
Lee, J. H., Yang, C. G., Han, K. S., Lee, T. Y., 2020, Estimation of heavy metal contamination level in Masan Bay and Nakdong Estuary sediments, J. Korean Geo-Environ. Soc., 21, 13-21.
Lee, K. Y., Kim, J. E., Lee, K. C., Lee, K. R., Lee, I. J., Im, T.
H., 2013, Characteristic of changes in DOC concentration according to concentration of organic
matter and suspended solids in the Nakdong River, J.
Korean Soc. Water Qual., 29, 540-550.
Lee, S. Y., Lee, S. J., Lee, K. H., Jeong, K. H., 2014, A Study on the effect by changing of water level in Nakdong River estuary, Water for future, 47, 54-58.
Lee, T. Y., 2019, Pollution intensity assessment of sediments obtained near Nakdong Estuary using pollution index for heavy metals, J. Korean Soc. Environ. Eng., 41, 100-108.
Loska, K., Cebula, J., Pelczar, J., Wiechula, D., Kwapulinski, J., 1997, Use of enrichment and contamination factors together with geoaccumulation indexes to evaluate the content of Cd, Cu, and Ni in the Rybnik water reservoir in Poland, Water, Air and Soil Pollution, 93, 347-365.
Ministry of Construction and Transportation (MOCT), 2006, River discharge measurement in the main stream of Nakdong River, Seoul, Korea.
Ministry of Environment (MOE), 2015, A Study for the restoration ecosystem of Nakdong River estuary, Pusan national university, Sejong, Korea.
Ministry of Environment (MOE), 2017, Standard methods for the examination of environmental pollution (water pollution), 2017-57, Sejong, Korea.
Muller, G., 1979, Schwermetalle in den sediment des Rheins-Veraenderungen seit 1971, Umschau Wissensch Tech., 79, 778-783.
National Institute of Environmental Research (NIER), 2011, Baseline concentrations of heavy metals in river sediments in Korea, Incheon, Korea.
National Institute of Environmental Research (NIER), 2015, Sediment pollution evaluation standard of river and lake, 2015-687, Incheon, Korea.
Noh, H. J., 2005, Multivariate analysis theory and practice using SPSS and Excel. Hyungseul publishing networks, Seoul, 187-469.
Park, H. S., Park, C. K., Song, M. K., Baek, K. H., Shin, S. K., 2001, Evaluation of water quality characteristic using factor analysis in the Nakdong River, J. Korean Soc.
Water Quali., 17, 693-701.
Taylor, S. R., 1964, Abundance of chemical elements in the continental crust: a new table, Geochimica et Cosmochimica Acta, 28, 1273-1285.
Thornton, I., 1983, Applied environmental geochemistry, Academic Press, London, 1-501.
Tomlinson, D. C., Wilson, J. G., Harris, C. R., Jeffrey, D.
W., 1980, Problems in the assessment of heavy metal
levels in estuaries and the formation of a pollution index, Helgol. Meeresunters., 33, 566-575.
Williams, J. R., Dellapenna, T. M., Lee, G. H., 2013, Shifts in depositional environments as a natural response to anthropogenic alterations: Nakdong Estuary, South Korea, Marine Geology, 343, 47-61.
Woo, J. S., Choi, H. S., Lee, H. J., Kim, T. H., 2014, Organic matter in the sediments of Youngsan River estuary:
distribution and sources, J. Environ. Sci. Int., 23, 1375-1383.
Yoon, H. S., Yoo, C. I., Kang, Y. K., Ryu, C. R., 2007, Delta development in the Nakdong River estuary: a literature survey, J. Ocean Eng. Technol., 21, 22-34.
Yang, H. J., Jeong, H. J., Bong, K. M., Jin, D. R., Kang, T.
W., Ryu, H. S., Han, J. H., Yang, W. J., Jung, H. J., Hwang, S. H., Na, E. H., 2020, Organic matter and heavy metal in river sediments of southwestern coastal Korea:
Spatial distributions, pollution, and ecological risk assessment, Marine Pollution Bulletin, 159, 111466.
Yang, Y. M., Chae, M. H., Lee, D. H., Park, Y. K., Seok, K.
S., 2021, Assessment of water quality and sediment pollution in Gap stream, J. Environ. Anal. Health Toxicol., 24, 13-25.
Yang, Y. M., Oh, D. Y., Kim, D. H., Lee, D. H., Kil, G. B., Cho, Y. H., Lee, H. R., Cheon. S. O., Chae, M. H., 2018, Pollution assessment in surface sediments of weir
constructed sections in Geum River, J. Korean Soc.
Environ. Anal.. 21, 125-138.
Yu, H., Zhang, W. B., Lu, S. Y., Yan, S. W., Hu, R. J., Chen, L., Zhang, L. L., Yu, J. P., 2010, Spatial distribution characteristics of surface sediments nutrients in Lake Hongze and their pollution status evaluation, Environ.
Sci., 31, 961-968.
Zhang, J., Liu, C. L., 2002, Riverine composition and estuarine geochemistry of particulate metals in China-weathering features, anthropogenic impact and chemical fluxes, Estuar. Coast Shelf Sci., 54, 1051-1070.
∙Researcher. Hye-Lyn Jeon
Nakdong River Environment Research Center, National Institute of Environmental Research [email protected]
∙Researcher. Hye-Yun Lee
Nakdong River Environment Research Center, National Institute of Environmental Research [email protected]
∙Senior researcher. Deuk-Seok Yang Nakdong River Environment Research Center, National Institute of Environmental Research [email protected]
∙Expert researcher. Shin Kim
Nakdong River Environment Research Center, National Institute of Environmental Research [email protected]