Print ISSN: 2288-4637 / Online ISSN 2288-4645 doi:10.13106/jafeb.2021.vol8.no8.0217
Factors Influencing Museum Visits: An Empirical Study in Vietnam
Lan NGUYEN
1Received: April 10, 2021 Revised: June 26, 2021 Accepted: July 04, 2021
Abstract
This paper aims to investigate factors affecting museum visits of young people in Vietnam by sending questionnaires to 2106 young people aged between 14–30 in Vietnam. With the support of SPSS version 2016 and STATA version 22, this paper illustrates that the empirical findings are appropriate with previous literature reviews. Research hypotheses such as learning purposes, intrinsic motivation, extrinsic motivation, and museum architecture are significantly and positively correlated with museum visits measured through customer visiting intention, customer satisfaction, and customer loyalty. Furthermore, males have a stronger interest in visiting the museum but a low re-visit intention than females. People with a higher level of education and higher income are also more likely to visit the museum than those with a lower level of education and income. Finally, the research results suggest that the family class and the orientation of parents play an important role in encouraging children to increase museum visiting intention; however, children of high-class families are less likely to have a high intention, satisfaction, and loyalty toward museum visitation than children of lower-class families.
Keywords: Museum Visit, Young People, Customer Behaviours, Vietnam JEL Classification Code: C31, M31, Z32
which acquires, conserves, researches, communicates and exhibits the tangible and intangible heritage of humanity and its environment for the purposes of education, study and enjoyment” (Were, 2017).
According to the United Nations Educational, Scientific and Cultural Organization (UNESCO), there are approximately 55,000 museums in the world showcasing a wide array of artifacts, arts, cultures, paintings, dramas, and much more (Were, 2017). In Vietnam, there are 134 museums including national museums, provincial museums, specialized museums, and non-public museums to date.
The result of the rapid growth of museums is the increase in the number of museum visitors especially tourists, which partly confirmed the popularity and essence of museums in Vietnamese society (William, 2009).
Museums have three main functions: research, education, and entertainment (William, 2009). Never- theless, the most important purpose of museums is education, which creates opportunities for the general public to learn new knowledge, and to reinforce traditional history (Hein, 1998). Famous international museums such as British Museum (London, England), Louvre (Paris, France), and National Palace Museum (Taipei, China) have weekly educational programs or exhibitions promoted on their website for learning purposes. The importance of museums for students lies in the fact that it helps to enrich
1
First Author and Corresponding Author. Faculty of Accounting and Auditing, Van Lang University, Ho Chi Minh City, Vietnam [Postal Address: 45 Nguyen Khac Nhu Street, Co Giang Ward, District 1, Ho Chi Minh City, 70000, Vietnam] Email: [email protected]
© Copyright: The Author(s)
This is an Open Access article distributed under the terms of the Creative Commons Attribution Non-Commercial License (https://creativecommons.org/licenses/by-nc/4.0/) which permits unrestricted non-commercial use, distribution, and reproduction in any medium, provided the original work is properly cited.
1. Introduction
In the context of human civilization development, a museum is an institution that cares for a collection of artifacts and other objects of artistic, cultural, historical, or scientific importance. Many public museums make these items available for public viewing through exhibits that may be permanent or temporary (Hein, 1998). Within the cultural sector, museums play an important role in the transmission of knowledge, learning, and understanding of cultural identities (Bal, 1996). In addition to a reflection of historical values, museums also play a substantial role in developing the national economy (Bal, 1996). There are many different definitions of museums, but the most common one given by ICOM (International Council Of Museums) is that
“A museum is a non-profit, permanent institution in the
service of society and its development, open to the public,
their learning in various fields, gain experiences in a new environment, and provide a unique setting for educators to teach students a wide range of topics. Museums in Vietnam, by contrast, tend to celebrate commemorative events or associate with schools to organize study tours for students. Therefore, the image of the museum is constantly ambiguous for Vietnamese people, especially the young generation. Furthermore, competition from other forms of entertainment, which better suit the needs and tastes of younger people, has been rising gradually. As a result, museums in Vietnam gradually lost their status, and museum visitation is considered as an activity only for tourists. Hence, the government cut down on the budget for museums. According to the statistics of GOV.UK, the number of people who visit the national museum every month is approximately 7 million, and around 12 million during exhibitions. Whilst, the number of visitors to museums in Vietnam is around 2,000 people per month, most of whom are tourists. However, the number of visitors to museums is around 10,000 people during tourist seasons (Were, 2017). A glance at the data reveals that the interest of Vietnamese people in museum visitation is still limited.
Therefore, museums in Vietnam must understand visitors’
behaviors, especially their decision-making process.
Over time, many studies have been conducted to find antecedents of museum visit behaviors. These authors have demonstrated that visit behaviors are primarily guided by psychological components (Kelly, 2010), motivational factors (Niemela, 2010; Williams, 2009), and learning factors (William, 2009). In particular, motivational and psychological factors are described as two key factors that influence the intention to visit a museum. Some previous studies have explained museum visits in terms of tourists’
satisfaction. A few studies explored factors such as aesthetic and architecture (Ray et al., 2014), cultural values (Rajesh, 2013; Williams, 2009), demographic (David, 1990), learning purposes (Kelly, 2009; Williams, 2009), motivational factors (Brida et al., 2013; Dragicevic et al., 2012), and service quality (Cheng & Wan, 2012). Museums are centers filled with information designed to enlighten and educate the curious mind. Especially for children, museums introduce them to unknown worlds, spark their imagination and provide them with valuable learning experiences. Hence, this study’s purpose is to conduct a broader empirical test, using both quantitative and qualitative methodologies to identify attributes influencing young people’s museum visit decisions. Furthermore, we provide recommendations that will help museum managers to create effective policies to attract young visitors. To achieve our research purpose, we examine museum visits in terms of a holistic model including visitor intention, satisfaction, and loyalty factor, which is based on the Theory of Planned Behaviour (TPB) (Ajzen, 1991).
2. Literature Review and Hypotheses 2.1. Literature Review
Museums are institutions dedicated to preserving and interpreting the primary tangible evidence of humankind and the environment. Museums also play a very crucial role in tourism and hospitality. To achieve the purpose of the research, we apply the consumer behavior theory as the foundational theory. Service is defined as an invisible tool provided by a public or private organization, which cannot be stored, or its output cannot be measured in terms of physical concepts (Parasuraman et al., 1988). Considering the concept of service, museum visits can be seen as a type of service. A variety of studies on the tourism industry have comprehensively conducted research on the tourist decision-making process (Niemela, 2010), tourist perception of destination image (Embacher & Buttle, 1989), and tourist behavior.
Fishbein and Azjen (1975) developed a human behavior model known as the Theory of Reasoned Action (TRA), which aims to explain the relationship between attitudes and behaviors within human action. It is mainly used to predict how individuals will behave based on their pre- existing attitudes and behavioral intentions. An individual’s decision to engage in a particular behavior is based on the outcomes the individual expects will come as a result of performing the behavior. Ajzen (1991) extended the TRA behavior model for the purpose of improving the predictive power of TRA. The theory of planned behavior (TPB) is a psychological theory that links beliefs to behavior. The theory maintains that three core components, namely, attitude, subjective norms, and perceived behavioral con- trol, together shape an individual’s behavioral intentions.
In turn, a tenet of TPB is that behavioral intention is the most proximal determinant of human social behavior. In the field of tourism and service industry, TPB theory has been widely applied to identify the determinants that affect human behavior (Shen et al., 2009). In short, from the TPB model and past studies on museum visits, we will apply a combination of 3 variables including visit intention, visitor satisfaction, and loyalty as critical variables to measure museum visitation of the young generation.
Visit intention is examined in the scope of planning
behavior, which is regarded as part of complex decision-
making and behavioral process (Nguyen, 2019). These
processes involve multiple determinants or components
which are interrelated. Visitor satisfaction is the key to
success in any industry (Parasuraman et al., 1988; Baber,
2019). Satisfaction is the act of fulfilling a need, desire, or
appetite, or the feeling gained from such fulfillment. Visitor
satisfaction is determined by a combination of perceived
value and quality, consumer expectations, and actual
experience (Giao, 2019). A visitor’s overall satisfaction
will influence the likelihood of repeat visitation, extended length of stay, increased expenditure, enhanced yield, and word-of-mouth referrals (Parasuraman et al., 1988).
In the context of tourism, satisfaction is primarily called a function of pre-travel expectations and post-travel experiences. Visitors are satisfied when the experience exceeds expectations and vice versa (Reisinger & Turner, 2003). Based on previous studies, the satisfaction level is an important variable determining museum visiting behavior and attitude of visitors (Rajesh, 2013).
Customer loyalty is one of the key areas of this research and produced significant insights into the process of exploring visitor behavior (Choi & Moon, 2006). Many past studies have shown the relationship between destination visits, visitor satisfaction, and visitor loyalty (Murphy et al., 2000; Bigne et al., 2001). They have identified a positive relationship between visitor loyalty and intention to revisit with tourist experiences and perceptions. Although previous studies have proved the relationship between tourist loyalty and general attractions, they have not demonstrated the effectiveness of the model when applied to a specific environment like a museum.
In Vietnam, there are very few studies focusing on the factors that make visitors more interested in visiting the museum. Museums have several functions as custodians of heritage and culture, disseminators of knowledge about the heritage, and as places that attract tourists as well as local residents. Arguably all these functions require visitors to be satisfied with the visit experience if museums are to achieve their objectives. Thu and Chris (2013) surveyed 411 visitors of the Cham Museum, Danang, Vietnam, and argued that satisfaction is measured by the willingness of visitors to make recommendations to others.
This study will solve the contradictions in previous research by summarizing previous studies and surveying in the context of Vietnamese museums. Visit intention, visitor satisfaction, and loyalty are used as dependent variables to measure museum visits. Furthermore, other independent variables namely demographic, motivation, service, learning, aesthetics and architecture, and cultural values shall be used to conduct a holistic survey for Vietnamese millennials and generation Z.
2.2. Hypotheses
There are many reasons why people visit museums.
Some want to learn about the past, while others are curious about the country they are visiting or just want to enjoy art and culture. Museums are great for meeting new people, learning how our ancestors lived, and expanding our minds.
Ray et al. (2014) studied individuals’ museum visit behavior and identified various influencing factors. The study included 54 attributes to address museum visit behavior.
The exploratory analyses distilled seven explanatory factors:
cultural, historical, attitudinal, aesthetic, service-related, archival, and promotional factors. Hyowon et al. (2018) established a framework for millennials’ museum visiting behavior and explore the moderating effects of aesthetics and ambiance for visiting art museums. The findings showed that Korean millennial visitors pursue hedonic value rather than utilitarian value when they visit art museums. It turns out that hedonic value accelerates visitor satisfaction and promotes visitor loyalty more than the utilitarian value in the art museum setting. Both ambiance and aesthetics play stimulating roles in the art museum context and moderate the relationships among visitor-perceived value, satisfaction, and loyalty. Utilitarian values are identified as unimportant elements for young Korean museumgoers:
H1: Aesthetics and Architecture are positively correlated with museum visits.
Cultural values are hereditary and form the core of the culture. Cultural values are embedded in daily routines, practices, communication styles, interpersonal discourses, and public representations in which people engage unconsciously and routinely. These values give a shape to the culture and the society (Rajesh, 2013). With its cultural significance, as an integral part of cultural heritage, museums play a pivotal role in the economic development of any country by attracting both local and foreign tourists in many destinations (Rajesh, 2013;
Williams, 2009). Culture is one of the most dominant factors that has not been widely considered in the past studies that examined the museum visit behavior. A museum is a national representation and historical and cultural reflection. Thus, cultural attributions are supposed to positively correlate with museum visit behavior.
H2: Cultural values have a positive correlation with museum visits.
Andereck and Nyaupane (2011) suggested basic demographic variables such as age and gender exert significant influence on behavior patterns and attraction preferences of leisure-based tourists. David (1990) indicated that demographic determinants including social groups (salaried middle class; intermediate group; working class) and annual income act as drives for museum visitation.
Factors such as age, gender, income, educational level, and family literacy make up the personality and perception of each person. These factors influence the decision to visit museums.
H3: Demographic has a different impact on museum
visits.
In contrast to classroom learning, museums are an interesting type of informal learning which is conceptualized as free-choice learning environments. Williams (2009) indicated that people, especially children come to the museum to learn and experience new things. To support the learning factor, research suggested that parents should consider taking their children to the museum (Kelly, 2009).
Therefore, museum visitation offers a unique opportunity to explore new knowledge in a dynamic and educational environment, and also expose young people’s interest.
Hence, there is a positive relationship between learning and museum visits.
H4: Learning has a positive impact on museum visits.
Niemela (2010) stated that motivation for visitors to the museum includes internal factors such as personal needs and interest, relaxation, and curiosity, and external factors comprising art and craft, archeological elements, precious statues, sculptures and monuments, and place of excitement. Hence, motivation can be seen as a starting point to create a behavioral model for museum visitors. Brida et al. (2013) showed that the motivation factor is signified by the push and pull factors, which affects not only visit intention but also the attitude of museum visitors. These research findings show that motivation is supposed to be a critical variable in this research model.
H5: Motivation has a positive impact on museum visits.
As this research has mentioned in the literature review, museum visits are a type of service. Apparently, visitors will evaluate the quality of museum service by their experience at the museum. Cheng and Wan (2012) conducted a quantitative analysis on the service quality of museums in Macao using the HISTOQUAL scale.
Visitors, both tourists, and residents, generally had positive attitudes about the service quality of Macao museums. They found that tourists gave a higher service quality rating than residents. The more satisfied group usually had a higher educational level and a managerial or professional career. They further classified museums according to their themes and found the perception of service quality by visitors differed among the museum types. The study provided important information for museum managers to serve the needs of different niche markets better. To conclude, the effectiveness of service quality in appraising visitor satisfaction is undoubted (JALAL, ZEB & FAYYAZ, 2019). This is because people live in an environment that is increasingly moving towards a service-based economy, hence, transparency and
superior quality will lead to better customer satisfaction and loyalty.
H6: Service quality has a positive impact on museum visits.
3. Research Methods and Materials 3.1. Empirical Models
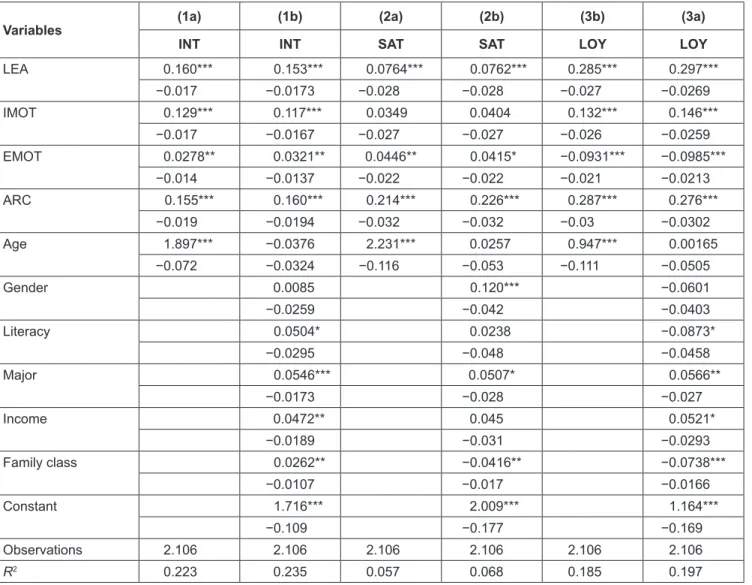
Model 1: INT = α + β
1× MOT + β
2× SER + β
3× PUR + β
4× ARC + β
5× CUL + β
6× D + ε Model 2: SAT = α + β
1× MOT + β
2× SER + β
3× PUR
+ β
4× ARC + β
5× CUL + β
6× D + ε Model 1: LOY = α + β
1× MOT + β
2× SER + β
3× PUR
+ β
4× ARC + β
5× CUL + β
6× D + ε Where: α, β
1, β
2, β
3, β
4, β
5, and β
6are coefficients, D is dummy variables of Demographic, ε is error.
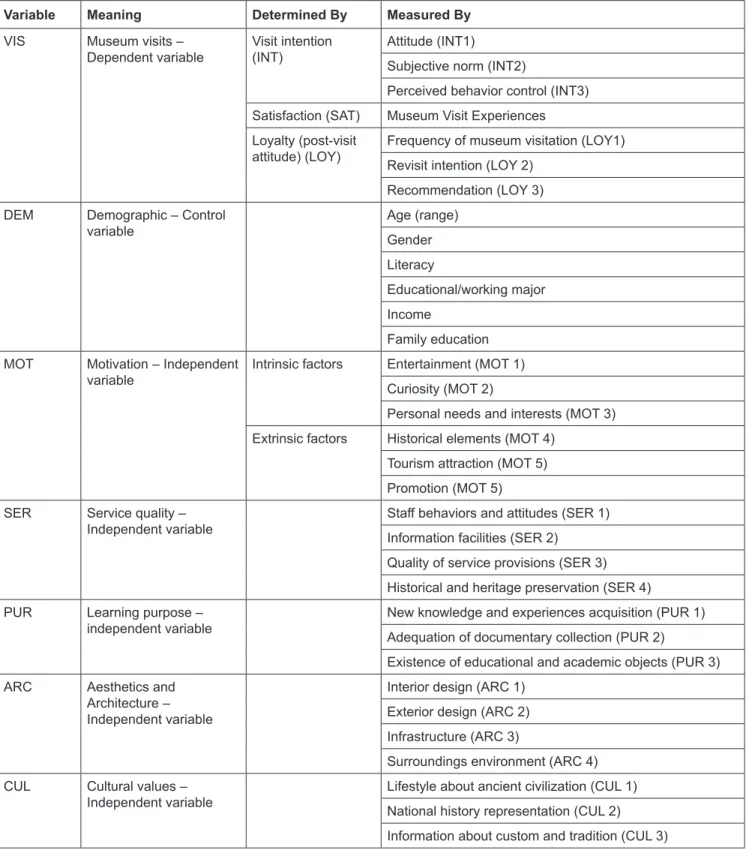
Table 1 illustrates the meaning and the role of both dependent variables and independent variables.
3.2. Data Collection and Research Methods 3.2.1. Sampling Design
The target population for this research is museum visitors and non-visitors aged between 14–30 years old in Vietnam. Before an actual data collection, a pilot test was done. We surveyed a group of students, specifically 10 people were selected through convenience sampling.
Convenience sampling is defined as a method adopted by researchers where they collect market research data from a conveniently available pool of respondents. The purpose of the pilot study was to ensure the clarity and accuracy of the survey instrument. It aimed to identify problems in questionnaires regarding wordings, appropriateness of meanings, and interpretation.
3.2.2. Data Collection
To collect research data, we used a questionnaire
developed in Vietnamese. The questionnaire was designed
with questions such as ‘personal information’, ‘museums
criteria evaluation’ and the ‘experience of museum visits
evaluation’. Then, we went to selected universities in Hanoi
and Ho Chi Minh. We asked more than 2500 respondents
to participate in the survey by informing them about the
purpose of the study, their valuable contribution to the study,
and the confidentiality of the information. Respondents were
Table 1: Dependent Variables and Independent Variables
Variable Meaning Determined By Measured By
VIS Museum visits –
Dependent variable Visit intention
(INT) Attitude (INT1)
Subjective norm (INT2)
Perceived behavior control (INT3) Satisfaction (SAT) Museum Visit Experiences Loyalty (post-visit
attitude) (LOY) Frequency of museum visitation (LOY1) Revisit intention (LOY 2)
Recommendation (LOY 3) DEM Demographic – Control
variable Age (range)
Gender Literacy
Educational/working major Income
Family education MOT Motivation – Independent
variable Intrinsic factors Entertainment (MOT 1) Curiosity (MOT 2)
Personal needs and interests (MOT 3) Extrinsic factors Historical elements (MOT 4)
Tourism attraction (MOT 5) Promotion (MOT 5) SER Service quality –
Independent variable Staff behaviors and attitudes (SER 1) Information facilities (SER 2)
Quality of service provisions (SER 3) Historical and heritage preservation (SER 4) PUR Learning purpose –
independent variable New knowledge and experiences acquisition (PUR 1) Adequation of documentary collection (PUR 2)
Existence of educational and academic objects (PUR 3) ARC Aesthetics and
Architecture – Independent variable
Interior design (ARC 1) Exterior design (ARC 2) Infrastructure (ARC 3)
Surroundings environment (ARC 4) CUL Cultural values –
Independent variable Lifestyle about ancient civilization (CUL 1)
National history representation (CUL 2)
Information about custom and tradition (CUL 3)
not allowed to take the questionnaires home for the reliability and completeness of the survey.
3.2.3. Data Processing
After collecting data from the respondents, we entered the data into Microsoft Excel and recalculated the responses based on a 5-point Likert scale. A 5-point Likert scale is a type of psychometric response scale in which responders specify their level of agreement to a statement typically in five points: (1) Strongly disagree; (2) Disagree; (3) Neither agree nor disagree; (4) Agree; (5) Strongly agree. We eliminated all incomplete answer forms and inconsistent answers. Specifically, descriptive analysis was applied in this study. A descriptive analysis is an important first step for conducting statistical analyses. It gives you an idea of the distribution of your data, helps you to detect outliers and typos, and enables you to identify associations among variables, thus making you ready to conduct further statistical analyses. Data collected and processed are analyzed using methods such as (1) Descriptive statistics analysis to describe basic quantitative characteristics of data (2) Correlation and regression analysis to measure linear correlations between variables in regression models.
4. Results and Discussion 4.1. Descriptive Analysis
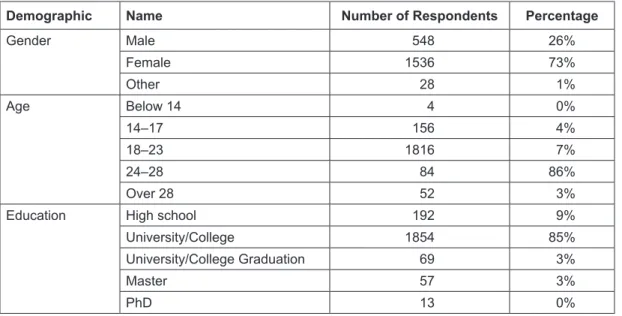
Table 2 shows the results of the descriptive analysis.
Initially, more than 2700 questionnaires were distributed to the customers for their responses, but a total of 2112
usable responses were collected. The demographic profile shows that female respondents (1536 respondents) outnumbered male respondents (548 respondents) and other genders (28 respondents). In terms of age distribution, about 86% (1816 respondents) of the respondents were between 18 and 23 years old, becoming the most prominent range of age when compared to other age groups. 14–17 years and 24–28 years accounted for 7% (156 respondents) and 3% (84 respondents) respectively. Besides, 12–14 and over 28 are the minorities in the statistical analysis with a negligible percentage of respondents: 0% (4 respondents) and 4% (52 respondents).
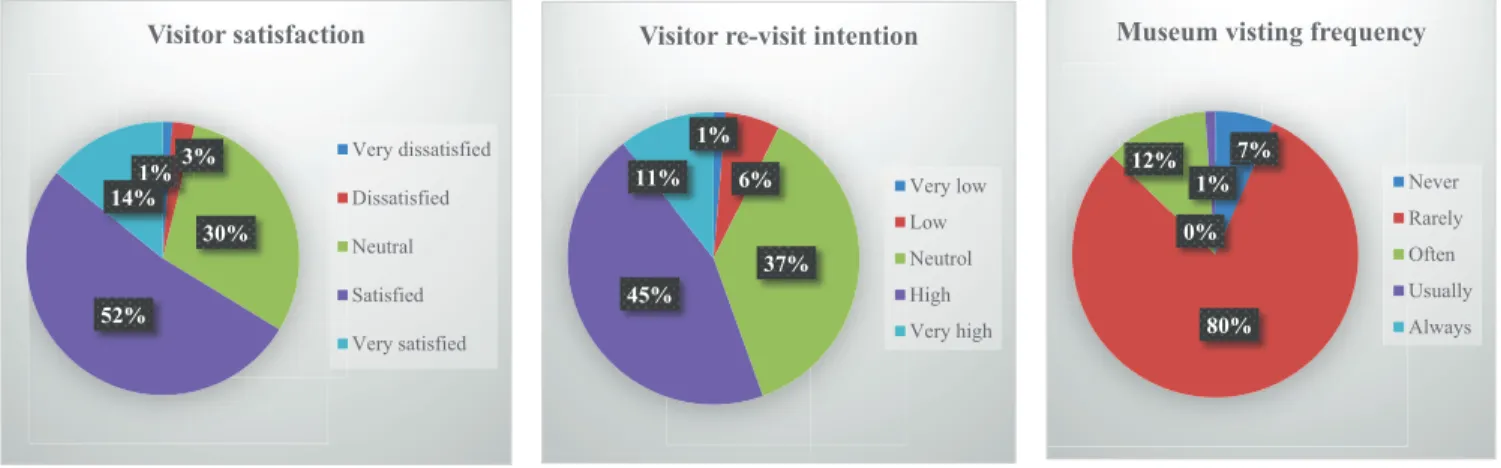
In general, the most striking assessment was visitors were satisfied with their experience at the museum, with 52% of the total respondents “satisfied” and 14% of the total respondents “very satisfied” Consequently, due to such a high level of satisfaction, the visitor re-visit intention accounted for the largest proportion −45% “high intention”
and 11% “very high intention”. Obviously, the museum has done a good job in providing the best service and experience for visitors at a considerable price. Besides, the percentage of respondents who rated “neutral” in terms of satisfaction and revisit intention made up for 30% and 37% respectively.
Respondents who rarely or never visit a museum were 80%
and 7% respectively. Thus, they have little expectation or professional knowledge to assess the museum quality thoroughly. In contrary to the level of “satisfaction” and
“high re-visit intention”, the frequency of visiting museums for “usually” or “always” rate is very low. Of the total participants, only 1% agreed to “usually” and 0% agreed to “always” visit a museum. However, the “dissatisfaction”
level and “low re-visit intention” only accounted for 1% and Table 2: Demographic Analysis
Demographic Name Number of Respondents Percentage
Gender Male 548 26%
Female 1536 73%
Other 28 1%
Age Below 14 4 0%
14–17 156 4%
18–23 1816 7%
24–28 84 86%
Over 28 52 3%
Education High school 192 9%
University/College 1854 85%
University/College Graduation 69 3%
Master 57 3%
PhD 13 0%
7%, respectively which proved that visitor impression and experience at the museum is appreciable. However, young people are not interested in visiting the museum frequently, which is a burden for the museum in Vietnam to implement reforms to attract more visitors (Figure 1).
4.2. Regression Analysis 4.2.1. Cronbach’s Alpha Test
The results of Cronbach’s Alpha test shows 6 different variables that have more than 3 determinants, which are MOT, SER, LEA, ARC, INT, and LOY. In the analysis of MOT variables, the test results show that the observed MOT variables have a total correlation coefficient of (≥0.3). Cronbach’s Alpha coefficient = 0.744 ≥ 0.6, so the variables MOT 1, MOT 2, MOT 3, MOT 4, MOT 5, and MOT 6 meet the requirements of reliability and are a very good measuring scale representing the variable MOT. For SER variables, the test results demonstrated that the observed SER variables have a total correlation coefficient of (≥0.3). Cronbach’s Alpha coefficient = 0.856
≥ 0.8, so variables SER1, SER2, SER3, and SER4 meet the reliability requirements and are a very good measurement scale representing the variable SER.
For LEA variables, the test results indicate that the observed LEA variables have a total correlation coefficient of (≥0.3). Cronbach’s Alpha coefficient = 0.839 ≥ 0.8, so the variables LEA1, LEA2, and LEA3 meet the reliability requirements and are a very good measurement scale representing the LEA variable. For ARC variables, the test results show that the observed ARC variables have a total correlation coefficient of (≥0.3). Cronbach’s Alpha coefficient t = 0.855 ≥ 0.8 so the variables ARC1, ARC2, ARC3, and ARC4 meet the reliability requirements and are a very good measurement scale representing the variable
ARC variable. For INT variables, the test results show that the observed INT variables have a total correlation coefficient of (≥0.3). Cronbach’s Alpha coefficient = 0.710 ≥ 0.6 so the variables INT1, INT2, INT3, and INT4 meet the reliability requirements and are a very good measurement scale representing the variable INT variable. For LOY variables, the test results show that only LOY 2 and LOY3 variables have a correlation coefficient of (≥0.3). Consequently, we have to eliminate LOY1 to assure the reliability of the research.
4.2.2. Exploratory Factor Analysis (EFA)
Exploratory factor analysis (EFA) is a statistical method used to uncover the underlying structure of a relatively large set of variables. EFA is a technique within factor analysis whose overarching goal is to identify the underlying relationships between measured variables. Because the KMO coefficient = 0.916 ≥ 0.5, the analysis of the factors is consistent with the research data set. In addition, Bartlett’s Test of Sphericity has shown that the observed variables in the same factor are correlated with each other due to Sig (Bartlett’s Test) = 0.00 < 0.05.
From the Rotated Component Matrix results in Table 6, variables SER1, SER2, SER3, SER4, MOT3 will be excluded from the model because the variables SER2 and SER4 are uploaded in both Component 1 and Component 2 with the difference in a load factor of less than 0.3. Likewise, the SER 3 and SER1 variables are uploaded in Component 1, 2, and 4 with the difference in a load factor of less than 0.3. Variable MOT3 is uploaded in Component 1 and 4, with the difference in a load factor of less than 0.3.
After the reliable measurement of the independent variables using Cronbach’s Alpha test and EFA discovery factor analysis, the remaining variables in the models are as follows (Table 3).
7%
80%
12% 1%
0%
Museum visting frequency
Never Rarely Often Usually Always 1%
6%
45% 37%
11%
Visitor re-visit intention
Very low Low Neutrol High Very high 1%%3%
30%
52%
1%% 14%
Visitor satisfaction
Very dissatisfied
Dissatisfied
Neutral
Satisfied
Very satisfied