Journal of the Environmental Sciences
The Massive Blooms of Gonyaulax polygramma (Gonyaulacales, Dinophyceae) in the Southern Coastal Areas of Korea in
Summer, 2009
Eun-Seob Cho*
Fishery and Ocean Information Division, NFRDI, Busan 619-705, Korea
(Manuscript received 7 October, 2011; revised 31 October, 2011; accepted 6 December, 2011)
Abstract
This study was carried out to determine the characteristics of the marine environment, including nutritional content, in order to clearly understand the outbreaks of Gonyaulax polygramma in the southern coastal areas in August, 2009.
Samples were collected at 13 sites and water temperature and salinity were measured using a CTD. Field surveys were twice: the first between August 5-7, the second between August 22-24. The cell density of G. polygramma was 6,500-10,000 cells ml-1 during the 1st survey, whereas during the 2nd survey the range of the cells was recorded from 8,000 to 12,500 cells ml-1. Cochlodinium polykrikoides ranged from 0 to 105 cells l-1 during the field survey. In water environments, the majority stations during the 1st survey showed a nearly homogeneous water column below 1oC in temperature, as well as similar profiles of salinity. However, the stratification between the surface and bottom was observed in the 2nd survey. Regarding nutrients, Dissolved Inorganic Nitrogen (DIN) in the surface ranged from 0.144 to 0.236 mg l-1 during the 1st survey, and 0.082-0.228 mg l-1 during the 2nd survey. DIP (Dissolved Inorganic Phosphorus) did not show any difference in concentration between the 1st and 2nd survey. During August of 2009, the wind speed in the southern waters remained at around ≤2 m s-1 for about 60% of time, and there was very little precipitation during the month. Irradiance of ≥10 hr was shown in the late of August. It is thought that a low level of DIN and salinity play an important role as an essential factor for rapid growth, wide distribution and longer duration of red tide in G. polygramma.
Key Words : Gonyaulax polygramma, Red tide, Stratification, DIN, Salinity, Irradiation
1)
1. Introduction
The southern coasts of Korea cover relatively a large landmass and offer a wide avenue for exchange with oceanic waters and freshwater runoff from the rivers. Furthermore, a large volume of freshwater meets the sea during the summer, which causes variability in salinity in the horizontal and vertical planes. In particular, annual outbreaks of Cochlodinium polykrikoides occurred along the southern coasts
*Corresponding author : Fishery and Ocean Information Division, National Fisheries Research and Development Institute, Busan 619-705, Korea
Phone: +82-51-720-2256 E-mail: [email protected]
during the summer were associated with the death of massive fish populations (www.nfrdi.go.kr). However, huge blooms of Gonyaulax polygramma were happened in place of Cochlodinium red tide along the southern coasts in August, 2009, which persisted for one month (www.nfrdi.go.kr). It is known that Gonyaulax polygramma is a non-toxin producing species (Hallegraeff, 1993) and has a wide distribution from cold temperature to tropical waters (Steidinger and Tangen, 1996). Koizumi et al. (1996) reported that it was associated with mass mortality of fish and invertebrate, due to the fact that it creates anoxia and the concentrations of sulfide and ammonia goes up after cell decomposition. In Korea, there are no
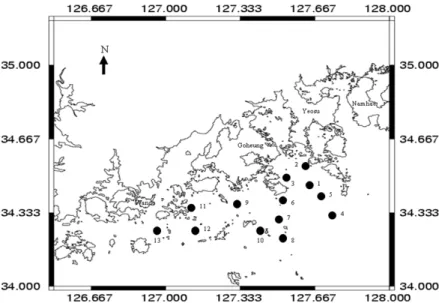
Fig. 1. Sampling locations in the southern coasts of Korea.
reports of fish and shellfish death caused by Gonyaulax red tide (www.nfrdi.go.kr).
Cho (2005) reported that the outbreak of Gonyaulax red tide was first occurred in Yeosu in the early of August, 2004, which fell in between the first outbreak date of Gonyaulax red tide in 2004 and that of 2009.
In August, 2004, the blooming of G. polygramma was occurred in only Bottol Bada, Yeosu (Cho, 2005), whereas the Gonyaulax red tide in August, 2009 occurred in wider regions than in the previous year. Here, this study investigated physical and nutritional characteristics to provide a better understanding the outbreak of Gonyaulax red tide.
2. Materials and methods
Samples were collected at 13 sites (Fig. 1). Sea water temperature and salinity were measured using a CTD (Sea Bird 19) between August 5-7 and August 22-24, 2009. Samples for nutrients were obtained from surface and bottom waters. Concentrations of dissolved inorganic nutrients (NH4-N, NO3-N, NO2-N, and PO4-P), which passed through Whatman GF/F glass fiber filters, were determined as described
by Cho (2010). Chlorophyll-a was filtered on Whatman GF/F glass fiber filters and the filters were extracted in 90% acetone and measured on a UV-VIS spectrophotometer (Perkin Elmer, LS50B). Samples for nutrient analysis were stored at -20oC until required and the tests were possibly conducted within several days after they arrived in the laboratory.
Samples for phytoplankton counting were fixed with Lugol’s solution and counted on Sedgwick-Rafter under the light microscope (Olympus, BX50).
Irradiance, precipitation and wind speed were provided from Korea Meteorological Administration (www.kma.go.kr).
3. Results and Discussion
3.1. Phytoplankton
During 1st survey, cell density of G. polygramma was from 6,500 to 10,000 cells ml-1, whereas the 2nd survey they ranged from 8,000 to 12,500 cells ml-1. The wide coasts between Yeosu and Wando were first covered with Gonyaulax red tide during August 5-7, 2009, and it persisted with a high cell density during August 22-24, 2009. It is thought that the date
W a te r te m p e r a tu r e (oC )
2 0 2 1 2 2 2 3 2 4 2 5
Depth (m)
0 5 1 0 1 5 2 0 2 5
S t. 1
2 0 2 1 2 2 2 3 2 4 2 5
0 5 1 0 1 5 2 0 2 5
2 0 2 1 2 2 2 3 2 4 2 5
0 2 4 6 8 1 0 1 2 1 4
2 0 2 1 2 2 2 3 2 4 2 5
0 5 1 0 1 5 2 0 2 5 3 0
2 0 2 1 2 2 2 3 2 4 2 5
0 5 1 0 1 5 2 0
2 5 2 0 2 1 2 2 2 3 2 4 2 5
0 5 1 0 1 5 2 0 W a te r te m p e ra tu re (oC )
2 0 2 1 2 2 2 3 2 4 2 5
0 5 1 0 1 5
2 0
2 0 2 1 2 2 2 3 2 4 2 5
0
1 0
2 0
3 0
2 0 2 1 2 2 2 3 2 4 2 5
0 5 1 0 1 5 2 0 W a t e r te m p e r a tu re (oC )
2 0 2 1 2 2 2 3 2 4 2 5
0
1 0
2 0
3 0
2 0 2 1 2 2 2 3 2 4 2 5
0 5 1 0 1 5
2 0 2 0 2 1 2 2 2 3 2 4 2 5
0 5 1 0 1 5 2 0
2 0 2 1 2 2 2 3 2 4 2 5
0
1 0
2 0
3 0
W a te r te m p e r a tu r e (oC ) Depth (m)Depth (m)Depth (m)Depth (m)
W a te r te m p e r a tu re (oC )
S t. 2 S t. 3
S t. 4 S t. 5 S t. 6
S t. 7
S t. 8 S t. 9
S t. 1 0
S t. 1 1 S t. 1 2
S t. 1 3
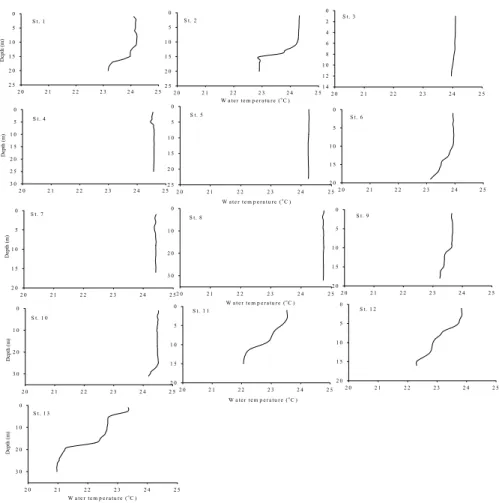
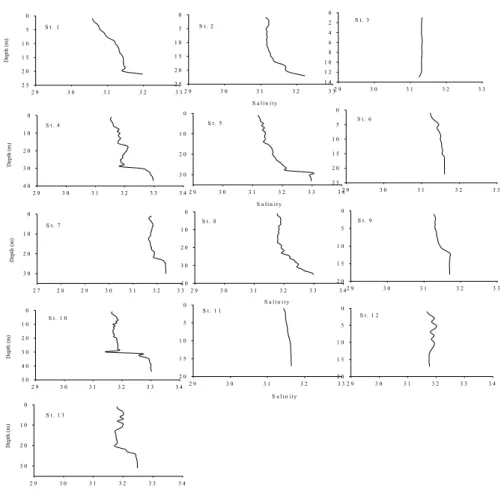
Fig. 2. Vertical distribution of water temperature in August 5-7 (1st field survey), 2009.
and area of first occurrence of G. polygramma are similar to those of C. polykrikoides, as well as having a similar duration of red tide (www.nfrdi.re.kr).
Consequently, G. polygramma has a similar potential activity as C. polykrikoides and variations in environmental parameters play an important role in easily changing of the dominant species in August along the southern coasts.
During the field study, the genus of Pseudonitzschia and Chaetoceros were next dominant species, with a cell number range of 50-350 cells ml-1 for Pseudonitzschia spp. and 180-1,500 cells ml-1 for Chaetoceros spp. However, the cell number of C.
polykrikoides ranged from 25 to 105 cells l-1 in the 1st survey and 0 to10 cells l-1 in the 2nd survey.
Consequently, C. polykrikoides does not play an important role as a main species for red tide based on cell density and has been regarded as only another member among the phytoplankton community. The reason why the 2nd survey does not show a higher cell number of C. polykrikoides than that of the 1st survey appears to be a significantly weak the inter-species competition between G. polygramma and C. polykrikoides (Anderson, 1994).
3.2. Water environment
Fig. 2 shows the vertical distribution of water
2 9 3 0 3 1 3 2 3 3 0
5 1 0 1 5 2 0 2 5
S a lin ity
2 9 3 0 3 1 3 2 3 3
Depth (m)
0 5 1 0 1 5 2 0
2 5 2 9 3 0 3 1 3 2 3 3
0 2 4 6 8 1 0 1 2 1 4
2 9 3 0 3 1 3 2 3 3
0 5 1 0 1 5 2 0 2 5 3 0
2 9 3 0 3 1 3 2 3 3
0 5 1 0 1 5 2 0 2 5
2 9 3 0 3 1 3 2 3 3
0 5 1 0 1 5 2 0
2 9 3 0 3 1 3 2 3 3
0 5 1 0 1 5
2 0 2 9 3 0 3 1 3 2 3 3
0
1 0
2 0
3 0
2 9 3 0 3 1 3 2 3 3
0 5 1 0 1 5 2 0
2 9 3 0 3 1 3 2 3 3
0
1 0
2 0
3 0
2 9 3 0 3 1 3 2 3 3
0 5 1 0 1 5
2 0
2 9 3 0 3 1 3 2 3 3
0 5 1 0 1 5 2 0
2 9 3 0 3 1 3 2 3 3
0
1 0
2 0
3 0 Depth (m) Depth (m)Depth (m)Depth (m)
S a lin ity
S a l in ity
S a lin ity
S a li n i ty
S t. 1 S t. 2 S t. 3
S t. 4 S t. 5 S t. 6
S t. 7 S t. 8 S t. 9
S t. 1 0
S t. 1 1 S t. 1 2
S t. 1 3
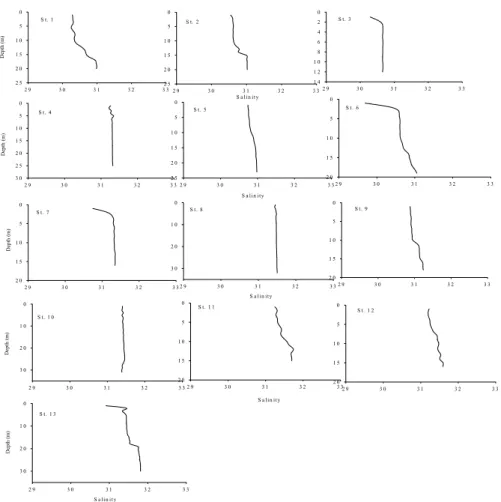
Fig. 3. Vertical distribution of salinity in August 5-7 (1st field survey), 2009.
temperature during the field survey during August 5-7, 2009. Most stations noted the nearly homogeneous water column with temperatures below 1oC, but stations 11, 12 and 13 measured higher surface water temperatures with ≥ 2oC higher than that of the bottom water temperature. This information suggests that Wando coasts shows a cool water temperature in the bottom with a deep strong band in the beginning of early August which is different from the bottom water column in the Yeosu and Goheung regions (Cho, 2009). Most stations show similar profiles of salinity and show higher values of salinity approaching the bottom (Fig. 3). Unlikely due to water temperature,
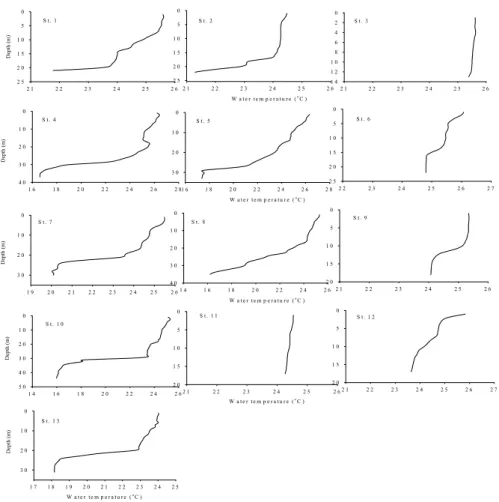
Yeosu, Goheung and Wando coasts had a similar level of salinity during the 1st survey. During the field survey, most stations observe a heterogeneous water column as they checked the water temperature except for stations 3 and 11. These stations formed unique profiles, with a big difference in water temperature showing between the surface and the bottom (Fig. 4).
It is found that most of the southern coasts have a unique water column in the early of August, but the stratification between the surface and bottom is clearly shown in the 2nd field survey. In particular, the waters off Yeosu, Goheung and Wando, at 20 m depth, showed a rapidly decreasing water temperature
W a t e r t e m p e r a t u r e (oC )
2 1 2 2 2 3 2 4 2 5 2 6
Depth (m)
0 5 1 0 1 5 2 0 2 5
2 1 2 2 2 3 2 4 2 5 2 6
0 5 1 0 1 5 2 0 2 5
2 1 2 2 2 3 2 4 2 5 2 6
0 2 4 6 8 1 0 1 2 1 4
1 6 1 8 2 0 2 2 2 4 2 6 2 8
0 1 0 2 0 3 0
4 0
1 6 1 8 2 0 2 2 2 4 2 6 2 8
0 1 0 2 0
3 0
2 2 2 3 2 4 2 5 2 6 2 7
0 5 1 0 1 5 2 0 2 5
1 9 2 0 2 1 2 2 2 3 2 4 2 5 2 6
0 1 0 2 0
3 0
1 4 1 6 1 8 2 0 2 2 2 4 2 6
0 1 0 2 0 3 0 4 0
2 1 2 2 2 3 2 4 2 5 2 6
0 5 1 0 1 5 2 0
1 4 1 6 1 8 2 0 2 2 2 4 2 6
0 1 0 2 0 3 0 4 0
5 0 2 1 2 2 2 3 2 4 2 5 2 6
0 5 1 0 1 5
2 0 2 1 2 2 2 3 2 4 2 5 2 6 2 7
0 5 1 0 1 5 2 0
1 7 1 8 1 9 2 0 2 1 2 2 2 3 2 4 2 5
0 1 0 2 0 3 0
W a t e r t e m p e r a t u r e (oC )
W a t e r t e m p e r a t u r e (oC )
W a t e r t e m p e r a t u r e (oC )
W a t e r t e m p e r a t u r e (oC ) Depth (m)Depth (m)Depth (m)Depth (m)
S t . 1 S t . 2 S t . 3
S t . 4 S t . 5 S t . 6
S t . 7 S t . 8 S t . 9
S t . 1 0
S t . 1 1 S t . 1 2
S t . 1 3
Fig. 4. Vertical distribution of water temperature in August 22-24 (2nd field survey), 2009.
and formed a strong cold water mass at the bottom.
Also, the inner coasts of Yeosu and Goheung observed a vertical stratification of water, but weak stratified water was found compared with the water farther off the coast in their regions (Hallegraeff, 1995). In general, a high solar radiation, a weak wind speed and intrusion of saline oceanic water all play an important role in forming the stratification of water. The main reason why the stratification has not been observed at the stations 3 and 10 during the 2nd survey is that these two stations have a shallow water depth and are easily influenced by the actions of ebb and flow (Shimpson and Bowers, 1981). Fig. 5 shows
the vertical distribution of salinity during the 2nd survey. In the waters off Yeosu, a high density of salinity (≥32) was observed from 20 m depth to the bottom. This indicates that the waters off Yeosu were strongly influenced by high saline sea water during the 2nd survey, particularly when compared with the 1st survey.
3.3. Nutrients
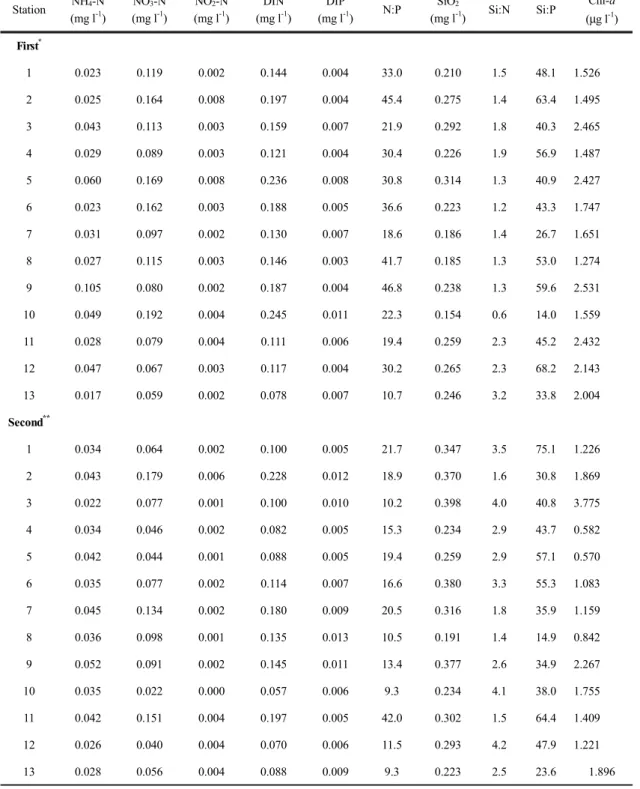
Table 1 shows the fluctuations of the nutrients in the surface water during the 1st survey. The concentration of DIN (Dissolved Inorganic Nitrogen) in the waters off Yeosu ranged from 0.144 to 0.236 mg l-1, which was similar to that of Goheung and
S a l i n i t y
2 9 3 0 3 1 3 2 3 3
Depth (m)
0 5 1 0 1 5 2 0 2 5
2 9 3 0 3 1 3 2 3 3
0 5 1 0 1 5 2 0 2 5
2 9 3 0 3 1 3 2 3 3
0 2 4 6 8 1 0 1 2 1 4
2 9 3 0 3 1 3 2 3 3 3 4
0 1 0 2 0 3 0 4 0
2 9 3 0 3 1 3 2 3 3 3 4
0 1 0
2 0
3 0
2 9 3 0 3 1 3 2 3 3
0 5 1 0 1 5 2 0 2 5
2 7 2 8 2 9 3 0 3 1 3 2 3 3
0 1 0 2 0 3 0
2 9 3 0 3 1 3 2 3 3 3 4
0 1 0 2 0 3 0
4 0 2 9 3 0 3 1 3 2 3 3
0 5 1 0 1 5 2 0
2 9 3 0 3 1 3 2 3 3 3 4
0 1 0 2 0 3 0 4 0
5 0 2 9 3 0 3 1 3 2 3 3
0 5 1 0 1 5
2 0
2 9 3 0 3 1 3 2 3 3 3 4
0 5 1 0 1 5 2 0
2 9 3 0 3 1 3 2 3 3 3 4
0
1 0 2 0
3 0
S a l i n i t y
S a l i n i t y
S a l i n i t y
S a l i n i t y Depth (m)Depth (m)Depth (m)Depth (m)
S t . 1 S t . 2 S t . 3
S t . 4 S t . 5 S t . 6
S t . 7 S t . 8 S t . 9
S t . 1 0
S t . 1 1
S t . 1 2
S t . 1 3
Fig. 5. Vertical distribution of salinity in August 22-24 (2nd field survey), 2009.
Wando waters. During the 2nd survey, however, the concentration of DIN in southern coastal waters ranged from 0.082 to 0.228 mg l-1, indicating a low level of DIN concentration compared with that of the 1st survey. It is understood that G. polygramma has a high availability of DIN for growth and maintaining the blooms in southern coastal waters. DIP (Dissolved Inorganic Phosphorus) did not show a different concentration between the 1st and 2nd surveys, suggesting that G. polygramma has a low level of availability for rapid growth when compared with DIN. Si concentrations did not greatly fluctuate in the 1st and 2nd surveys, but the ratio of Si:N
showed higher value in the 2nd survey than that of the 1st survey. Cho (2005) suggested that DIN plays an important role in the occurrence and disappearance of G. polygramma, with similarities to the present study.
The ratio of N:P was decreased and the ratio of Si:N was increased in the 2nd survey. Consequently, G.
polygramma for the formation and maintenance of red tide is directly driven by changes in DIN.
As shown in Fig. 4 and 5, the stratifications of water temperature and salinity were clearly founded in the 2nd survey. DIN concentration of the bottom layer in the 1st survey was similar to that of the 2nd
Table 1. Surface water factors in August 5-7 and August 22-24, 2009 Station NH4-N
(mg l-1)
NO3-N (mg l-1)
NO2-N (mg l-1)
DIN (mg l-1)
DIP
(mg l-1) N:P SiO2
(mg l-1) Si:N Si:P Chl-a (μg l-1) First*
1 0.023 0.119 0.002 0.144 0.004 33.0 0.210 1.5 48.1 1.526
2 0.025 0.164 0.008 0.197 0.004 45.4 0.275 1.4 63.4 1.495
3 0.043 0.113 0.003 0.159 0.007 21.9 0.292 1.8 40.3 2.465
4 0.029 0.089 0.003 0.121 0.004 30.4 0.226 1.9 56.9 1.487
5 0.060 0.169 0.008 0.236 0.008 30.8 0.314 1.3 40.9 2.427
6 0.023 0.162 0.003 0.188 0.005 36.6 0.223 1.2 43.3 1.747
7 0.031 0.097 0.002 0.130 0.007 18.6 0.186 1.4 26.7 1.651
8 0.027 0.115 0.003 0.146 0.003 41.7 0.185 1.3 53.0 1.274
9 0.105 0.080 0.002 0.187 0.004 46.8 0.238 1.3 59.6 2.531
10 0.049 0.192 0.004 0.245 0.011 22.3 0.154 0.6 14.0 1.559
11 0.028 0.079 0.004 0.111 0.006 19.4 0.259 2.3 45.2 2.432
12 0.047 0.067 0.003 0.117 0.004 30.2 0.265 2.3 68.2 2.143
13 0.017 0.059 0.002 0.078 0.007 10.7 0.246 3.2 33.8 2.004
Second**
1 0.034 0.064 0.002 0.100 0.005 21.7 0.347 3.5 75.1 1.226
2 0.043 0.179 0.006 0.228 0.012 18.9 0.370 1.6 30.8 1.869
3 0.022 0.077 0.001 0.100 0.010 10.2 0.398 4.0 40.8 3.775
4 0.034 0.046 0.002 0.082 0.005 15.3 0.234 2.9 43.7 0.582
5 0.042 0.044 0.001 0.088 0.005 19.4 0.259 2.9 57.1 0.570
6 0.035 0.077 0.002 0.114 0.007 16.6 0.380 3.3 55.3 1.083
7 0.045 0.134 0.002 0.180 0.009 20.5 0.316 1.8 35.9 1.159
8 0.036 0.098 0.001 0.135 0.013 10.5 0.191 1.4 14.9 0.842
9 0.052 0.091 0.002 0.145 0.011 13.4 0.377 2.6 34.9 2.267
10 0.035 0.022 0.000 0.057 0.006 9.3 0.234 4.1 38.0 1.755
11 0.042 0.151 0.004 0.197 0.005 42.0 0.302 1.5 64.4 1.409
12 0.026 0.040 0.004 0.070 0.006 11.5 0.293 4.2 47.9 1.221
13 0.028 0.056 0.004 0.088 0.009 9.3 0.223 2.5 23.6 1.896
Note: *, ** mean to survey in August 5-7 and August 22-24, respectively.
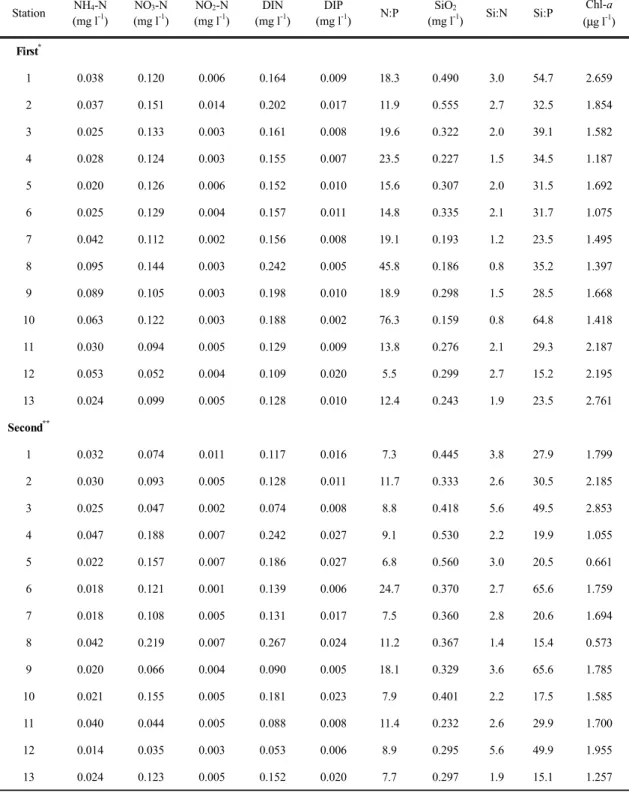
Table 1-1. Bottom waters Station NH4-N
(mg l-1)
NO3-N (mg l-1)
NO2-N (mg l-1)
DIN (mg l-1)
DIP
(mg l-1) N:P SiO2
(mg l-1) Si:N Si:P Chl-a (μg l-1) First*
1 0.038 0.120 0.006 0.164 0.009 18.3 0.490 3.0 54.7 2.659
2 0.037 0.151 0.014 0.202 0.017 11.9 0.555 2.7 32.5 1.854
3 0.025 0.133 0.003 0.161 0.008 19.6 0.322 2.0 39.1 1.582
4 0.028 0.124 0.003 0.155 0.007 23.5 0.227 1.5 34.5 1.187
5 0.020 0.126 0.006 0.152 0.010 15.6 0.307 2.0 31.5 1.692
6 0.025 0.129 0.004 0.157 0.011 14.8 0.335 2.1 31.7 1.075
7 0.042 0.112 0.002 0.156 0.008 19.1 0.193 1.2 23.5 1.495
8 0.095 0.144 0.003 0.242 0.005 45.8 0.186 0.8 35.2 1.397
9 0.089 0.105 0.003 0.198 0.010 18.9 0.298 1.5 28.5 1.668
10 0.063 0.122 0.003 0.188 0.002 76.3 0.159 0.8 64.8 1.418
11 0.030 0.094 0.005 0.129 0.009 13.8 0.276 2.1 29.3 2.187
12 0.053 0.052 0.004 0.109 0.020 5.5 0.299 2.7 15.2 2.195
13 0.024 0.099 0.005 0.128 0.010 12.4 0.243 1.9 23.5 2.761
Second**
1 0.032 0.074 0.011 0.117 0.016 7.3 0.445 3.8 27.9 1.799
2 0.030 0.093 0.005 0.128 0.011 11.7 0.333 2.6 30.5 2.185
3 0.025 0.047 0.002 0.074 0.008 8.8 0.418 5.6 49.5 2.853
4 0.047 0.188 0.007 0.242 0.027 9.1 0.530 2.2 19.9 1.055
5 0.022 0.157 0.007 0.186 0.027 6.8 0.560 3.0 20.5 0.661
6 0.018 0.121 0.001 0.139 0.006 24.7 0.370 2.7 65.6 1.759
7 0.018 0.108 0.005 0.131 0.017 7.5 0.360 2.8 20.6 1.694
8 0.042 0.219 0.007 0.267 0.024 11.2 0.367 1.4 15.4 0.573
9 0.020 0.066 0.004 0.090 0.005 18.1 0.329 3.6 65.6 1.785
10 0.021 0.155 0.005 0.181 0.023 7.9 0.401 2.2 17.5 1.585
11 0.040 0.044 0.005 0.088 0.008 11.4 0.232 2.6 29.9 1.700
12 0.014 0.035 0.003 0.053 0.006 8.9 0.295 5.6 49.9 1.955
13 0.024 0.123 0.005 0.152 0.020 7.7 0.297 1.9 15.1 1.257
Note: *, ** mean to survey in August 5-7 and August 22-24, respectively.
Date
0 5 10 15 20 25 30
Wind speed (m s-1)
0 2 4 6 8
A
Date
0 5 10 15 20 25 30
Precipitation (mm)
0 20 40 60 80
Date
0 5 10 15 20 25 30
Irradiance (hr)
0 5 10 15 20
C B
Fig. 6. Ocean climate conditions in August, 2009: wind speed (A); precipitation (B); irradiance (C). Data is obtained from Yeosu, Goheung and Wando stations. Data shows mean±S.E (n=3).
survey, but DIP seemed to be in higher concentrations in the 2nd compared with the 1st survey (Table 1-1).
The 2nd survey found a lower level of Si:P than that of the 1st survey. On the basis of DIN and DIP, the surface and bottom layer have a different water characteristics. A lower levels of DIN on the surface are associated with rapid growth of G. polygramma, but higher levels of DIP on the bottom are contributed to more active chemical reaction than that of DIN.
3.4. Ocean climate
Fig. 6 shows daily variations of wind speed,
precipitation and irradiance in August, 2009. This data was obtained from Yeosu, Goheung and Wando stations which belonged to the KMA. About 60% of the readings showed a wind speed of below 2 m s-1 in the southern coastal regions for August, 2009. During the 1st survey, an average wind speed of 4 m s-1 was shown, whereas a weak wind speed of below 2 m s-1 was observed in the 2nd survey. It is assumed that the effect of wind speed on the southern environmental conditions was weak. The dates of August 7, 11, 21 and 27, 2009 showed above 10 mm precipitation, but most days had no rainfall. During the field survey,
there is no precipitation show except for on August 7, 2009. It is thought that the high stratification of salinity during the 2nd survey may have been caused by lower rates of precipitation in the late of August compared with in the early of August. The stratification of salinity is also associated with a little of precipitation with intrusion of saline oceanic water.
Irradiance of above 10 hr showed in the late of August compared with in the early of August, 2009, associating with strong formation of the stratification in the 2nd survey. Consequently, higher stratification in the late of August, 2009 compared with lower rates in the early of August in the southern coastal waters was caused and maintained by a high solar radiation, a weak wind speed and small precipitation.
3.5. Overview
The reason why surface salinity showed lower value of ≥32 when compared with common salinity (around 33, Choi et al., 2005) during the summer was indirectly influenced by concentrated rainfall from a typhoon name ”Molagok” which occurred in July, 2009 and the fact that precipitation became minimal after the middle of June, 2009 (www.kma.go.kr). On the basis of cell physiology, C. polykrikoides has a significantly faster growth rate with under higher salinity levels of above 33, and grows of slowly in salinity of below 32 (Lee and Kim, 2008). According to this study, water temperature is optimal to grow C.
polykrikoides, but lower salinity in this study plays an important role in inhibiting rapid growth of C.
polykrikoides. Consequently, the persistence of a small number of C. polykrikoides during the field study is directly caused by lower salinity on the surface. In particular, the duration of lower salinity has been extended and extremely impeded in growth of C. polykrikoides. On the other hand, the species of Gonyaulax and Alexandrium grow rapidly under lower salinity compared to C. polykrikoies (Moestru and Hansen, 1988; Steidinger and Tangen, 1996).
Consequently, the environmental condition in August, 2009 was quite different from water parameters in 2008 in which Cochlodinium red tide occurred (Cho, 2010). In this study, G. polygramma for formation and maintaining of the blooms requires the nutrient DIN instead of DIP, as an essential nutrient. The massive blooms of G. polygramma in the southern coastal waters are associated with a wide distribution of DIN concentration under ≥ 0.2 mg l-1. Interestingly, in early August, 2009 there was little formation of the stratification which is useful to supply DIN to the bottom layer, particularly compared with conditions in late August, 2009, which were much better for forming the stratification. This is indicated by the fact that the surface water in early August, 2009 consisted of more enriched-DIN than in late August, 2009.
However, research in early August, 2009 showed lower cell numbers of G. polygramma than that recorded in the late August, 2009. It is thought that a low level of DIN plays an important role in the rapid growth of G. polygramma and is an essential factor for triggering the blooms. These current result correspond well with previous report (Cho, 2005).
4. Conclusion
The main reason why the massive blooms of G.
polygramma occurred in the southern coastal water for a month is as followed: First, the duration of lower salinity persisted, and created an environment more conductive to the rapid grown of G. polygramma than C. polykrikoides. In late August, 2009, a high solar radiation, a low rate of precipitation and a weak wind speed helped to form the stratification of salinity which can maintain lower salinity on the surface for a month because of preventing from supplying higher saline water to the surface. Second, G. polygramma has an excellent availability for growth in condition of low concentration of DIN in nature. Therefore DIN existed at a level of low
concentration in the late of August, 2009, G.
polygramma had a higher cell number than was recorded in early August, 2009. Consequently, G.
polygramma is expected to show a second main red tide in Korean waters based on the duration and distribution of the blooming.
Acknowledgments
This work was funded by a grant from the National Fisheries Research and Development Institute (RP- 2011-ME-038).
References
Anderson, D. M., 1994, Red tides, Scientific America, 271, 52-58.
Cho, E. S., 2005, First report on Gonyaulax polygramma (Gonyaulacales, Dinophyceae) blooms in the Yeosu waters of the South Sea of Korea, J.
Environ. Sci., 14, 639-647.
Cho, E. S., 2009, Compared of temporal and spatial sea water quality in the southern coasts of Korea, J.
Environ. Sci., 18, 141-151.
Cho, E. S., 2010, A comparative study on outbreak and non-outbreak of Cochlodinium polykrikoides Margalef in South Sea of Korea in 2007-2009, J.
Kor. Soc. Mar. Environ. Safety, 16, 31-41.
Choi, Y. K., Cho, E. S., Lee, Y. H., Lee, Y. S., 2005.
Distributions of temperature and salinity in relation to ebb, turn of tide and flood of the Bottol Bada in July, 2004, J. Environ. Sci., 14, 167-175.
Hallegraeff, G. M., 1993, A review of harmful algal blooms and their apparent global increase, Phycologia, 32, 79-99.
Hallegraeff, G. M., 1995, Harmful Algal blooms: A global overview, in: Hallegraeff, G. M., Anderson, D. M., Cembella, A. D. (eds.), Manual on harmful marine microalgae, UNESCO, Paris, 1-22.
Koizumi, Y., Kohno, J., Matsuyama, N., Uchida, T., Honjo, T., 1996, Environmental features and the mass mortality of fish and shellfish during the Gonyaulax polygramma red tide occurred in the around Uwajima Bay, Japan, in 1994, Nip. Suisan Gakkashima, 62, 217-224.
Lee, M. O., Kim, J. K., 2008, Characteristics of algal blooms in the southern coastal waters of Korea, Mar. Environ. Res., 65, 128-147.
Moestrup, O., Hansen, P. J., 1988, On the occurrence of the potentially toxic dinoflagellates Alexandrium tamarense and A. ostenfeldii in Danish and Faroese waters, Ophelia, 28, 195-213.
Shimpson, J. H., Bowers, D., 1981, Models of stratification and frontal movement in shelf seas, Deep-sea Research, 28, 727-738.
Steidinger, K. A., Tangen, K., 1996. Dinoflagellates, in:
Tomas, C. R. (ed.), Identifying marine diatoms and dinoflagellates, Academic Press, New York, 387-598.