Journal of the Korean Society of Marine Environment & Safety Research Paper Vol. 19, No. 4, pp. 375-381, August 31, 2013, ISSN 1229-3431(Print) / ISSN 2287-3341(Online) http://dx.doi.org/10.7837/kosomes.2013.19.4.375
해상교통환경 위험요소의 상대적 중요도를 고려한 목포항 및 진입수로의 위험도 평가
이홍훈 김철승
목포해양대학교 실습선, 목포해양대학교 국제해사수송과학부
Evaluation on Risk at the Port of Mokpo and its Approaches based on Relative Importance of Risk Factors for Marine Traffic Environment
Hong-Hoon Lee Chol-Seong Kim
Training Ship, Mokpo National Maritime University, Mokpo, 530-729, Korea
Division of International Maritime Transportation Science, Mokpo National Maritime University, Mokpo, 530-729, Korea
요 약 : 해상교통환경의 위험도를 평가하기 위해서는 위험도를 구성하고 있는 위험요소들을 명확히 식별하고, 식별된 위험요소들을 평가할 수 있는 기준을 마련하여야 한다. 한편 이러한 각 위험요소들의 위험수준의 합으로 전체 위험도를 나타낼 수 있으므로, 각 위험요 소가 전체 위험도에서 차지하는 비중인 상대적 중요도가 분석되어야 한다. 본 연구는 선행연구에서 국내·외 해상교통환경 위험도 평가모 델들의 검토를 통하여 제시된 국내 해상교통환경의 위험도를 구성하는 20가지 위험요소와 평가기준 및 해상교통전문가 집단에 의한 설 문조사를 통하여 계층분석적의사결정법으로 분석한 각 위험요소의 상대적 중요도를 바탕으로, 국내 목포항 및 그 진입수로에 대한 해상 교통환경의 위험도를 평가하였다. 목포항 및 그 진입수로는 비교평가를 위하여 총 4개의 해역으로 구분하여 분석하였으며, 분석결과 위 험요소 해수운동 복잡성 예인선 도선사 선박교통관제 등에서 위험수준이 높게 나타난 정등해 항로의 위험도가 가장 높게 평가되었 다. 이러한 평가결과는 동일한 해역에서 본 연구와는 다른 정성적 혹은 정량적 위험도 분석기법을 이용한 연구들의 평가결과와 대체로 일치하였다.
핵심용어 : 해상교통환경, 위험도, 위험요소, 상대적 중요도, 계층분석적의사결정법
Abstract : To assess the risk of marine traffic environments, with high confidential level, the risk factors comprising it should be identified and the risk acceptance criteria should be also provided. Furthermore, the relative importance of each risk factor(the weight of each risk factor on total risk) should be analyzed because the risk is expressed as the sum of risk factors comprising it. The twenty kinds of risk factors and its assessment criteria were suggested for the domestic marine traffic environments by an examination of the existing risk assessment models on the previous studies. The relative importance of each risk factor was also analyzed through the questionnaire using analytic hierarchy process by the marine traffic experts on the same studies. Based on these previous studies, the risk was evaluated at the port of Mokpo and its approaches on this study. The port of Mokpo and its approaches were divided into four sectors for the comparative evaluation, the result of the comparative evaluation on four sectors showed that the risk of the Jeongdeung-hae passage is the highest due to higher risk level of some risk factors(water movements, complexities, tug boats, pilotage, VTS) than the other sectors. The result of this evaluation is in accord with the analysis results of the other studies using various qualitative or quantitative risk analysis methods at the same sea areas.
Key Words : Marine traffic environment, Risk, Risk factor, Relative importance, Analytic hierarchy process
1)
* First Author : [email protected], 061-240-7422
Corresponding Author : [email protected], 061-240-7174
1. 서 론
국내의 해상교통환경에 대한 위험도 평가는 주로 다른 나 라에서 개발된 정량적 위험도 평가기법을 적용하거나, 전체 위험도를 구성하는 위험요소들이 가지는 상대적 중요도를 고려하지 않은 정성적 위험도 평가기법에 의존하여 분석되 어 왔다. 이 연구는 이러한 기존 정량적 혹은 정성적인 위험 도 평가기법을 대체할 수 있는 국내 해상교통환경에 적합한 새로운 위험도 평가기법을 제시하고자, 이 연구와 연계된 선행연구들을 바탕으로 실시된 것이다.
즉, 국내 해상교통환경의 위험도를 구성하고 있는 위험요 소들을 체계적으로 분류하고 분류된 각각의 위험요소들을 평가할 수 있는 기준을 마련하였던 선행연구인 Kim and Lee(2012)의 연구와, 각각의 위험요소들이 전체 위험도에서 차지하는 비중인 상대적 중요도를 분석하였던 선행연구인 Lee and Kim(2013)의 연구결과를 바탕으로, 국내 해상교통환 경에 적합한 새로운 위험도 평가기법을 구축한 후, 이를 국 내 목포항 및 그 진입수로에 적용하여 그 위험도를 평가해 보고자 하였다. 더 나아가 목포항 및 그 진입수로에서의 위 험도 평가결과를 동일한 해역에서의 타 연구사례와 비교해 봄으로써, 이 연구에서 구축된 위험도 평가기법의 신뢰성을 시험해 보고자 한 것이다.
2. 선행연구의 고찰
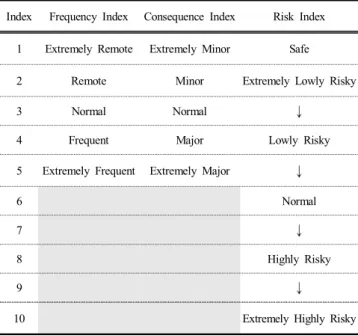
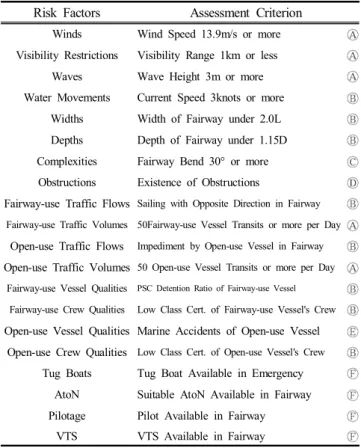
Kim and Lee(2012)의 연구에서 위험도에 대한 정의를 식(1) 과 같이 정의하여 Table 1의 위험도 지수를 이용하여 표현하 였고, 국내 해상교통환경의 위험도를 구성하는 위험요소들 을 국·내외 해상교통환경 위험도 평가모델들의 검토를 통하 여 Table 2와 같이 선정한 후, 이 위험요소들을 관련 법 및 연구를 바탕으로 실용적으로 용이하게 평가할 수 있는 기준 을 Table 3과 같이 제시하였다. 또한 각 위험요소에 대한 출 현빈도 지수의 측정법을 연중 출현일수 및 해역당 출현비율 로 Table 4와 같이 분류하였다.
(1)
여기서, RI : Risk Index(위험도 지수) FI : Frequency Index(출현빈도 지수) CI : Consequence Index(영향력 지수)
Index Frequency Index Consequence Index Risk Index
1 Extremely Remote Extremely Minor Safe
2 Remote Minor Extremely Lowly Risky
3 Normal Normal
4 Frequent Major Lowly Risky
5 Extremely Frequent Extremely Major
6 Normal
7
8 Highly Risky
9
10 Extremely Highly Risky
Table 1. Frequency, Consequence, and Risk Index
Risk Categories Sub-Categories Risk Factors
Natural Conditions
Weather Conditions
Winds Visibility Restrictions Sea
Conditions
Waves Water Movements
Fairway Conditions
Dimension Conditions
Widths Depths Interference
Conditions
Complexities Obstructions
Traffic Conditions
Fairway-use Traffic Conditions
Traffic Flows Volume of Traffics Open-use
Traffic Conditions
Traffic Flows Volume of Traffics
Vessel Conditions
Fairway-use Vessel Conditions
Vessel Qualities Crew Qualities Open-use
Vessel Conditions
Vessel Qualities Crew Qualities
Assistance Conditions
Material Resource Conditions
Tug Boats AtoN Human Resource
Conditions
Pilotage VTS Table 2. Classification of Risk Factors on Previous Study
Risk Factors Assessment Criterion
Winds Wind Speed 13.9m/s or more Visibility Restrictions Visibility Range 1km or less
Waves Wave Height 3m or more Water Movements Current Speed 3knots or more
Widths Width of Fairway under 2.0L Depths Depth of Fairway under 1.15D Complexities Fairway Bend 30° or more
Obstructions Existence of Obstructions
Fairway-use Traffic Flows
Sailing with Opposite Direction in Fairway Fairway-use Traffic Volumes 50Fairway-use Vessel Transits or more per DayOpen-use Traffic Flows
Impediment by Open-use Vessel in FairwayOpen-use Traffic Volumes
50 Open-use Vessel Transits or more per DayFairway-use Vessel Qualities PSC Detention Ratio of Fairway-use Vessel Fairway-use Crew Qualities Low Class Cert. of Fairway-use Vessel's Crew
Open-use Vessel Qualities Marine Accidents of Open-use Vessel
Open-use Crew Qualities
Low Class Cert. of Open-use Vessel's CrewTug Boats Tug Boat Available in Emergency
AtoN Suitable AtoN Available in Fairway Pilotage Pilot Available in Fairway
VTS VTS Available in Fairway
Table 3. Assessment Criteria of Risk FactorsFI
1 0 ~ 7 days 0 ~ 5 % 1 place 2 8 ~ 30 days 6 ~ 10 % 2 places 3 31 ~ 90 days 11 ~ 20 % 3 places 4 91 ~ 180 days 21 ~ 30 % 4 places 5 181 ~ 365 days 31 ~ 100 % more than 4 places FI
1 0 ~ 3 places 0 ~ 1 case 0 ~ 10 % 2 4 ~ 5 places 2 ~ 3 cases 11 ~ 20 % 3 6 ~ 7 places 4 ~ 5 cases 21 ~ 30 % 4 8 ~ 9 places 6 ~ 7 cases 31 ~ 50 % 5 more than 9 places more than 7 cases 51 ~ 100 % Table 4. Kinds of Frequency Index
Lee and Kim(2013)의 연구에서는 해상교통전문가 집단에 의한 설문조사를 통하여 각 위험요소에 대한 영향력 지수 크기의 평균값을 Table 5와 같이 산출하였고, 식(2)의 정의를 바탕으로 각 위험요소가 전체 위험도에서 차지하는 비중인 상대적 중요도(가중치)를 같은 설문조사를 통하여 계층분석 적의사결정법(Analytic Hierarchy Process, 이하 ‘AHP’라 한다.) 으로 역시 Table 5에서와 같이 분석하였다.
× × × (2)
여기서, R : Risk(위험도), Rf : Risk Factor(위험요소), ω : Weight(가중치)
Risk Factors Average Value of CI
Relative Importance
Winds 4.18 2.5%
Visibility Restrictions 4.29 8.9%
Waves 3.95 3.7%
Water Movements 3.89 2.9%
Widths 3.95 5.4%
Depths 4.04 5.6%
Complexities 3.66 7.4%
Obstructions 3.96 7.5%
Fairway-use Traffic Flows 4.13 5.2%
Fairway-use Traffic Volumes 3.64 6.2%
Open-use Traffic Flows 3.98 7.9%
Open-use Traffic Volumes 3.88 8.7%
Fairway-use Vessel Qualities 3.54 3.7%
Fairway-use Crew Qualities 3.31 3.6%
Open-use Vessel Qualities 3.77 4.2%
Open-use Crew Qualities 3.46 5.3%
Tug Boats 3.71 2.8%
AtoN 4.02 2.0%
Pilotage 3.75 3.7%
VTS 3.98 2.8%
Table 5. Consequence Index and Relative Importance of Risk Factors
3. 위험도 평가기법
이 연구에서 적용한 위험도 평가기법은 식(1)의 정의를 바 탕으로 각 위험요소의 위험수준을 Table 4의 출현빈도 지수 와 Table 5의 영향력 지수의 합으로 산출하고, 산출된 각 위 험요소의 위험도 지수에 식(2)의 정의를 적용하여 Table 5의 상대적 중요도를 반영한 후, 이들의 총합으로 평가하고자 하는 해상교통환경에 대한 전체 위험도를 Table 1의 10점 척 도의 위험도 지수로 나타내는 방법이다.
예를 들어 모든 위험요소에 대한 출현빈도 지수를 1이라 가정하면, Table 2의 각 위험도 카테고리의 위험수준은 Table 5의 상대적 중요도를 적용하여 식(3) ~ 식(7)과 같이 계산되 고, 최종적으로 평가하고자 하는 해상교통환경에 대한 전체 위험도는 식(8)과 같이 계산된다.(이하 각 위험도 카테고리 의 위험수준은 ‘부분통합 위험도’라 하고, 전체 위험도는 ‘통 합 위험도’라 한다.) 따라서 위험도 카테고리의 부분통합 위 험도 및 통합 위험도를 수치로 표현할 수 있어, 서로 다른 해상교통환경에 대한 상대적 비교평가에 이용할 수 있다.
∙
∙
∙
∙
(3)
∙
∙
∙
∙
(4)
∙
∙
∙
∙
(5)
∙
∙
∙
∙
(6)
∙
∙
∙
∙
(7)
∙
∙
∙
∙
∙
(8)
4. 위험요소의 출현빈도
이 연구의 선행연구(Kim and Lee, 2012; Lee and Kim, 2013) 결과를 바탕으로 제3장에서 기술한 위험도 평가기법을 적용 해 보고자, 국내 목포항 및 그 진입수로를 총 4개의 해역으 로 구분한 후 각각의 해역에 대한 Table 3의 각 위험요소별 평가기준에 해당하는 현상들의 출현빈도를 Table 4의 출현 빈도 지수 측정법을 이용하여 분석하였다.
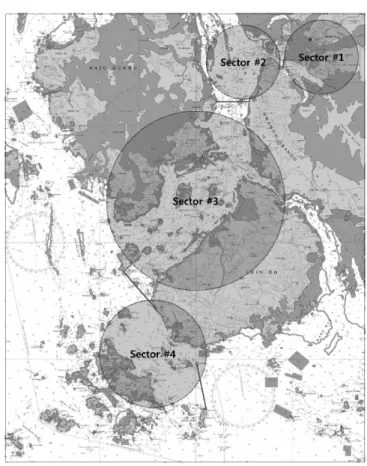
구분된 4개의 해역은 Fig. 1에서 보이는 바와 같이 섹터 1 은 목포항, 섹터 2는 시하해 항로, 섹터 3은 정등해 항로, 섹 터 4는 장죽수도를 각각 나타내며, 각 섹터 내 설정된 항로 에 대하여 각 위험요소의 출현빈도를 측정하였다.
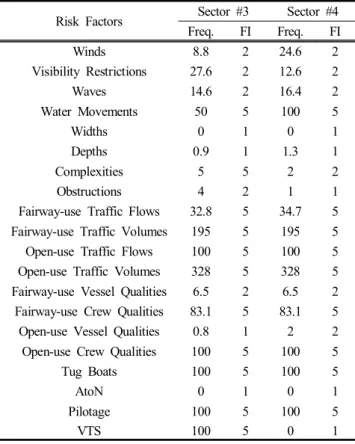
각 섹터에 대한 각 위험요소의 출현빈도 및 출현빈도 지 수의 분석결과는 Table 6 ~ Table 7과 같으며, 분석에 사용된 자료는 최근 5년(2007년~2011년)간 자료의 평균값이다.
Fig. 1. Analyzed Sea Areas.
Risk Factors Sector #1 Sector #2 Freq. FI Freq. FI
Winds 8.6 2 8.6 2
Visibility Restrictions 14.2 2 14.2 2
Waves 3.6 1 3.6 1
Water Movements 0 1 0 1
Widths 7.8 2 17.5 3
Depths 26.9 4 0 1
Complexities 5 5 2 2
Obstructions 5 2 2 1
Fairway-use Traffic Flows 22.2 4 27.3 4 Fairway-use Traffic Volumes 195 5 195 5 Open-use Traffic Flows 100 5 100 5 Open-use Traffic Volumes 328 5 328 5 Fairway-use Vessel Qualities 6.5 2 6.5 2 Fairway-use Crew Qualities 83.1 5 83.1 5 Open-use Vessel Qualities 1.6 2 0.6 1 Open-use Crew Qualities 100 5 100 5
Tug Boats 0 1 43.8 4
AtoN 0 1 0 1
Pilotage 0 1 50 4
VTS 0 1 0 1
Table 6. Frequency Index on Sector #1 & Sector #2
Risk Factors Sector #3 Sector #4 Freq. FI Freq. FI
Winds 8.8 2 24.6 2
Visibility Restrictions 27.6 2 12.6 2
Waves 14.6 2 16.4 2
Water Movements 50 5 100 5
Widths 0 1 0 1
Depths 0.9 1 1.3 1
Complexities 5 5 2 2
Obstructions 4 2 1 1
Fairway-use Traffic Flows 32.8 5 34.7 5 Fairway-use Traffic Volumes 195 5 195 5 Open-use Traffic Flows 100 5 100 5 Open-use Traffic Volumes 328 5 328 5 Fairway-use Vessel Qualities 6.5 2 6.5 2 Fairway-use Crew Qualities 83.1 5 83.1 5 Open-use Vessel Qualities 0.8 1 2 2 Open-use Crew Qualities 100 5 100 5
Tug Boats 100 5 100 5
AtoN 0 1 0 1
Pilotage 100 5 100 5
VTS 100 5 0 1
Table 7. Frequency Index on Sector #3 & Sector #4
5. 목포항 및 진입수로 위험도 평가
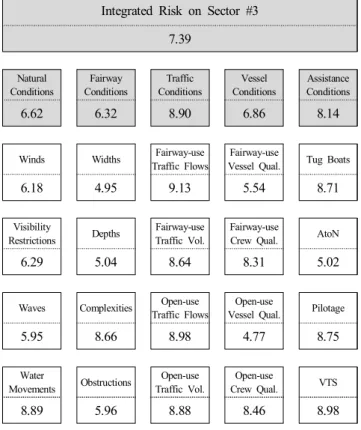
Table 6 ~ Table 7의 각 섹터에 대한 각 위험요소의 출현빈 도 지수와 Table 5의 각 위험요소별 영향력 지수를 이용하여 총 4개의 섹터로 구분된 목포항 및 그 진입수로에 대한 각 위험도 카테고리의 부분통합 위험도 및 통합 위험도의 평가 결과는 Table 8 ~ Table 11에 나타내었다.
목포항 및 그 진입수로에 대한 해상교통환경의 위험도 평 가결과 섹터 3(정등해 항로)이 7.39로 가장 높은 위험도를 나 타내었고, 섹터 1(목포항) 및 섹터 4(장죽수도)가 각각 7.08과 7.03으로 비슷한 수준을 보였으며, 섹터 2(시하해 항로)의 위 험도가 6.82로 가장 낮게 분석되었다.
섹터 3의 위험도 평가결과가 가장 높게 나타난 것은 정등 해 항로가 복잡한 수로로 구성되어 있을 뿐만 아니라 주변 항만에서의 거리가 비교적 멀어 이들 항만의 원조기능을 기 대하기가 어렵기 때문으로, 총 20가지 위험요소 중 해수운 동, 복잡성, 예인선, 도선사, 선박교통관제 등의 위험수준이 타 섹터에 비해 높게 나타난 결과이다.
섹터 2의 위험도 평가결과가 가장 낮게 나타난 것은 시하 해 항로가 비교적 넓은 해역임에도 주변의 지형에 둘러싸인 정온한 해역으로 총 20가지 위험요소 중 파랑, 해수운동, 복
잡성, 장애물 등의 위험수준이 타 섹터에 비해 낮게 나타난 결과이다.
이러한 위험도 평가결과를 각 위험도 카테고리별로 분석 해 보면, 자연조건의 부분통합 위험도가 섹터 3 및 섹터 4에 서 6.62로 섹터 1 및 섹터 2의 5.77보다 높게 나타난 것은 정
등해 항로 및 장죽수도에서 3노트이상의 조류가 출현하는
비율이 타 섹터에 비해 상대적으로 높은 결과이다.
항로조건의 부분통합 위험도가 섹터 1에서 7.18로 가장 높게 나타난 것은 목포항의 낮은 수심과 복잡한 수로가 반 영된 결과이며, 섹터 4가 5.18로 가장 낮게 나타난 것은 반대 로 장죽수도가 타 섹터에 비해 양호한 항로조건을 갖춘 것 으로 풀이할 수 있다.
교통조건과 선박조건의 부분통합 위험도가 모든 섹터에 서 비슷한 수준을 나타낸 것은 목포항 및 그 진입수로를 통 항하는 선박구성 및 교통량이 유사한 것에서 기인한다.
마지막으로 원조조건의 부분통합 위험도가 섹터 3에서 8.13으로 가장 높게 나타난 것은 정등해 항로에서 예인선, 도선사, 선박교통관제 등의 항만 원조기능을 기대하기 어렵 기 때문이며, 섹터 1에서 4.84로 가장 낮게 나타난 것은 반대 로 목포항이 타 섹터에 비해 양호한 항만 원조기능을 갖춘 것에서 기인한다.
Integrated Risk on Sector #1 7.08
Natural Conditions
Fairway Conditions
Traffic Conditions
Vessel Conditions
Assistance Conditions
5.77 7.18 8.72 7.11 4.84
Winds Widths Fairway-use
Traffic Flows
Fairway-use
Vessel Qual. Tug Boats
6.18 5.95 8.13 5.54 4.71
Visibility
Restrictions Depths Fairway-use Traffic Vol.
Fairway-use
Crew Qual. AtoN
6.29 8.04 8.64 8.31 5.02
Waves Complexities Open-use
Traffic Flows
Open-use
Vessel Qual. Pilotage
4.95 8.66 8.98 5.77 4.75
Water
Movements Obstructions Open-use Traffic Vol.
Open-use
Crew Qual. VTS
4.89 5.96 8.88 8.46 4.98
Table 8. Integrated Risk on Sector #1
Integrated Risk on Sector #2 6.82
Natural Conditions
Fairway Conditions
Traffic Conditions
Vessel Conditions
Assistance Conditions
5.77 5.59 8.72 6.86 6.57
Winds Widths Fairway-use
Traffic Flows
Fairway-use
Vessel Qual. Tug Boats
6.18 6.95 8.13 5.54 7.71
Visibility
Restrictions Depths Fairway-use Traffic Vol.
Fairway-use
Crew Qual. AtoN
6.29 5.04 8.64 8.31 5.02
Waves Complexities Open-use
Traffic Flows
Open-use
Vessel Qual. Pilotage
4.95 5.66 8.98 4.77 7.75
Water
Movements Obstructions Open-use Traffic Vol.
Open-use
Crew Qual. VTS
4.89 4.96 8.88 8.46 4.98
Table 9. Integrated Risk on Sector #2
Integrated Risk on Sector #3 7.39
Natural Conditions
Fairway Conditions
Traffic Conditions
Vessel Conditions
Assistance Conditions
6.62 6.32 8.90 6.86 8.14
Winds Widths Fairway-use
Traffic Flows
Fairway-use
Vessel Qual. Tug Boats
6.18 4.95 9.13 5.54 8.71
Visibility
Restrictions Depths Fairway-use Traffic Vol.
Fairway-use
Crew Qual. AtoN
6.29 5.04 8.64 8.31 5.02
Waves Complexities Open-use
Traffic Flows
Open-use
Vessel Qual. Pilotage
5.95 8.66 8.98 4.77 8.75
Water
Movements Obstructions Open-use Traffic Vol.
Open-use
Crew Qual. VTS
8.89 5.96 8.88 8.46 8.98
Table 10. Integrated Risk on Sector #3
Integrated Risk on Sector #4 7.03
Natural Conditions
Fairway Conditions
Traffic Conditions
Vessel Conditions
Assistance Conditions
6.62 5.18 8.90 7.11 7.15
Winds Widths Fairway-use
Traffic Flows
Fairway-use
Vessel Qual. Tug Boats
6.18 4.95 9.13 5.54 8.71
Visibility
Restrictions Depths Fairway-use Traffic Vol.
Fairway-use
Crew Qual. AtoN
6.29 5.04 8.64 8.31 5.02
Waves Complexities Open-use
Traffic Flows
Open-use
Vessel Qual. Pilotage
5.95 5.66 8.98 5.77 8.75
Water
Movements Obstructions Open-use Traffic Vol.
Open-use
Crew Qual. VTS
8.89 4.96 8.88 8.46 4.98
Table 11. Integrated Risk on Sector #4
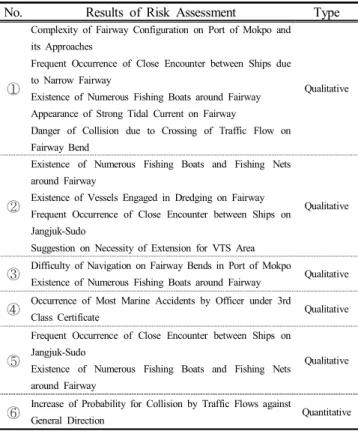
한편, 본 연구와 동일한 해역에서 위험도 평가를 수행한 타 연구사례는 발표된 연도순으로 Hong et al.(2003), Park et al.(2004), Jong et al.(2005), Hong et al.(2005), Baek et al.(2007), Kim et al.(2012) 등이 있으며, 이들 연구 사례의 분석결과를 정리하면 Table 12와 같다.
Table 12의 목포항 및 그 진입수로에 대한 타 연구의 분석 사례는 번 연구를 제외하면 모두 정성적인 위험도 평가기 법을 사용한 것으로, 목포항 및 그 진입수로의 복잡성, 항로 폭의 협소함, 항로의 교차 등으로 인한 빈번한 선박의 조우, 항로 상 어선 및 어망의 침범, 항로 상 강조류의 위험, 소형 선 및 잡종선의 항로 침범, 해상교통관제 범위의 확대 필요 성, 하위 면허 소지자에 의한 항해의 위험 등으로 요약할 수 있다. 따라서 이들 연구에서 위험요소로 분석한 사례들은 모두 본 연구의 위험요소 분류체계에 포함되고 있을 뿐만 아니라, Table 8 ~ Table 11의 위험도 평가결과에서 높은 수준 의 위험도로 나타났던 위험요소들에 대하여 동일하게 언급 하고 있다. 또한 IWRAP을 이용한 정량적 위험도 평가기법 을 사용한 번 연구결과 역시 본 연구에서 항로이용선박 교통흐름의 위험요소로 분류되어, 동일한 해역인 목포구에 서 일반적인 교통흐름에 역행하는 선박들에 의해 높은 수준 의 위험도를 나타내었던 평가결과와 일치한다.
No. Results of Risk Assessment Type
Complexity of Fairway Configuration on Port of Mokpo and its Approaches
Frequent Occurrence of Close Encounter between Ships due to Narrow Fairway
Existence of Numerous Fishing Boats around Fairway Appearance of Strong Tidal Current on Fairway
Danger of Collision due to Crossing of Traffic Flow on Fairway Bend
Qualitative
Existence of Numerous Fishing Boats and Fishing Nets around Fairway
Existence of Vessels Engaged in Dredging on Fairway Frequent Occurrence of Close Encounter between Ships on Jangjuk-Sudo
Suggestion on Necessity of Extension for VTS Area
Qualitative
Difficulty of Navigation on Fairway Bends in Port of Mokpo
Existence of Numerous Fishing Boats around Fairway Qualitative Occurrence of Most Marine Accidents by Officer under 3rd
Class Certificate Qualitative
Frequent Occurrence of Close Encounter between Ships on Jangjuk-Sudo
Existence of Numerous Fishing Boats and Fishing Nets around Fairway
Qualitative
Increase of Probability for Collision by Traffic Flows against
General Direction Quantitative
Table 12. Results of Risk Assessment on the other Studies
6. 결 론
본 연구에서는 국내 해상교통환경에 대한 전문가 그룹의 정성적인 평가와 정량적인 데이터를 이용한 위험도 평가기 법을 구축하고자, 그 기초단계의 선행연구인 Kim and Lee(2012)의 연구와 중간단계에 해당하는 선행연구인 Lee and Kim(2013)의 연구결과를 바탕으로, 해상교통환경의 위험 도를 구성하는 위험요소들의 상대적 중요도를 고려하여 합 산된 하나의 수치(위험도 지수)로 평가하고자 하는 해역의
위험도를 표현하는 최종단계의 연구를 수행하였다.
이러한 해상교통환경에 대한 위험요소의 상대적 중요도 를 고려한 본 연구의 위험도 평가기법을 국내 목포항 및 그 접근수로에 대하여 적용하여 평가한 결과, 정등해 항로의 위험도가 가장 높은 수준을 나타내는 것으로 분석되었다.
본 연구에서 제시된 위험도 평가기법은 목포항 및 그 진 입수로를 총 4개의 해역으로 구분하여 평가한 방법과 같이 하나의 해상교통환경에 대한 절대적인 평가보다는 서로 다 른 해상교통환경에 대한 위험도의 비교평가에 더 유용한 가 치를 가질 것이다.
따라서 향후 연구과제로서 국내의 주요 항만 및 항로에 대하여 본 연구에서 제시한 위험도 평가기법을 적용한 비교 평가가 필요하며, 이러한 비교연구를 통하여 제시된 평가기 법의 신뢰성에 대한 지속적인 개선작업도 병행되어야 할 것
이다. 또한 국내 해상교통환경에 대한 다양한 비교연구의 결과를 바탕으로 상대적 위험도 수준을 가시적으로 표현할 수 있는 위험도차트(Risk Chart) 혹은 안전맵(Safety Map) 구축 의 필요성을 제기한다.
참 고 문 헌
[1] Baek, W. S., J. Y. Jeong and O. S. Gim(2007), Analysis on the Navigational Dangerous Elements in Jindo Coastal VTS Area to Improve Marine Traffic System, Proceedings of 2007 KOSOMES Autumn Conference, pp. 175-176.
[2] Hong, T. H., Y. C. Seong, J. Y. Jeong, D. D. Jeong, S. H.
Park and G. K. Park(2003), A Study on Routeing in Adjacent Seas of Mokpo Port, Journal of the Korean Society of Marine Environment & Safety, Vol. 9, No. 2, pp. 39-46.
[3] Hong, T. H., K. Y. Seo, J. Y. Jeong and G. K. Park(2005), A Study on the Investigation and Analysis of the Marine Casualties at the Mokpo Approaching Waters, Proceedings of 2005 KOSOMES Spring Conference, pp. 63-66.
[4] Jong, J. Y., C. S. Kim and S. H. Park(2005), A Study on Proposal of the Improved Marine Traffic System in the Mokpo Harbor, Journal of the Korean Society of Marine Environment & Safety, Vol. 11, No. 2, pp. 1-8.
[5] Kim, C. S. and H. H. Lee(2012), A Basic Study on Assessment Criterion of the Risk Factor for the Marine Traffic Environment, Journal of the Korean Society of Marine Environment & Safety, Vol. 18, No. 5, pp. 431-438.
[6] Kim, K. I., J. S. Jeong and G. K. Park(2012), A Study on the Quantitative Risk Assessment of Mokpo Entrance Waterway by IWRAP, Proceedings of 2012 KOSOMES Spring Conference, pp. 253-256.
[7] Lee, H. H. and C. S. Kim(2013), An Analysis on the Relative Importance of the Risk Factors for the Marine Traffic Environment using Analytic Hierarchy Process, Journal of the Korean Society of Marine Environment & Safety, Vol. 19, No. 3, pp. 257-263.
[8] Park, J. H., J. S. Keum, C. K. Noh, M. O. Yun, C. H. Sin, J.
Y. Jeong and G. K. Park(2004), A Study on the Analysis of Dangerous Elements in Navigational Areas Adjacent to Mokpo Port, Journal of the Korean Society of Marine Environment & Safety, Vol. 10, No. 1, pp. 15-22.
원고접수일 : 2013년 07월 22일
원고수정일 : 2013년 08월 12일 게재확정일 : 2013년 08월 28일