Anesthetic Effects and Physiological Responses of Lidocaine-HCl in Siberian Sturgeon, Acipenser baerii
In-Bon GOOᆞIn-Seok PARK ᆞChul-Hong PARK
*ᆞYoon-Kwon NAM
**Seojoonbio Co., Ltd.ᆞ Korea Maritime and Ocean University(professor)ᆞ
*Dinoville Aquafarmᆞ
**Pukyong National University(professor)
염산리도카인에 대한 시베리안 철갑상어, Acipenser baerii의 마취효과 및 생리반응
구인본ㆍ박인석 ㆍ박철홍*ㆍ남윤권**
㈜서준바이오ㆍ 한국해양대학교(교수)ㆍ
*디노빌양식장 ㆍ
**부경대학교(교수)
Abstract
The objective of this study is to determine the optimal dose of lidocaine-HCl for anesthetizing Siberian sturgeon, Acipenser baerii, to investigate the relationship between anesthetic effectiveness and fish size, and to analyze re-anesthetic effects and stress responses to lidocaine-HCl use. The anesthesia and recovery times were affected significantly by the concentration of the anesthetic and fish body size.
Anesthesia time decreased significantly as both the lidocaine-HCl concentration and body size increased (P < 0.05), while recovery time decreased as the lidocaine-HCl concentration increased (P < 0.05).
Anesthesia time and recovery time decreased significantly as the lidocaine-HCl concentration and water temperature increased (P < 0.05). Plasma cortisol, plasma glucose, and lactic acid concentrations were indicative of stress reactions in this experiment. At 1-, 2-, and 3-day intervals, the anesthesia and recovery times increased significantly as the number of anesthesia treatments increased (P < 0.05) but were not significantly different between duplicate and triplicate treatments (P > 0.05). In 4-day interval groups, anesthesia and recovery times were not significantly different (P > 0.05) among the initial, duplicate, and triplicate treatments. Anesthesia and recovery times increased significantly with the second anesthesia treatment (P < 0.05). Anesthesia time decreased significantly as the number of anesthesia treatments increased (P < 0.05), but recovery times did not differ significantly with the increase in number of anesthesia treatments (P > 0.05). Lidocaine-HCl concentrations of 50 and 250 ppm in the larval and juvenile groups, respectively, showed an optimal anesthesia time of approximately 1 min. The optimal anesthesia interval of lidocaine-HCl was 4 days, and frequent anesthesia resulted in negative effects by inhibiting sensitivity.
Key words : Siberian sturgeon (Acipenser baerii), Anesthetic effect, Lidocaine-HCl, Stress response
†Corresponding author : 051-410-4321, [email protected]
Ⅰ. Introduction
The Siberian sturgeon, Acipenser baerii is
considered “living fossils”(Bemis et al., 1997).
Their primitive characteristics, such as a
heterocercal tail and cartilaginous skeleton, have
been maintained over approximately 100–200 million years despite major environmental changes(Gomulka et al., 2008). The Siberian sturgeon have undergone multiple genome duplications during their evolution, which may account for their resistance to deleterious mutations, since there are probably several functional copies of every gene(Blacklidge and Bidwell, 1993). Their primitive characteristics make sturgeons intriguing animals for study, since their biochemical and hematological profile may differ substantially from that of teleost fishes. All sturgeon species worldwide are covered under the provisions of the convention on international trade in endangered species. Several species are considered to be threatened with extinction as a result of over-fishing, poaching, water pollution, damming, and destruction of natural water courses and habitats(Gomulka et al., 2008). The culture of sturgeons is a growing aquaculture field in Europe and Northeastern Asia due to the need to actively protect natural populations and the high demand for caviar. Usually, their large size and sharp bony shields on the body surface make handling sturgeon spawners difficult and dangerous for operating personnel(Gomulka et al., 2008).
The use of general anesthetics is a common practice in sturgeon culture, especially during artificial propagation. Anesthetics are also used during sorting, tagging, surgery, and other stress-inducing procedures. Among its principal uses, anesthesia facilitates the following operations:
weighing and measuring, marking and tagging, studying fish physiology and behavior, performing surgery, collecting fish in tidal pools and with scuba, photography, preparing fish for live shipment and transport, manual spawning, injecting vaccines and antibiotics, and collecting blood and other
tissues(Park et al., 1998, 2011). Anesthesia can decrease the stress levels in fish subjected to blood sampling, immobilization, handling, injection of vaccines and antibacterial substances, medical treatment for diseases, artificial spawning, transport, and sorting(Park et al., 2011).
Considerations of toxicity (to users and fish), efficacy, price, regulations for use, and the purpose of using anesthesia influence the choice of the ideal anesthetic. This ideal anesthetic should have the following characteristics: (1) an anesthetic time within 3 min and a recovery time within 5 min, (2) non-toxicity to the fish, (3) ease of use and non-toxicity to the user, (4) absence of effects on the physiology and movement of the experimental fish, (5) excretion of the anesthetic from the body so that no withdrawal period is required, (6) absence of accumulation effects from repeated administrations of anesthesia and absence of side effects, and (7) cost-effectiveness(Park et al., 1998, 2003). Traditionally, chemicals (e.g., urethane, ether, and chloroform) have been used to anesthetize fish.
However, these substances are now restricted because they are carcinogenic(Hasler and Meyer, 1942).
In aquaculture, many anesthetics have been used
to anesthetize fish. The most commonly used are
tricaine methanesulphonate (MS-222), benzocaine,
carbon dioxide, clove oil, AQUI-S, quinaldine,
quinaldine sulphate, 2-phenoxyethanol, metomidate,
and etomidate(Marking and Meyer, 1985; Ross and
Ross, 2008). The human anesthetic compound
lidocaine-HCl [2-(diethylamino)-N-(2, 6-dimethylphenyl)
acetimide hydrochloride], a white, water-soluble
powder, is safe, inexpensive, non-toxic in the
environment, and does not require a withdrawal
period compared with other anesthetic chemicals. It
was first administered to fish by Carrasco et al.
(1984). Lidocaine-HCl, which has been safely used in dentistry, has been proven to be a safe anesthetic for some freshwater and marine fish in Korea(Park et al., 1998). A number of studies have investigated its effectiveness, economic viability, reusability, toxicity, and side effects to ascertain its appropriateness as a fish anesthetic(Summerfelt and Smith, 1990). Despite the common use of anesthetics in fish, there is little information about the influence of lidocaine-HCl on sturgeon. The objective of this study is to determine the optimal dose of lidocaine-HCl for anesthesia in Siberian sturgeon, to investigate the relationship between anesthetic effects and fish size, and to analyze the re-anesthetic effects and stress responses to lidocaine-HCl.
Ⅱ. Materials and Methods
Two year-olds Siberian sturgeon, Acipenser baerii and fertilized eggs were obtained from Pukyung National University, Korea. While 7 years, two year-olds Siberian sturgeons were reared and bred, and fertilized eggs were hatched and bred in the Fishery Genetics and Breeding Sciences Laboratory (FGBS Lab) of the Korea Maritime and Ocean University (KMOU). On July 30 2017, fertilized eggs were collected from matured sturgeon (8 year-olds samples), and were hatched and reared in FGBS Lab of KMOU. On July 14 2018, fertilized eggs were collected from matured samples (9 year-olds), and were hatched and reared for 3 weeks. On August 4 2018, small, middle and large samples were selected for the study at 3 weeks, 1 year, and 9 years after hatching, respectively. 3 week-olds (small size; fertilized on July 2018), 1 year-olds (middle size; fertilized on July 2017), and
9 year-olds (large size; obtained on June 2011) samples used in the study were weighed using an electronic balance (Shimadzu, Japan) and measured using Vernier calipers (Mitutoyo, Japan). Hereafter, we refer to the small, middle, and large size groups as larval, juvenile, and adult groups, respectively. The average body lengths in the larval, juvenile, and adult groups were 10.2±0.84 cm (n=50), 40.8±3.52 cm (n=50), and 84.1±6.91 cm (n=50), respectively. The average body weights of the larval, juvenile, and adults groups were 4.6±0.45 g (n=50), 334.9±60.04 g (n=50), and 2351±534.4 g (n=50), respectively. Aquarium water parameters were maintained during the experimental period <Table 1>, which began on August 10, 2018 and ended on December 21, 2018.
Twenty specimens from each size group were randomly selected to investigate the anesthetic effects of lidocaine-HCl (Hongsung Chemical, Korea). In order to neutralize the anesthetic solution and to amplify its effect(Carrasco et al., 1984; Park et al., 1998), 1,000 ppm NaHCO
3(Sigma, USA) was prepared as the total concentration. The series of lidocaine-HCL concentration samples were prepared at 50, 100, 150, 200, 250 and 300 ppm, based on the results of preliminary experiments.
Diluted water with 1,000 ppm of NaHCO
3concentration sample was set up as the control
group. Aquarium and anesthetic waters were
maintained at 20°C for the duration of the
experiment. All fish were fasted for 24 hrs prior to
the study. The study methods followed those of
Park et al. (2011). Briefly, one specimen was
selected randomly from the breeding tube using a
net. The fish was then anesthetized in a 10-L
rectangular parallelepiped plastic tube controlled by
an aeration system. Once the fish was anesthetized,
Test parameters* Condition
pH 7.1 ± 0.65
DO (dissolved oxygen; mg/L; Saturated concentration in 26℃) 7.6
Ammonia (ppm) 0.01
Nitric acid (ppm) 1.8 ± 0.14
Nitrous acid (ppm) 0.01
Conductivity (µs/cm) 238
*Test parameters were analyzed at 1 hr before experiment. Dissolved oxygen, pH and conductivity were measured using an oxygen measurement electrode and a multi-data logger system (Oxyguard, Denmark). Ammonia, nitric acid, nitrous acid, and conductivity were measured using spectrophotometer (DR2800, HACH, Loveland, Colorado, USA). The values are means of triplicate groups.
<Table 1> Experimental water condition for Siberian sturgeon, Acipenser baerii in this anesthetic experiment
Anesthesia
Stage Characteristic behaviors
A1 Normal swimming, opercular movement and normal general movement A2 Slow swimming speed, rolling from side to side
A3 Partial loss of equilibrium, erratic swimming
A4 Complete loss of equilibrium, swimming perfectly inside out, movement stop of pectoral, pelvic and dorsal fins
A5 Little sedation, movement of anal and tail fins stop
A6 Perfect sedation, only opercular movement, when flip the sample, no reaction observed A7 Opercular movement ceased
Recovery
Stage Characteristic behaviors
R1 Resume opercular movement
R2 Preferential movement of pectoral and tail fins R3 Movement of dorsal, pelvic and anal fins R4 Swimming perfectly inside out
R5 Erratic recovery swimming of balance, when flip the sample, observed to flip themselves R6 Normal swimming, responsiveness to visual stimuli
*Modified from Park et al. (2011).
<Table 2> Stages of anesthesia induction and recovery in clove oil efficacy tests performed in Siberian sturgeon, Acipenser baerii*
it was moved immediately to the recovery tube.
The anesthetic levels and recovery times of the fish were measured in seconds using a stopwatch. All experiments were completed in triplicate.
As shown in <Table 2>, the anesthetizing and
recovery protocols followed the decision-based anesthetic effect table developed by Park et al.
(2011). Briefly, anesthetizing marine medaka
Oryzias dancena involved several stages, from
slowed swimming speed and side-to-side rolling
(stage A2) to only opercular movement (stage A6).
At stage A6, individuals were transferred to a recovery tank. Recovery time was established as the point at which erratic swimming began. Recovery time included redressing balance (stage R5, Table 1) and normal swimming, as well as responsiveness to visual stimuli (stage R6, Table 1). Our study used stages A6 and R6 as endpoints for anesthesia and recovery, respectively. Twenty specimens of the juvenile group were randomly selected to investigate the anesthetic effects of lidocaine-HCl.
Experimental fish were adapted to 400-L glass tubes, which were maintained at the same temperatures as the experimental water temperatures (15, 20, and 25°C). After being anesthetized, fish were transferred to recovery tubes of equivalent water temperatures. All fish were fasted for 24 hrs prior to the experiment. The methods and stages of anesthesia and recovery followed those of Park et al. (2011).
To analyze the stress response to lidocaine-HCl, blood physiological responses of the control group (non-anesthetic) and experimental group (200 ppm lidocaine-HCl anesthesia) were measured. Blood samples from each group were extracted from fifty randomly selected fish 0 (control), 1, 6, 12, 24, 48, 72, and 96 hrs after anesthesia. Fish used in this experiment were not involved in the experiments assessing anesthetic effects. Blood was collected from the caudal vasculature using a disposable syringe (3 mL, Sung Shim Medical Co., Ltd, Bucheon, Korea) and heparin sodium (Shin Poong Pharm. Co., Ltd, Ansan, Korea). Blood was extracted within 1 min to minimize the handling stress imposed on the fish and allowed to sit for 10 min at room temperature prior to centrifugation for 10 min at 20,000 g (Centrifuge Micro 17R,
Hanil Science Industrial Co., Ltd, Incheon, Korea).
The collected serum was transferred to another 1.5 mL microtube and stored at -70°C in a super low-temperature freezer (CLN-50UW Nihon Freezer, Nihon Co., Japan) prior to analysis.
Plasma cortisol concentrations were measured after the antigen-antibody response was derived using the 1470 WIZARD Automatic Gamma Counter (Cobra, Packard Co., Ramsey, MN, USA) and the Coat-A-count TKCO Cortisol RIA Kit (DPC, Los Angeles, CA, USA), following Donaldson (1981). Plasma glucose concentrations were analyzed following Raabo and Terkildsen (1960; Kit 510, Sigma, St Louis, MO, USA), and production of H
2O
2by glucose oxidase in the presence of o-dianisidine was measured as an absorbance peak at 450 nm. Lactic acid concentrations were analyzed using a blood automatic analysis (Boehringer Mannhein Reflotron, Germany).
Fifty specimens from the juvenile group were randomly selected to investigate anesthetic sensitivity to lidocaine-HCl and the effect of re-anesthesia. To analyze the anesthetic sensitivity to lidocaine-HCl, anesthesia treatments were performed three times (initial, duplicate, and triplicate). Anesthesia time intervals were 1, 2, 3, 4, 5, 6, and 7 days. To investigate the re-anesthetic effect of lidocaine-HCl, re-anesthesia was conducted seven times at 1-day intervals. The methods and stages of anesthesia and recovery used followed those of Park et al. (2011).
Ⅲ. Results
There were no signs of mortality in the control
group and lidocaine-HCl groups. <Table 3> presents
Concentra-
tions Exposure time (sec) Recovery time (sec)
(ppm) Larvae Juveniles Adults Larvae Juveniles Adults
50 63 ± 2.2a 119 ± 21.5a 181 ± 21.4a 180 ± 23.8a 133 ± 13.2b 186 ± 13.8c 100 43 ± 1.6b 77 ± 13.3b 154 ± 14.7b 179 ± 30.5a 134 ± 14.2b 174 ± 14.8b 150 37 ± 2.1c 066 ±0 4.5c 140 ± 13.2c 183 ± 23.6a 129 ± 09.4ab 167 ± 10.1a 200 33 ± 2.5c 060 ±0 6.1c 135 ± 12.1c 178 ± 31.4a 129 ± 13.6ab 168 ± 09.1a 250 32 ± 1.9d 50 ±0 4.2d 121 ± 17.1d 182 ± 35.1a 125 ± 10.3ab 169 ± 08.4a 300 32 ± 1.7d 43 ±0 3.5e 110 ± 14.5e 179 ± 38.9a 124 ± 12.2a 165 ± 08.9a
Two-way ANOVA DF Anova SS Mean
square F-value P-value DF Anova SS
Mean
square F-value P-value Body size 02 185841.0 68594.629 550.483 < 0.0001 02 116492.0 21558.4 911.23 < 0.0001 Dose 05 389425.1 61573.945 538.561 < 0.0001 05 10618.6 003588.1 0159.89 < 0.0001 Interaction 10 081269.4 21135.358 193.145 < 0.0001 10 9145.1 00 811.5 0031.23 < 0.0001
*Water temperature of each size was 20°C in each concentration of lidocaine-HCl. Each value is mean ± standard deviation (n=50) of triplicate groups. Values in the same column not sharing common superscripts are significantly different among each concentration (P< 0.05).
<Table 3> Effects of lidocaine-HCl dose and body size on anesthesia for Siberian sturgeon, Acipenser baerii larvae, juveniles and adults*
the parameters associated with the anesthesia and recovery times of lidocaine-HCl at each anesthetic concentration and body size of Siberian sturgeon, Acipenser baerii. Anesthesia time and recovery time were affected significantly by the concentration of anesthesia and body size of the fish. Anesthesia time decreased significantly as both the lidocaine-HCl concentration and body size of Siberian sturgeon increased (P<0.05), and recovery time decreased significantly as the lidocaine-HCl concentration increased (P<0.05). The adult group had a slower anesthesia time than that of the other groups at equivalent lidocaine-HCl concentrations, while the fastest recovery time was seen in the juvenile group. Lidocaine-HCl concentrations of 50 and 250 ppm in the larval and juvenile groups, respectively, showed the optimal anesthesia time of
approximately 1 min. The concentrations of lidocaine-HCl that displayed the optimal anesthesia time of approximately 1 min were not determined for adult fish.
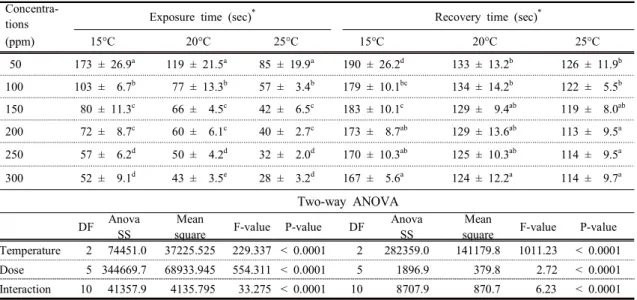
<Table 4> shows the parameters associated with the effects of lidocaine-HCl at each concentration and water temperature in the juvenile group.
Anesthesia recovery times were affected
significantly by the anesthetic’s concentration and
water temperature. Anesthesia and recovery times
decreased significantly as the lidocaine-HCl
concentration and water temperature increased
(P<0.05). As the concentration of lidocaine-HCl
increased, the anesthesia time decreased significantly
(P<0.05) at each temperature. At each
lidocaine-HCl concentration, the anesthesia time also
Concentra-
tions Exposure time (sec)* Recovery time (sec)*
(ppm) 15°C 20°C 25°C 15°C 20°C 25°C
50 173 ± 26.9a 119 ± 21.5a 85 ± 19.9a 190 ± 26.2d 133 ± 13.2b 126 ± 11.9b 100 103 ± 6.7b 77 ± 13.3b 57 ± 3.4b 179 ± 10.1bc 134 ± 14.2b 122 ± 5.5b 150 080 ± 11.3c 66 ± 4.5c 42 ± 6.5c 183 ± 10.1c 129 ± 9.4ab 119 ± 8.0ab 200 072 ± 8.7c 60 ± 6.1c 40 ± 2.7c 173 ±0 8.7ab 129 ± 13.6ab 113 ± 9.5a 250 057 ± 6.2d 50 ± 4.2d 32 ± 2.0d 170 ± 10.3ab 125 ± 10.3ab 114 ± 9.5a 300 052 ± 9.1d 43 ± 3.5e 28 ± 3.2d 167 ± 5.6a 124 ± 12.2a 114 ± 9.7a
Two-way ANOVA DF Anova
SS
Mean
square F-value P-value DF Anova SS
Mean
square F-value P-value Temperature 02 74451.0 37225.525 229.337 < 0.0001 02 282359.0 141179.8 1011.23 < 0.0001 Dose 05 344669.7 68933.945 554.311 < 0.0001 05 1896.9 0 379.8 2.72 < 0.0001 Interaction 10 041357.9 04135.795 033.275 < 0.0001 10 8707.9 0 0870.7 00 6.23 < 0.0001
*Each value is mean ± standard deviation (n=50). Values in the same column not sharing common superscripts are significantly different among each concentration (P< 0.05).
<Table 4> Effects of lidocaine-HCl concentrations and water temperature on exposure time and recovery time for Siberian sturgeon, Acipenser baerii juveniles
decreased significantly (P<0.05) as water temperature increased. The recovery time decreased significantly as the lidocaine-HCl concentration and water temperature increased (P < 0.05), with the exception of the 200 and 250 ppm anesthesia concentrations at 15°C, the 150, 200, and 250 ppm concentrations at 20°C, and the 200, 250, and 300 ppm concentrations at 25°C. Lidocaine-HCl concentrations of 250 ppm at 15 and 20°C and 100 ppm at 25°C represented the optimal anesthetic time of approximately 1 min.
[Fig. 1] shows the average plasma cortisol concentrations in the control (no anesthesia) and experimental (200 ppm lidocaine-HCl) groups over 96 hrs. The plasma cortisol concentration at each time point was affected significantly after anesthesia and was significantly different after 72 hrs. The mean plasma cortisol concentrations of the control were 1.0±0.15 µg/dL before the experiment, 15.4±1.51 µg/dL 1 hr after anesthesia, and
38.1±1.43 µg/dL 6 hrs after anesthesia (P<0.05;
Fig. 1). The plasma cortisol concentration of the control recovered to 1.1±0.56 µg/dL after 96 hrs and was significantly higher than that before the experiment (P<0.05). The plasma cortisol concentrations of the experimental group were 0.9±0.20 µg/dL before the experiment (P < 0.05;
[Fig. 1]), 10.1±1.44 µg/dL 1 hr after anesthesia, and 29.4±1.58 µg/dL 12 hrs after anesthesia (P<0.05), and the concentration recovered to 1.0±0.61 µg/dL after 96 hrs.
[Fig. 2] shows the average plasma glucose
concentrations in the control (no anesthesia) and
experimental (200 ppm lidocaine-HCl) groups over
96 hrs. Plasma glucose concentrations in the
experimental group were significantly different from
thoseof the control at each time point from 6 to 48
hrs after anesthesia. The plasma glucose
concentrations of the control and experimental
groups before the experiment were 30±2.0 mg/dL
Non-anesthetic
[Fig. 1] Variations of the plasma cortisol concentrations in juvenile group of Siberian sturgeon, Acipenser baerii, during 96 hrs. Anesthetic concentration of lidocaine-HCl and water temperature were 200 ppm and 20°C, respectively. Pre means control group before anesthesia. Vertical bars are means ± SE (n=50). Different letters on error bars are significantly different between no anesthesia and lidocaine-HCl anesthesia groups (P<0.05).
Non-anesthetic Lidocaine-HCl 200ppm
[Fig. 2] Variations of the plasma glucose concentrations in juvenile group of Siberian sturgeon,
Acipenser baerii, during 96 hrs. Anesthetic concentration of lidocaine-HCl and water temperature
were 200 ppm and 20°C, respectively. Pre means control group before anesthesia. Vertical bars
are means ± SE (n=50). Different letters on error bars are significantly different between no
anesthesia and lidocaine-HCl anesthesia groups (P<0.05).
and 31±2.2 mg/dL, respectively [Fig. 2] and increased from 60±14.4 mg/dL and 50±15.6 mg/dL at 1 hr to 380±14.5 mg/dL and 220±18.4 mg/dL at 12 hrs after anesthesia, respectively (P<0.05).
Plasma glucose concentrations of the control and experimental groups recovered to 30±17.5 mg/dL and 30±15.0 mg/dL, respectively, by 96 hrs and were similar to the levels before the experiment (P<0.05).
[Fig. 3] shows the average lactic acid concentrations in the control (non-anesthetic) and experimental (200 ppm lidocaine-HCl) groups after 96 hrs. Lactic acid concentrations in the experimental group at each time point from 1 to 48 hrs after anesthesia were significantly different from those in the control group. Lactic acid
concentrations of the control and experimental groups were 0.9±0.21 mg/dL and 0.9±0.22 mg/dL, respectively, before the experiment, peaking at 24 and 48 hrs in the control group and at 48 hrs after anesthesia in the experimental group [Fig. 3]. The concentration increased more rapidly in the control than in the experimental groups. The lactic acid concentrations in the control and experimental groups recovered to 1.3±0.49 µg/dL and 1.4±0.39 µg/dL, respectively, by 96 hrs and were higher than levels before the experiment (P<0.05). Blood physiological responses of the control groups at 6, 12 and 24 hrs after anesthesia were more sensitive than those of experimental groups significantly (P<0.05).
Non-anesthetic
[Fig. 3] Variations of the lactic acid concentrations in juvenile group of Siberian sturgeon, Acipenser baerii, during 96 hrs. Anesthetic concentration of lidocaine-HCl and water temperature were 200 ppm and 20°C, respectively. Pre means control group before anesthesia. Vertical bars are means
± SE (n=50). Different letters on error bars are significantly different between no anesthesia and
lidocaine-HCl anesthesia groups (P<0.05).
Anesthetic interval
(Day)
Re-exposure time (sec) Recovery time (sec)
Initial Duplicate Triplicate Initial Duplicate Triplicate
1 60 ± 6.1a 81 ± 3.5b 75 ± 4.1b 129 ± 13.6a 146 ±06.4b 145 ±06.1c 2 60 ± 6.1a 75 ± 4.1b 74 ± 3.5b 129 ± 13.6a 141 ±09.8b 146 ± 10.0c 3 60 ± 6.1a 66 ± 5.5b 66 ± 4.0b 129 ± 13.6a 134 ± 12.8b 134 ±09.1b 4 60 ± 6.1a 61 ± 3.4a 60 ± 3.3a 129 ± 13.6a 128 ±08.5a 130 ± 12.1a 5 60 ± 6.1a 60 ± 4.1a 61 ± 3.9a 129 ± 13.6a 126 ± 10.1a 129 ± 11.8a 6 60 ± 6.1a 61 ± 5.0a 59 ± 4.0a 129 ± 13.6a 127 ±09.1a 128 ±09.7a 7 60 ± 6.1a 59 ± 4.2a 60 ± 3.7a 129 ± 13.6a 130 ±08.6a 129 ± 10.3a
*Anesthetic concentrations of lidocaine-HCl and water temperature were 200 ppm and 20°C, respectively in each group.
Each value is mean ± standard deviation (n=50) of triplicate groups. Values in the same column not sharing common superscripts are significantly different among each day (P< 0.05).