https://doi.org/10.5228/KSTP.2017.26.3.162
수치해석을 이용한 탄소강 다단 신선 와이어 표면 잔류응력 예측
이선봉1 · 이인규2 · 정명식2 · 김병민3 · 이상곤#
Prediction of Surface Residual Stress of Multi-pass Drawn Steel Wire Using Numerical Analysis
S. B. Lee, I. K. Lee, M. S. Jeong, B. M. Kim, S. K. Lee
(Received March 20, 2017 / Revised April 26, 2017 / Accepted May 18, 2017)
Abstract
The tensile surface residual stress in the multi-pass drawn wire deteriorates the mechanical properties of the wire.
Therefore, the evaluation of the residual stress is very important. Especially, the axial residual stress on the wire surface is the highest. Therefore, the objective of this study was to propose an axial surface residual stress prediction model of the multi-pass drawn steel wire. In order to achieve this objective, an elastoplastic finite element (FE) analysis was carried out to investigate the effect of semi-die angle and reduction ratio of the axial surface residual stress. By using the results of the FE analysis, a surface residual stress prediction model was proposed. In order to verify the effectiveness of the prediction model, the predicted residual stress was compared to that of a wire drawing experiment.
Key Words : Multi-pass Drawn Wire, Surface Residual Stress, Prediction Model, Finite Element Analysis
1. 서 론
다단 신선(multi-pass drawing)공정은 초기 와이어를 여러 개의 다이(die)를 통과시켜 원하는 직경의 와이 어를 제조하는 성형공정이다. 스틸(steel) 와이어의 경우 교량용 케이블, 타이어 코드(tire cord), 스프링 (spring) 등에 폭넓게 활용된다[1~6]. 인발공정의 경 우, 다이 통 시 다이와 접촉하는 소재 표면부와 중 심부의 변형량 차이로 인한 불균일한 변형, 그리고 발생열 등으로 인해 와이어 표면 및 내부에 잔류응 력(residual stress)이 발생하게 된다[7].
지금까지 인발공정 시 와이어에 발생하는 잔류응 력에 관한 다양한 연구들이 수행되었다. Atienza 등 은 XRD 를 이용하여 신선된 와이어의 3 방향에 대
한 잔류응력을 평가하였다[8]. Ö verstam 는 유한요소 해석을 통해 다이 랜드부 길이가 잔류응력에 미치 는 영향을 평가하였다[9]. Kuboki 등은 잔류응력 발 생 기구를 설명하였으며, 잔류응력 완화를 위한 다 이 형상을 제안하였다[10~12]. Ko 등은 유한요소해석 을 이용하여 공정변수가 잔류응력에 미치는 영향을 평가하였다[13]. Lee 등은 신선된 고탄소강 와이어의 잔류응력을 평가하였다[14].
신선 후 와이어 내부에 발생하는 잔류응력은 Fig.
1 에서 보듯이, 축방향 잔류응력(axial residual stress), 원주방향 잔류응력(hoop residual stress), 그리고 반경 방향 잔류응력(radial residual stress)으로 구분되며, 세 성분 중 표면부의 축방향 잔류응력이 가장 크다.
와이어 내부 혹은 표면에 인장잔류응력 발생 시 1. 계명대학교 기계자동차공학과
2. 한국생산기술연구원 극한가공기술그룹 3. 부산대학교 기계공학부
# Corresponding Author : Korea Institute of Industrial Technology, E- mail: [email protected]
Fig. 1 Distribution of residual stress in drawn wire
와이어 강도저하 등 기계적 성질을 저하시킨다. 따 라서, 잔류응력예측이 가능할 경우 와이어의 기계적 성질 평가를 위한 데이터로 활용 가능하다.
따라서, 본 연구에서는 탄소강 와이어 다단 신선공 정 시 와이어 표면에서 발생하는 축방향 잔류응력 예측 모델을 제안하였다. 이를 위해 먼저, 탄소성 (elastoplastic) 유한요소해석을 통해 감면율(reduction ratio)과 다이 반각(semi-die angle)이 와이어 표면 잔 류응력에 미치는 영향을 평가하였다. 또한, 해석결 과를 이용하여 감면율과 다이 반각으로 표현되는 표면 잔류응력 예측식을 제안하였으며, 신선 와이어 의 잔류응력을 측정하여 그 타당성을 검증하였다.
Fig. 2 Mechanism of axial residual stress of multi-pass drawn wire
2. 신선 와이어 잔류응력
Fig. 1 의 와이어 잔류응력 분포에서 알 수 있듯이, 축방향 잔류응력과 원주방향 잔류응력은 중심부에 서 압축(compressive)이지만 표면부로 갈수록 인장 (tensile)으로 바뀌며, 표면에서 최대 인장응력이 발 생한다. 반경방향 잔류응력은 중심부에서 압축이지 만, 표면부의 경우 경계조건(boundary condition)으로 인해 잔류응력은 제로(zero)다.
와이어(drawn wire) 잔류응력 성분 중 표면부에 발 생하는 인장잔류응력은 와이어의 인장강도 저하, 표 면 크랙 진전(crack propagation) 등 와이어의 기계적 성질을 저하시키는 원인이다. 따라서, 와이어 표면 부에 발생하는 인장잔류응력의 예측 및 저하는 매 우 중요하다.
Akiyama 등은 신선 후 와이어에 발생하는 축방향 잔류응력 발생 기구를 설명하였다[15]. Fig. 2는 축방 향 잔류응력 발생기구를 나타낸 것이다. Fig. 2에서 점 S와 C는 각각 와이어의 표면부과 중심부를 나타 낸다. 신선 시 축방향 변형량은 다이와 직접적인 접 촉이 발생하지 않는 중심부가 표면부 보다 높다. 따 라서, 와이어가 첫 다이를 통과하는 동안 표면부 변 형은 O Y S1으로, 중심부는 O Y C1으로 변 한다. 이후 와이어가 첫 번째 다이를 완전히 통과한 후에는 표면부와 중심부의 불균일한 변형이 탄성적 균형을 맞추기 위해서 표면부는 S1에서 S2로, 중심 부는 C1에서 C2로 이동된다. Fig. 2에서 보듯이, S2와 C2는 균형이 이루어진 지점이다. 이와 같이 축방향 변형량이 많은 중심부와 변형량이 적은 표면부가
Fig. 3 Initial FE analysis model
Table 1 Conditions for FE analysis
Conditions Value
Number of passes 23
Wire material AISI 1072
Initial wire diameter (mm) 1.050 Final wire diameter (mm) 0.188
Bearing length of die (mm) 0.3 × initial wire diameter Semi-die angle (o) 5.0, 6.0, 7.0, 8.0 Flow stress of initial wire (MPa) 2194.50.205
Yield strain 0.0056
Young’s modulus (GPa) 210.0
Poisson’s ratio (ν) 0.3
Fig. 4 Surface axial residual stress after drawing
변형 균형을 맞춤으로 인해 중심부는 압축 잔류응 력이, 그리고 표면부는 인장 잔류응력이 발생하게 된다. 두 번째 다이 통과 후에서 첫 번째 다이 통과 시와 동일한 기구로 잔류응력이 발생하게 된다. 따 라서, 표면부는 S2 S1 S3 S4 로, 중심부는 C2
C1 C3 C4로 이동하게 된다.
3. 다단 신선공정 탄소성 유한요소해석
이전 연구결과들에 의하면 잔류응력은 공정변수 에 많은 영향을 받는다[10,11,13]. 특히, 다이 반각
0.0 0.5 1.0 1.5 2.0 2.5 3.0 3.5 4.0 0
200 400 600 800 1000 1200 1400 1600
Axial surface residual stress(MPa)
Effective strain 23 pass, semi-die angle 5o
0.0 0.5 1.0 1.5 2.0 2.5 3.0 3.5 4.0 0
200 400 600 800 1000 1200 1400 1600 1800 2000 2200
Axial surface residual stress(MPa)
Effective strain 23 pass, semi-die angle 6o
0.0 0.5 1.0 1.5 2.0 2.5 3.0 3.5 4.0 0
200 400 600 800 1000 1200 1400 1600 1800 2000 2200 2400
Axial surface residual stress(MPa)
Effective strain
23 pass, semi-die angle 7o
0.0 0.5 1.0 1.5 2.0 2.5 3.0 3.5 4.0 0
200 400 600 800 1000 1200 1400 1600 1800 2000 2200 2400
Axial surface residual stress(MPa)
Effective strain
23 pass, semi-die angle 8o
Fig. 5 Surface axial residual stress in accordance with strain and semi-die angle
(semi-die angle), 감면율(reduction ratio), 그리고 소재 유동응력(flow stress curve)가 많은 영향을 미친다.
먼저, 본 연구에서는 탄-소성 유한요소해석을 통
0.0 0.5 1.0 1.5 2.0 2.5 3.0 3.5 4.0 0
500 1000 1500 2000 2500
3000 Flow stress curve
Stress (MPa)
Effective strain
Flow stress Axial residual stress
23 pass, 5o 23 pass, 6o 23 pass, 7o 23 pass, 8o
Fig. 6 Flow stress and surface axial residual stress
0.0 0.5 1.0 1.5 2.0 2.5 3.0 3.5 4.0 0
10 20 30 40 50 60 70 80 90 100
Avg. : 81.09 Avg. : 79.66 Avg. : 63.27 Avg. : 51.34
Stress ratio(SR) (%)
Effective strain
23 pass, semi-die angle 5o 23 pass, semi-die angle 6o 23 pass, semi-die angle 7o 23 pass, semi-die angle 8o
Fig. 7 Stress ratio between flow stress and surface axial residual stress
해 다단 신선공정 시 와이어 표면에 발생하는 축방 향 잔류응력을 평가하였다. 유한요소해석은 상용해 석 소프트웨어인 DEFORM-2D로 수행되었다. 적용 소재는 AISI 1072 고탄소강 와이어이며, 23패스 공정 이 적용되었다. 초기 선재직경과 최종 선재직경은 각각 1.050 mm와 0.188 mm이다. Fig. 3에 초기 유한요 소해석 모델을 나타내었으며, 기타 유한요소해석 조 건은 Table 1에 나타내었다.
해석 후 잔류응력은 Fig. 4에서 보듯이 와이어가 다이를 완전히 통과한 후 와이어 표면부 10 포인트 에 대한 평균값으로 평가하였다.
Fig. 5에 각 해석조건에 따른 표면 축방향 잔류응 력(surface axial residual stress)를 나타낸 것이다. 패스 증가에 따른 변형률이 증가할수록 잔류응력이 증가 함을 알 수 있다. 또한, 동일한 변형률에 대하여 다 이 반각이 높을수록 잔류응력이 높음을 알 수 있다.
이는 다이 반각이 높을 경우 와이어 표면부와 중심
5 6 7 8
0 10 20 30 40 50 60 70 80 90 100
Fitted curve(f(a))
Average stress ratio (%)
Semi-die angle() (o)
Fig. 8 Average stress ratio according to semi-die angle
부의 변형 불균일이 증가하기 때문이다.
4. 축방향 표면 잔류응력 예측 및 평가
Fig. 6 은 초기 와이어의 유동응력(flow stress curve) 과 잔류응력을 함께 나타낸 그래프이다. Fig. 6 에서 보듯이 잔류응력은 소재의 유동응력과 유사한 경향 을 나타내고 있음을 알 수 있다.
Fig. 7은 식(1)과 같이 유동응력과 잔류응력의 비 (ratio)인 응력비(stress ratio: SR)를 나타낸 것이다.
100 RS ES
SR[%] / (1)
여기서, ES는 유효응력(effective stress), RS는 표면부 축방향 잔류응력(surface axial residual stress)이다. Fig. 7 에서 다이 반각 변화에 따라 SR은 거의 일정한 값 을 나타내고 있다. SR의 평균값은 다이반각 5o, 6o, 7o, 그리고 8o일 때 각각 51.34%, 63.27%, 79.66%, 그리고 81.09%였다.
Fig. 8 은 Fig. 7 로부터 도출된 다이 반각에 따른 SR 의 평균값을 나타낸 것이다. 평균값은 다이 반 각(α)이 증가함에 따라 증가하다가 7o 이상부터 일 정한 값을 나타내었다. Fig. 8 의 응력비 평균값은 다음의 식(2)와 같이 다이 반각 함수로 표현될 수 있다.
100 84 100 72 44 63 2
f()( . 2 . . )/ (2)
따라서, 표면부 축방향 잔류응력(σaxial)은 식(2)와 소재의 유동응력 곡선으로부터 다음의 식(3)으로 표 현 가능하다.
0.0 0.5 1.0 1.5 2.0 2.5 3.0 3.5 4.0 0
500 1000 1500 2000 2500
3000 Flow stress curve
Stress (MPa)
Effective strain
Flow stress Axial residual stress
23 pass, 5o 23 pass, 6o 23 pass, 7o 23 pass, 8o
Fig. 9 Flow stress and the predicted residual stress
Table 2 Conditions for wire drawing experiment
Conditions Value
Wire material AISI 1080
Initial wire diameter (mm) 2.0 Final wire diameter (mm) 1.7
Bearing length of die (mm) 0.3 × initial wire diameter
Semi-die angle (o) 5.0
Drawing speed (mm/s) 5.0
Flow stress of initial wire (MPa) 3007.80.317
Yield strain 0.0046
Young’s modulus (GPa) 210.0
Poisson’s ratio (ν) 0.3
Fig.10 Drawing machine
n 2
n axial
100 K
84 100 72 44 63 2
K f
. .
. ) (
(3)
여기서, K 는 강도계수(strength coefficient), n 은 가 공 경화지수(strain-hardening exponent)이다.
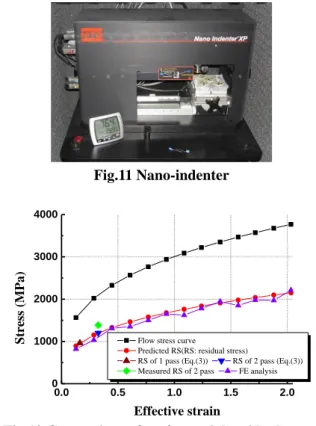
Fig.11 Nano-indenter
0.0 0.5 1.0 1.5 2.0
0 1000 2000 3000 4000
Stress (MPa)
Effective strain
Flow stress curve
Predicted RS(RS: residual stress)
RS of 1 pass (Eq.(3)) RS of 2 pass (Eq.(3)) Measured RS of 2 pass FE analysis
Fig.12 Comparison of surface axial residual stress
Fig. 9 는 유동응력과 식(3)으로 계산된 표면 축방 향 잔류응력을 나타낸 것이다. Fig. 6 과 매우 유사한 값을 나타내고 있음을 알 수 있다.
제안된 예측모델에 대하여 기존 연구결과와 비교 하여 그 타당성을 평가하였다[13]. 신선 실험에 적용 된 와이어 소재는 AISI 1080 이며, 초기소재 직경은 2.0mm 이다. 2 패스 신선 후 최종 1.7mm 와이어의 표면 잔류응력을 평가하였다. 실험조건은 Table 2 에 나타내었으며, 신선 실험은 Fig. 10 의 실험용 인발기 로 수행되었다.
신선실험 후 2 번째 패스를 통과한 와이어에 대하 여 표면부 잔류응력을 평가하였다. 잔류응력은 Fig.
11 의 나노인덴터(nano-indenter)를 이용하여 Lee 등이 제안한 나노인덴터이션 테스트(nano-indentation test) 를 통해 측정되었다[16].
Fig. 12에 잔류응력 평가결과를 나타내었다. 식(3)의 예측식을 적용한 경우 2번째 패스 와이어 잔류응력은 1199.4MPa 이었다. 그리고 나노인데터를 이용해 측정 한 2번째 패스 와이어의 표면 잔류응력은 1383.8MPa 이었다[13]. 예측결과와 측정결과는 약 184MPa의 차이 가 발생하고 있다. 측정결과 기준으로 약 13.3%의 오 차가 발생하였으나 예측결과가 타당함을 알 수 있다.
5. 결 론
본 연구에서는 탄소성 유한요소해석을 이용해 탄 소강 다단 신선공정 시 와이어 표면에 발생하는 축 방향 잔류응력을 평가하였으며, 다음의 결론을 도출 하였다.
(1) 탄소성유한요소해석을 통해 AISI1072 다단 신 선공정 시 다이 반각와 감면율이 표면부 축방향 잔 류응력에 미치는 영향을 평가하였다. 해석결과 잔류 응력은 소재의 유동응력 곡선과 유사한 형태를 나 타내었다. 또한, 다이 반각과 감면율 변화에 따른 잔류응력의 크기는 유동응력과 일정한 비율을 나타 냄을 알 수 있었다.
(2) 탄-소성 유한요소해석 결과를 토대로 소재 유 동응력, 다이 반각, 그리고 감면율로 표현되는 표면 잔류응력 예측 모델을 제안하였다.
(3) 제안된 모델을 이용하여 AISI1080 와이어에 대 한 2패스 신선 실험 후 잔류응력을 평가한 결과, 예 측결과와 측정결과는 각각 1199.4MPa과 1383.8MPa로 서로 유사한 결과를 나타내었다.
REFERENCES
[1] C. S. Kim, K. S. Hong, M. K. Kim, 2005, Nonlinear Robust Control of a Hydraulic Elevator, Control Eng.
Pract., Vol. 13, No. 6, pp. 789~803.
[2] R. S. Chandel, S. R. Bala, 1986, Effect of Welding Parameters and Groove Angle on the Soundness of Root Beads Deposited by the SAW Process, Proc. Of Trends in Welding Research, Gatlinburg, Tennessee, USA, pp. 479~485.
[3] S. Kalpakjian, S. R. Schmid, 1992, Manufacturing Processes for Engineering Materials, Second Ed.
Addison-Wesley Publishing Company, New York, USA.
[4] C. F. Yu, Z. L. Xue, W. T. Jin, 2016, Precipitation and Solid Solution of Titanium Carbonitride Inclusions in Hypereutectoid Tire Cord Steel, J. Iron, Steel Res. Int.
Vol. 23, No. 4, pp. 338~343.
[5] S. K. Lee, B. M. Kim, 2005, Analysis of Multi-pass Wet Drawing Process and Its Application, Trans.
Mater. Process., Vol. 14, No. 8, pp. 689~695.
[6] J. Toribio, M. Lorenzo, D. Vergara, 2016, Hydrogen Embrittlement Susceptibility of Prestressing Steel
Wires: the Role of the Cold-drawing Conditions, Procedia Struct. Integrity, Vol. 2, pp. 626~631.
[7] S. K. Lee, D. W. Kim, M. S. Jeong, B. M. Kim, 2012, Evaluation of Axial Surface Residual Stress in 0.82wt% Carbon Steel Wire During Multi-pass Drawing Process Considering Heat Generation, Mater.
Des., Vol. 34, pp. 363~371.
[8] J. J. Atienza, M. L. Martinez-Perez, J. Ruiz-Hervias, F.
Mompean, M. Garcia-Hernandez, M. Elices, 2005, Residual Stress in Cold Drawn Ferritic Rods, Scr.
Mater., Vol. 52, No. 4, pp. 305~309.
[9] H. Ö verstam, 2006, The Influence of Bearing Geometry on the Residual Stress State in Cold Drawn Wire, Analysed by the FEM, J. Mater. Process.
Technol., Vol. 171, No. 3, pp. 446~450.
[10] T. Kuboki, M. Akiyama, Y. Neishi, K. Kuroda, 2000, Effect of Final Drawing with Light Reduction on the Leveling of Residual Stress Distribution in Cold Bar Drawing, Proc. Inst. Mech. Eng. Prat C, Vol. 214, No.
11, pp. 1389~1399.
[11] T. Kuboki, I. Kawakami, M. Neishi, K. Kuroda, M.
Akiyama, 2001, A Study on the Influence of Mechanical Properties on the Distribution of Axial Residual Stress after Cold Drawing of Metallic Bars, Mater. Sci. Res. Int., Vol. 7, No. 1, pp. 41~46.
[12] T. Kuboki T, M. Akiyama M, Y. Neishi, K. Kuroda, 2001, Effect of Die Geometry on Residual Stress Level Present after Bar Drawing, Ironmaking Steelmakaking, Vol. 28, No. 1, pp. 65~71.
[13] D. C. Ko, S. K. Lee, W. H. Hwang, B. M. Kim, C. M.
Bae, 2007, The Evaluation of Residual Stress on the Drawn Wire using Nano-indentation Test, J. Mater.
Process. Technol., Vol. 191, No. 1, pp. 64~67.
[14] J. Toribio, M. Lorenzo, D. Vergara, L. Aguado, 2016, Residual Stress Redistribution Induced by Fatigue in Cold-drawn Prestressing Steel Wires, Constr. Build.
Mater., Vol. 114, pp. 317~322.
[15] M. Akiyama, T. Kuboki, 2002, Optimisation of Method for Residual Stresses after Cold Bar Drawing, Ironmaking Steelmaking, Vol. 29, No. 2, pp. 101~106.
[16] Y. H. Lee, D. I. Kwon, 2003, Measurement of Residual Stress Effect by Nanoindenatation on Elastically Strained (100) W, Scr. Mater., Vol. 49, No. 5, pp. 459~465.