Regular Paper 530 J. KIEEME
Vol. 23, No. 7, pp. 530-533, July 2010 DOI: 10.4313/JKEM.2010.23.7.530
Dynamic Transient Phenomena of a Proton Exchange Membrane Fuel Cell
Ying Lee
1, Yong-Sung Choi
1,a, You-Sai Zhang
2, and Kyung-Sup Lee
11 Department of Electrical Engineering, Dongshin University, Naju 520-714, Korea
2 School of Electronic and Information, Jiangsu University of Science and Technology, 2 Mengxi Road, Zhenjiang, 212003, P. R. of China
(Received May 6, 2010; Accepted June 7, 2010)
Abstract: The proton exchange membrane fuel cell (PEMFC) holds great promise of clean power.
However, in practical applications which use the PEMFC as the power source, the output voltage from the fuel cell undergoes a transient response especially during acceleration and deceleration. This paper presents the relationships between the charge curves of the internal voltage rise, discharge curves of the internal voltage drop, the voltage with a time constant Vτ and finally, the load and time constant τ of FC1 and FC2, connected both in series and in parallel.
Keywords: Exchange membrane fuel cell, Internal voltage, Time constant, Transient phenomena
1. INTRODUCTION1)
Fuel cells are one of the key enabling technologies for future hydrogen economy. For the last 20 years, applications of the fuel cells are mostly replacing internal combustions engines, and providing power in stationary and portable power applications. The number of different applications of fuel cell is very extensive and there is an increasing interest in fuel cell technology and fuel cell will reach a high development status [1].
Although different types of fuel cells have been developed, PEMFC (proton exchange membrane fuel cell) is well suited for many applications including automobiles, buildings, and for smaller applications.
PEMFC has gained international attention as candidates for alternative automotive and stationary power sources due to features such as their highest power density of all the fuel cell classes, good start-stop capabilities, adaptable size and low operating temperatures [2,3].
a. Corresponding author; [email protected]
Nowadays, alone with the improving battery performance of PEMFC and market demand, the primary research objective is how to study characteristics of the PEMFC system well and control it effectively. To improve the operation of PEMFC performance, protect system security, reliability and low cost operation, the establishment of cell PEMFC model is necessary. And if the PEMFCs supply power to certain applications such as vehicles which the power requirement varies rapidly, the transient response of PEMFC is critical [4].
2. EXPERIMENTS 2.1 Theory
Fuel cell is different from the normal power supply, and it is a nonlinear, multi-input, strong coupling, the complex dynamic system with large time delay [5]. At present, many studies on the
전기전자재료학회논문지, 제23권 제7호 pp. 530-533, 2010년 7월: Y. Lee 등 531
content of the fuel cell fuel cells focus on a static process [6], this paper analyzed in subsequent sections of the process of fuel cell dynamic response time of transition, so first of all, battery equivalent circuit becomes extremely important. And the equivalent circuit can be used to analyze the PEMFC startup and shutdown process, the work cycle of various factors and the adaptability of the load, thus reducing the load changes the response time to ensure that the battery, the maximum net output power and output power stability [7].
Because the internal construction of PEMFC behaves much like an electrical capacitor, if the current changes, it will take certain period for this charge to build up or dissipate. Therefore, the activation voltage does not immediately follow the current like the general ohm I-V characteristics, but moves fairly slowly to its final equilibrium value.
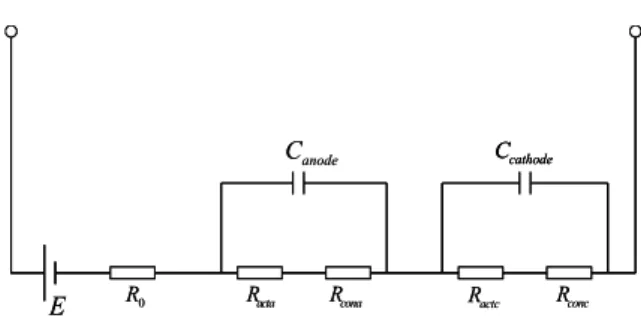
One way of modeling this is to introduce an equivalent circuit shown in Fig. 1, with the charge double electrical capacitors. Canode and Ccathode are the equivalent capacitors of fuel cell anode and cathode. Ra and Rc are the equivalent resistors of fuel cell anode and cathode.
If,
a acta cona
R = R + R
(1)c actc conc
R = R + R
(2)it can get that,
0
1 1
( ) 1
a1
ca c
Z w R
wc wc
R j R j
= + +
− −
(3)
Equation (4) is deduced from equation (3),
2 2
0 2 2 2 2
( ) [ ]
1 ( ) 1 ( ) 1 ( ) 1 ( )
a c a a c c
a a c c a a c c
R R wc R wc R
Z w R j
wc R wc R wc R wc R
= + + − +
+ + + + (4)
According to the content about the PEMFC equivalent circuit, it can get that the PEMFC has
Rcona Rconc R0
E
anode
C
Racta Ractc
cathode
C
Rcona Rconc R0
E
anode
C
Racta Ractc
cathode
Ccathode C
Fig. 1. Equivalent circuit of PEMFC.
equivalent energy storage device capacitor. So when the circuit structure or component parameters change, it must be accompanied by change of capacitance energy field. Since the energy changes gradually, rather than episodic change (that is, change from one value to another value instantaneously).
So generally, the capacitor voltage can not have abrupt change. It changes from initial value to a new steady-state value exponentially. Therefore, fuel cell equivalent circuit containing energy storage devices capacitor is a dynamic circuit which has transient phenomena process.
The fuel cell transient phenomena include charge and discharge two processes, respectively. When the charge and discharge complete, the circuit is in steady-state, charge and discharge process speed are proportional to circuit time constant τ. The calculation of τ has important theoretical and practical significance to the start and brake management of devices which installed the fuel cells as the power supply.
2.2 EXPERIMENT
Experiment apparatus are shown in Fig. 2, solar cell is placed under constant light intensity (100 W halogen light), and supply electricity to electrolyzer.
Then the electrolyzer electrolyzes the distilled water to produce hydrogen and oxygen. And the hydrogen and oxygen flow into the fuel cell through the plastic tubes to generate electricity.
Connect the fuel cell with digital storage-type
532 J. KIEEME, Vol. 23, No. 7, pp. 530-533, July 2010: Y. Lee et al.
Fig. 2. Hybrid solar-fuel cell power generation system.
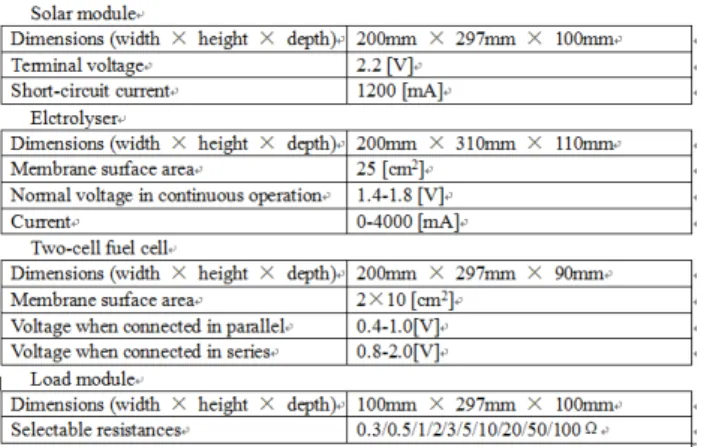
Table 1. Technical data.
oscilloscope (Model GW INSTEK GDS-1022), then measure and calculate the time constant τ when the external load resistance changes during the processes of fuel cell charge and discharge transient phenomena. Electrolyzor, PEMFC, load and other technical parameter are shown in Table 1.
3. RESULTS AND DISCUSSION
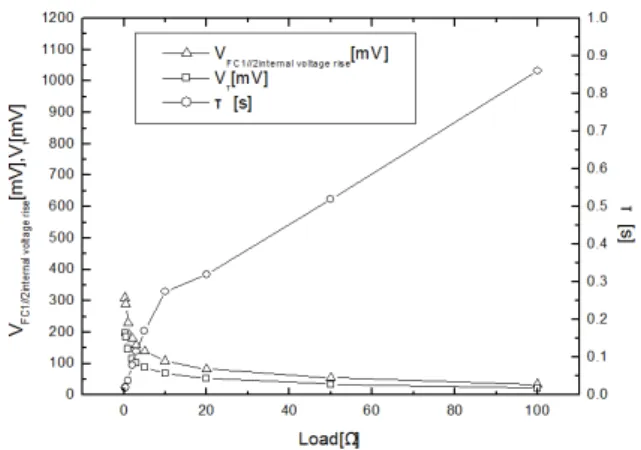
Figure 3 and Fig. 4 present the relationships between the charge curve of internal voltage rise,
Fig. 3. Charge curves of internal voltage rise, voltage of time constant Vτ, load and time constant τ of FC1 and FC2 in series.
discharge curve of internal voltage drop, voltage of time constant Vτ, load and time constant τ of FC1
and FC2 inseries. And Fig. 5 and Fig. 6 present the relationships between the charge curve of internal voltage rise, discharge curve of internal voltage drop, voltage of time constant Vτ, load and time constant τ of FC1 and FC2 in parallel. It can be summarized as the following points.
Firstly, during the processes of charge transient response and discharge transient response, same stack and same group fuel cells have almost same internal voltage rise, internal voltage drop and time constant.
Secondly, the internal voltage characteristics are affected by fuel cell internal action temperature, anode and cathode humidity and accumulated liquid water in diffusion layer. So even the same fuel cell has working conditions, the internal voltage characteristics are different.
Thirdly, when the two fuel cells are connected in series, the values of the internal voltage rise and drop are large, but the time constants are short.
The reason is the capacitance in series is less than the single fuel cell’s. However, when the two fuel cells are connected in parallel, the values of the internal voltage rise and drop are little, but the time constants are long. The reason is the capacitance in parallel is more than the single fuel cell’s.
전기전자재료학회논문지, 제23권 제7호 pp. 530-533, 2010년 7월: Y. Lee 등 533
Fig. 4. Discharge curves of internal voltage drop, voltage of time constant Vτ, load and time constant τ of FC1 and FC2 in series.
Fig. 5. Charge curves of internal voltage rise, voltage of time constant Vτ, load and time constant τ of FC1 and FC2 in parallel.
4. CONCLUSIONS
This paper presented the dynamic transient phenomena of proton exchange membrane fuel cell.
From the above listed internal voltage rise, internal voltage drop and time constant curves fuel cells in series and in parallel, it can be summarized that during the processes of charge transient response and discharge transient response, same stack and same group fuel cells had almost same internal voltage
Fig. 6. Discharge curves of internal voltage drop, voltage of time constant Vτ, load and time constant τ of FC1 and FC2 in parallel.
rise, internal voltage drop and time constant. When the two fuel cells are connected in series, the values of the internal voltage rise and drop are large, but the time constants are short. The reason is the capacitance in series is less than the single fuel cell’s. However, when the two fuel cells are connected in parallel, the values of the internal voltage rise and drop are little, but the time constants are long. The reason is the capacitance in parallel is more than the single fuel cell’s.
REFERENCES
[1] J. M. Andújar and F. Segura, Renew. and Sustain.
Energy Reviews, 13, 2309 (2009).
[2] R. O’Hayre, S.-W. Cha, W. Colella, and F. B. Prinz, Fuel Cell Fundamentals (John Wiley & Sons, New York, 2008) p. 261.
[3] R. Hoefnagels, E. Smeets, and A. Faaij, Renew. and Sustain. Energy Reviews 14, 1661 (2010).
[4] T. Mennola, M. Mikkola, M. Noponen, T. Hottinen, and P. Lund, J. Power Sources 112, 261 (2002).
[5] J.-B Jia, M. Han, and J. Xiao, J. Computer Simulation 24, 227 (2007).
[6] J. H. Cho, H.-S. Kim, and K. D. Min, J. Power Sources 185, 118 (2008).
[7] W.-R. Chen, J. Academic News 2, 12 (2009).