ASSESSING HAZARD VULNERABILITY USING ENVIRONMENTAL INFORMATION
Soojeong Myeong
*†ㆍHyun Jung Hong
*ㆍHyunil Choi
***
Korea Environment Institute, Seoul, Koreaㆍ
**Youngnam University, Daegoo, Korea
†
[email protected]
ABSTRACT: This study applied comprehensive procedures for assessing hazard vulnerability. Flood hazard, among many natural hazards, was examined with a study site in Sariwon and its vicinity. Considered factors in this study are topography, meteorology, hydrology, land use, soil, hazard history, and society. The factors were divided into sub- factors and weight was applied for each factor when assessing vulnerability. The results were then generated into a five level vulnerability map. The final vulnerability map showed roughly 48% of the study area was vulnerable to hazards.
The most vulnerable areas were low elevation areas near rivers and where population density is very high. The results can be used to assist with developing a hazard prevention strategy.
KEY WORDS: Hazards, Vulnerability assessment, Environmental information
1.
INTRODUCTION
Globally, the scale and frequency of natural hazards have increased. In 2001, the Intergovernmental Panel on Climate Change (IPPC) anticipated the possibility of more frequent and severe extreme weather events such as floods, hurricanes, and drought due to climate change.
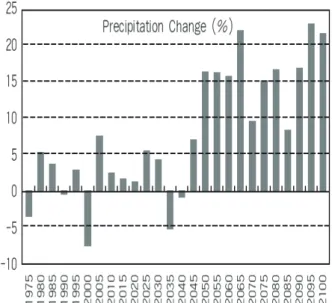
Figure 1 shows the increased possibility of precipitation based on the IPCC scenario.
Figure 1. Precipitation change based on IPCC A1B scenario (Kwon, 2008)
Negative effects such as settlement and crop area loss due to Natural hazards can be drastically high if we do not prepare for them. To develop appropriate hazard prevention strategies, vulnerability assessments using spatial environmental information should be implemented at the beginning because the spatial information from
hazard vulnerability map can provide useful information for developing hazard prevention strategies. Finding areas where priority aid should be provided can be one of its great usages. This study developed comprehensive procedures for assessing hazard vulnerability and applied them at the study site. The hazard vulnerability maps developed in this study can provide very useful information when developing a proper and efficient strategy plan against natural hazards.
2.
METHODOLIGY Study Area
The area examined in this study was Sariwon, and its vicinity,. To include the impact of the watershed to hazards, areas surrounding Sariwon were included. This area was chosen because it encompasses diverse land use types such as crop land, grass land, forest, barren areas, and urban areas.
Factors for Estimating Natural Hazard Vulnerability Natural hazards occur by way of complicated interactions among many factors. The factors are topology, meteorology, hydrology, land use, etc. This study used a hierarchical approach in assessing hazard vulnerability. In other words, a two level approach was applied. The first level covered low level factors and the second level covered high level factors (Table 1). The high level factors considered in this study are topography, meteorology, hydrology, land use, soil, hazard history, and society. Each high level factor included the following sub-factors: elevation and slope for topography; 100 year precipitation frequency and precipitation intensity for meteorology; flood discharge and stream order for hydrology; land cover and riparian buffer for land use;
soil permeability and soil loss for soil; population for
society; and property damage and return period for
hazard history.
High Level Factors Low Level Factors
Topography Elevation
Slope Meteorology 100 Year Precipitation
Frequency Precipitation Intensity Hydrology Flood Discharge
Stream Order
Land use Land cover
Riparian Buffer Soil Soil Permeability
Soil Loss
Society Population Hazard History Property Damage
Return Period Figure 1. Factor for Assessing Hazard Vulnerability
It would provide better results if more factors were covered; however, acquiring information related to natural hazards has been very difficult for the study area.
Therefore, some factors like disaster prevention systems and field measurements could not be included in this study.
Evaluation of Natural Hazard Vulnerability Factors This study applied weight in assessing hazard vulnerability procedure because each factor has a different effect on the hazard. Weights were determined based on the surveying results of professionals in the natural hazard field. The AHP method was applied when calculating weight. Since each factor has a different unit and data range, each of them was standardized to make the handling of data easier. This study classified each factor into five levels of vulnerability based on their value range; very low, low, medium, high, and very high. After this, all low-level factors within the same high level factor were overlaid. Then, high level factors were classified further into five levels. After this step, all high level factors were overlaid again. Finally, the overall vulnerability was assessed and a hazard vulnerability map was generated. Weight was applied for each factor at each step.
3.
RESULTS AND DISCUSSIONS
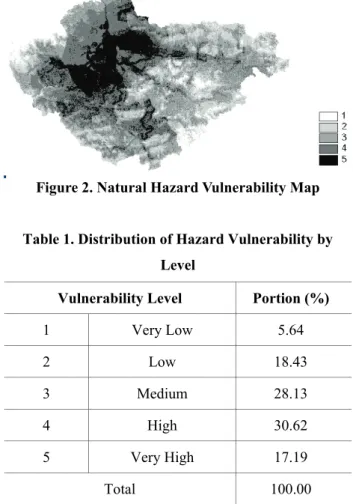
The results of the hazard vulnerability assessment showed five levels of vulnerability: very low, low, medium, high, and very high (Figure 2). The vulnerable areas (high and very high levels) totaled about 48% of the study area. Portions of each vulnerability category of the study site are in Table 2. The results show that areas with low elevation and near the river, and areas with high population density, are the most vulnerable to flood hazard.
Figure 2. Natural Hazard Vulnerability Map
Table 1. Distribution of Hazard Vulnerability by Level
Vulnerability Level Portion (%)
1 Very Low 5.64
2 Low 18.43 3 Medium 28.13 4 High 30.62
5 Very High 17.19
Total 100.00
The results indicate that land use plans should be carefully made along riparian areas with low elevation and areas with high population density.
4.