ABSTRACT
Background and Objectives: The correlations between plaque characteristics and plaque rupture location according to segmental lesion analysis have not been well defined. The aim of this study was to assess those characteristics of ST-segment elevation myocardial infarction (STEMI) culprit lesions according to segmental lesion geometry using virtual histology intravascular ultrasound (VH-IVUS).
Methods: Sixty single discrete lesions found in the left anterior descending (LAD) coronary arteries of 60 patients with STEMI were included. Each lesion was divided into 3 segments based on lumen area (LA) index, calculated by dividing the lesion LA by the reference LA.
Results: Among the 3 segments, the mid-segment showed the highest proportion of necrotic core (NC; proximal, mid-, and distal segments: 20.9±11.8%, 22.7±11.3%, and 17.5±11.2%, respectively, p=0.044). VH-IVUS-derived thin-cap fibroatheroma (VH-TCFA) was also more frequently found in the mid-segment than in proximal and distal segments (36.7%, 58.3%, and 16.7%, p<0.001). The mid-segment also showed the highest prevalence of plaque rupture (45.0%, 78.3% and 11.7%, p<0.001) and thrombus (61.7%, 95.0%, and 41.7%, p<0.001) compared to proximal or distal segments. When the lesions were divided into 2 groups according to the median value (4.0 mm2) of minimum lumen area (MLA), plaque rupture at the distal segment was observed only in high MLA lesions (23.3% vs. 0.0%, p=0.011).
Conclusion: Analysis of longitudinal lesion geometry using the LA index can be useful in evaluating plaque vulnerability and the incidence of plaque rupture and thrombus in STEMI patients.
Keywords: ST elevation myocardial infarction; Plaque, atherosclerotic; Diagnostic imaging;
Coronary artery disease
Original Article
Ju-Hyun Chung ,PhD1, Joo Myung Lee , MD, MPH, PhD2,
Ae-Young Her , MD, PhD3, Heeyoun Cho , MD1, Joon-Hyung Doh , MD, PhD4, Chang-Wook Nam , MD, PhD5, Hyung Il Kim , MD, PhD6,
Bon-Kwon Koo , MD, PhD7,8, and Eun-Seok Shin , MD, PhD1
1Department of Cardiology, Ulsan University Hospital, University of Ulsan College of Medicine, Ulsan, Korea
2 Department of Internal Medicine and Cardiovascular Center, Samsung Medical Center, Sungkyunkwan University School of Medicine, Seoul, Korea
3Department of Cardiology, Kangwon National University School of Medicine, Chuncheon, Korea
4Department of Cardiology, Inje University Ilsan Paik Hospital, Goyang, Korea
5Department of Internal Medicine, Keimyung University Dongsan Medical Center, Daegu, Korea
6Suntech Research Center, Seoul, Korea
7Department of Internal Medicine and Cardiovascular Center, Seoul National University Hospital, Seoul, Korea
8Institute of Aging, Seoul National University, Seoul, Korea
Plaque Characteristics and Ruptured Plaque Location according to Lesion Geometry in Culprit Lesions of
ST-Segment Elevation Myocardial Infarction
Received: May 23, 2017 Revised: Aug 14, 2017 Accepted: Sep 4, 2017 Correspondence to Eun-Seok Shin, MD, PhD
Department of Cardiology, Ulsan University Hospital, University of Ulsan College of Medicine, 877, Bangeojinsunhwando-ro, Dong-gu, Ulsan 44033, Korea.
E-mail: [email protected] Copyright © 2017. The Korean Society of Cardiology
This is an Open Access article distributed under the terms of the Creative Commons Attribution Non-Commercial License (https://
creativecommons.org/licenses/by-nc/4.0) which permits unrestricted noncommercial use, distribution, and reproduction in any medium, provided the original work is properly cited.
ORCID iDs Ju-Hyun Chung
https://orcid.org/0000-0003-1435-7265 Joo Myung Lee
https://orcid.org/0000-0002-2178-4014 Ae-Young Her
https://orcid.org/0000-0002-9990-6843 Heeyoun Cho
https://orcid.org/0000-0002-6125-9548 Joon-Hyung Doh
https://orcid.org/0000-0001-7966-9564 Chang-Wook Nam
https://orcid.org/0000-0002-3370-5774 Hyung Il Kim
https://orcid.org/0000-0002-2622-8447
Bon-Kwon Koo
https://orcid.org/0000-0002-8188-3348 Eun-Seok Shin
https://orcid.org/0000-0002-9412-1692 Conflict of Interest
The authors have no financial conflicts of interest.
Author Contributions
Conceptualization: Shin ES, Koo BK; Data curation: Chung JH; Formal analysis: Shin ES, Chung JH; Funding acquisition: Shin ES;
Investigation: Chung JH, Lee JM, Her AY, Cho HY, Doh JH, Nam CW, Kim HI, Koo BK, Shin ES; Methodology: Shin ES, Koo BK; Project administration: Shin ES; Resources: Chung JH, Lee JM, Her AY, Cho HY, Doh JH, Nam CW, Kim HI, Koo BK, Shin ES; Software: Lee JM, Her AY, Cho HY, Doh JH, Nam CW; Supervision:
Shin ES, Koo BK; Validation: Shin ES, Koo BK, Chung JH; Visualization: Chung JH; Writing - original draft: Chung JH; Writing - review &
editing: Shin ES, Koo BK.
INTRODUCTION
Culprit lesions causing ST-segment elevation myocardial infarction (STEMI) have greater plaque burden (PB), more thin-cap fibroatheroma (TCFA), and higher incidence of plaque rupture compared to other coronary artery diseases.1) Although comparisons of plaque characteristics in different clinical situations have been well evaluated,2-5) plaque characteristics and the location of plaque rupture in STEMI culprit lesions according to segmental lesion geometry remain uncertain. Previous studies showed the association of the distribution and magnitude of wall shear stress (WSS) with transformation of plaque composition into more vulnerable phenotypes, such as increasing necrotic core (NC) and regression of fibrous tissue (FT) and fibrofatty tissue (FF).6) Recently, we explored the mechanistic link between hemodynamic forces and plaque-related clinical events in subdivided segment analysis using a coronary computed tomography (CT) angiography- based computational fluid dynamics (CFD) model.7)8) Although previous studies have demonstrated that segmental distribution of hemodynamic forces including WSS can affect the segmental composition of plaque and plaque rupture location, this has never been validated using invasive intravascular imaging. Therefore, the objective of this study was to assess plaque characteristics and ruptured plaque locations of STEMI culprit lesions according to longitudinal segmental lesion geometry using virtual histology intravascular ultrasound (VH-IVUS).
METHODS
Study population
From November 2008 to December 2013, 384 consecutive patients diagnosed with STEMI according to the AHA guidelines were screened.9) Out of these patients, 280 underwent VH- IVUS imaging for culprit lesions before percutaneous coronary intervention (PCI). Among these, 60 patients with a single discrete culprit lesion in left anterior descending (LAD) with available morphological and compositional lesion images were included in this study.
Hemodynamically unstable patients or those with end-stage renal disease were excluded.
Culprit lesions in the left main artery or ostium, heavily calcified lesions, or thrombolysis in myocardial infarction (TIMI) 0–1 flow lesions after thrombus aspiration were excluded. This study was approved by the Institutional Review Board of Ulsan University Hospital and was conducted in accordance with the Declaration of Helsinki. All patients gave written informed consent for all procedures.
Quantitative coronary angiography (QCA) analysis
Two-dimensional QCA was performed using a dedicated software package (CAAS 5.9, Pie Medical Imaging, Maastricht, Netherlands) at a core laboratory (Ulsan University Hospital).
Reference vessel diameter (RVD), minimum lumen diameter (MLD), diameter stenosis (DS), and lesion length (LL) were measured by experienced, independent investigators who were blinded to the VH-IVUS findings and clinical information.
Acquisition of IVUS images and VH-IVUS
IVUS images were recorded using a 2.9F Eagle Eye catheter (Volcano Corp., Rancho Cordova, CA, USA) and incorporated into a 20-MHz phased-array transducer. The catheter was retracted at 0.5 mm/sec with an automated pullback system. All measurements were performed after administration of 200 µg intracoronary nitroglycerin. Geometric,
quantitative grayscale IVUS analyses were performed according to criteria from the IVUS clinical expert consensus document.10) VH-IVUS images were analyzed using pcVH 2.2 software (Volcano Therapeutics, Rancho Cordova, CA, USA) by independent investigators who were blinded to the clinical characteristics of participants. PB was calculated by dividing (plaque+media) volume by total vessel volume. For plaque area (PA), vessel area (VA), and lumen area (LA), the pcVH software program provided the volumetric data of the lesion, and we divided each volume with the corresponding LL to obtain the mean area of each value. The VH-IVUS analyses provided four plaque tissue compositions (FT, FF, NC, and dense calcium [DC]) in both mean area and relative volume of each component.
Definition of lesion
Lesions were classified into pathological intimal thickening (PIT; intimal thickening ≥600 µm for >20% of the circumference with >15% FF, and no confluent NC or DC), fibrotic plaque (FI; consisting of FT without confluent NC or DC), fibrocalcific plaque (FC; DC >10% without confluent NC), thick-cap fibroatheroma (ThFA; NC >10% on 3 consecutive frames with a definable fibrous cap), and TCFA (NC >10% on 3 consecutive frames and NC in contact with the lumen as seen on the established standard by VH-IVUS).11)
Segmental analysis
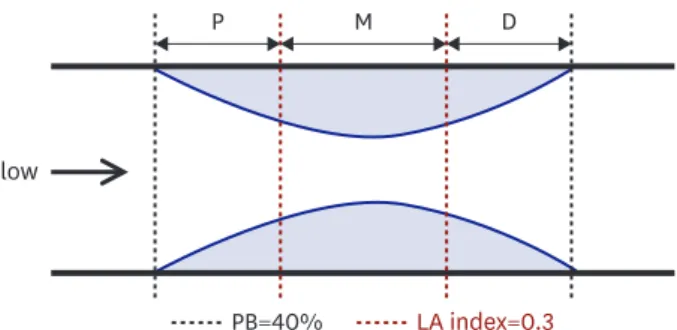
For purposes of this study, lesions were selected when PB was above 40%. Each lesion was divided into 3 segments as shown in Figure 1. The black dotted lines correspond to a PB of 40%, and the red dotted lines correspond to an LA index of 0.3. The LA index was calculated by dividing the lesion LA by the reference LA, which is the mean value of proximal and distal LA.
An LA index of 0.3 was a criterion used to identify the mid-segment. Using these criteria, the culprit lesions were divided into proximal, mid-, and distal segments, and plaque composition, presence of ruptured plaque, and thrombus were compared among these segments.
Statistical analysis
Continuous variables are presented as mean±standard deviation, and categorical variables are expressed as frequency and percentage. Analysis of discrete variables was performed using χ2 or Fisher's exact test. The comparison of continuous variables among 3 segments was performed with one-way analysis of variance (ANOVA) test or Kruskal-Wallis H test, according to normality of the variable, which was assessed using the Shapiro-Wilk test.
Differences between the groups in post hoc testing were analyzed using the Bonferroni correction for parametric analysis or Dunn's nonparametric comparison. Correlations between the quantitative variables were analyzed using Pearson correlation analysis. A p value
P M D
Flow
LA index=0.3 PB=40%
Figure 1. Definitions of 3 segments by LA index. The black dotted lines correspond to a PB of 40%, and the red dotted lines correspond to a LA index of 0.3. The LA index is calculated by dividing the lesion LA by the reference LA. The reference LA is a mean value of proximal LA and distal LA. The LA index of 0.3 was a criterion to identify the mid-segment.
D = distal segment; LA = lumen area; M = mid-segment; P = proximal segment; PB = plaque burden.
<0.05 was considered statistically significant. All statistical analyses were performed using SPSS® version 21.0 (SPSS Inc., Chicago, IL, USA).
RESULTS
Patient characteristics and IVUS findings
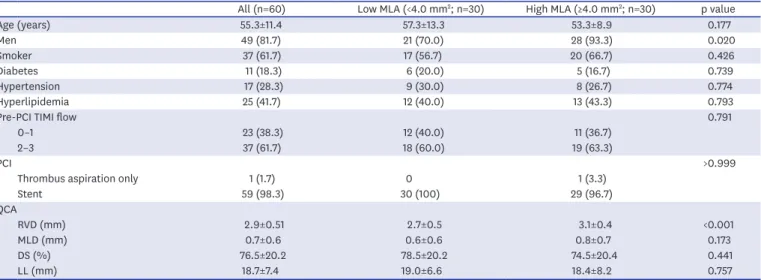
Baseline characteristics of the 60 patients included in this study (mean age 55.3±11.4 years, 81.7% men) and their QCA findings according to minimum lumen area (MLA) are shown in Table 1. Study results revealed that 61.7% of patients were current smokers, and 18.3%
had diabetes mellitus. One patient received thrombus aspiration only, and 98.3% received stent implantation. The mean PB derived for the whole lesion from proximal to distal was 60.5±5.4%, and the median MLA was 4.0 mm2 (IQR, 3.86 to 4.64). The high MLA group had more men and larger RVD than the low MLA group.
Segmental assessment of grey-scale IVUS and VH-IVUS characteristics
Comparison of IVUS parameters among the 3 segments of culprit lesions is presented in Table 2.
In gray-scale IVUS analysis, PA and PB in the mid-segment were significantly higher than in the proximal or distal segment. When the relative contents of the 4 plaque compositions were compared among the 3 segments, the percentage of NC was significantly higher in the mid-segment than in the proximal or distal segment (20.9±11.8%, 22.7±11.3%, and 17.5±11.2%
for proximal, mid-, and distal, respectively, p=0.044). The percentage of FF content was also found to be different among the 3 segments (p=0.028) and significantly higher in the distal segment compared to the proximal one (13.1±8.9% vs. 9.8±7.0%, p=0.049). However, NC and DC contents were lowest in the distal segment. Regarding plaque phenotype, the prevalence of VH-IVUS-derived thin-cap fibroatheroma (VH-TCFA) (58.3%) was highest in the mid- segment, but the prevalence of VH-IVUS-derived thick-cap fibroatheroma (VH-ThFA) (31.7%) was relatively lower in the mid-segment than the others. Conversely, there was more VH-ThFA compared to VH-TCFA at the proximal segment (50.0% vs. 36.7%) and distal segment (60.0%
vs. 16.7%). When plaque features such as ruptured plaque and thrombus were compared, they
Table 1. Clinical and angiographic characteristics according to MLA
All (n=60) Low MLA (<4.0 mm2; n=30) High MLA (≥4.0 mm2; n=30) p value
Age (years) 55.3±11.4 57.3±13.3 53.3±8.9 0.177
Men 49 (81.7) 21 (70.0) 28 (93.3) 0.020
Smoker 37 (61.7) 17 (56.7) 20 (66.7) 0.426
Diabetes 11 (18.3) 6 (20.0) 5 (16.7) 0.739
Hypertension 17 (28.3) 9 (30.0) 8 (26.7) 0.774
Hyperlipidemia 25 (41.7) 12 (40.0) 13 (43.3) 0.793
Pre-PCI TIMI flow 0.791
0–1 23 (38.3) 12 (40.0) 11 (36.7)
2–3 37 (61.7) 18 (60.0) 19 (63.3)
PCI >0.999
Thrombus aspiration only 1 (1.7) 0 1 (3.3)
Stent 59 (98.3) 30 (100) 29 (96.7)
QCA
RVD (mm) 2.9±0.51 2.7±0.5 3.1±0.4 <0.001
MLD (mm) 0.7±0.6 0.6±0.6 0.8±0.7 0.173
DS (%) 76.5±20.2 78.5±20.2 74.5±20.4 0.441
LL (mm) 18.7±7.4 19.0±6.6 18.4±8.2 0.757
Values are number (%) or mean±standard deviation.
DS = diameter stenosis; LL = lesion length; MLA = minimum lumen area; MLD = minimum lumen diameter; PCI = percutaneous coronary intervention; QCA = quantitative coronary angiography; RVD = reference vessel diameter; TIMI = thrombolysis in myocardial infarction.
both showed significant differences among segments. At the mid-segment, ruptured plaques were found in 78.3% of cases, and thrombi were found in 95.0%. The percentages of VH-TCFA, plaque rupture, and thrombus showed the highest values at the mid-segment, followed by proximal segments and distal segments.
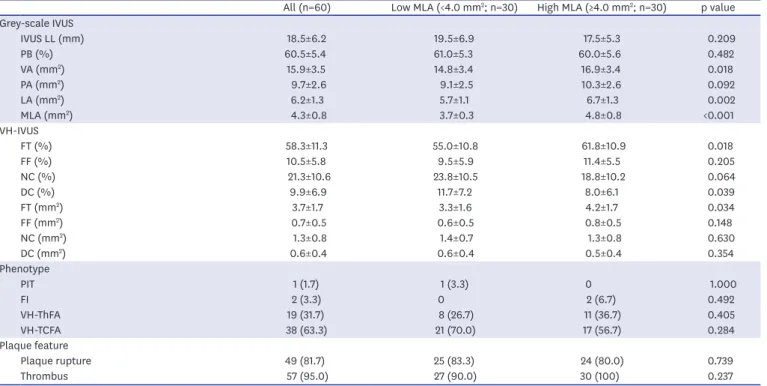
Grey-scale IVUS and VH-IVUS characteristics according to MLA
A further analysis between low and high MLA groups for grey-scale IVUS and VH-IVUS characteristics is shown in Table 3. When considering all 60 lesions, the percentage of FT was highest among the 4 plaque compositions, followed by NC, FF, and DC (58.3±11.3%, 21.3±10.6%, 10.5±5.8%, and 9.9±6.9%, respectively). VH-ThFA and VH-TCFA were dominant VH-IVUS phenotypes (31.7% and 63.3%), while one lesion was classified as PIT and 2 lesions as FI. Ruptured plaques and thrombi were found in 81.7% (49 of 60) and 95.0% (57 of 60) of all patients, respectively. When 2 groups separated according to MLA were compared, VA and LA were larger in the high MLA group compared to the low MLA group. Both percentage and area of FT were larger in the high MLA group, but the percentage of DC was larger in the low MLA group. The percentage of NC showed a trend of higher concentrations in the low MLA group compared to the high MLA group. However, there was no significant difference in the phenotype or plaque features between the 2 groups.
Segmental assessment of plaque characteristics according to MLA
A segmental analysis according to MLA for grey-scale IVUS, VH-IVUS, plaque phenotypes, and the prevalence of plaque ruptures and thrombi are shown in Table 4 and Figure 2. Regardless of MLA, PB, and PA were higher in mid-segments than in proximal or distal segments. Regarding Table 2. Segmental analyses of grey-scale IVUS and VH-IVUS characteristics
Proximal Mid Distal p value
Grey-scale IVUS
IVUS LL (mm) 5.3±3.9* 7.0±4.1† 5.4±4.0* 0.031
PB (%) 55.6±5.8* 68.0±6.4† 54.1±7.3* <0.001
VA (mm2) 17.2±3.5* 16.0±3.7* 13.9±3.7† <0.001
PA (mm2) 9.6±2.5* 11.0±3.2† 7.7±2.7‡ <0.001
LA (mm2) 7.6±1.5* 5.0±0.9† 6.3±1.5‡ <0.001
MLA (mm2) 5.8±1.1* 4.3±0.8† 5.2±1.2‡ <0.001
VH-IVUS
FT (%) 58.5±12.9 57.4±12.8 61.1±12.0 0.248
FF (%) 9.8±7.0* 10.2±6.0*,† 13.1±8.9† 0.028
NC (%) 20.9±11.8*,† 22.7±11.3† 17.5±11.2* 0.044
DC (%) 10.8±8.4 9.7±7.5 8.2±8.6 0.221
FT (mm2) 3.5±1.6* 4.5±2.3† 2.8±1.6* <0.001
FF (mm2) 0.6±0.5* 0.9±0.7† 0.6±0.5* 0.021
NC (mm2) 1.3±0.9* 1.7±0.9† 0.8±0.7‡ <0.001
DC (mm2) 0.6±0.5* 0.7±0.5* 0.4±0.4† <0.001
Phenotype
PIT 4 (6.7)* 4 (6.7)* 13 (21.7)† 0.013
FI 4 (6.7) 2 (3.3) 1 (1.7) 0.507
VH-ThFA 30 (50.0)* 19 (31.7)† 36 (60.0)* 0.007
VH-TCFA 22 (36.7)* 35 (58.3)† 10 (16.7)‡ <0.001
Plaque feature
Plaque rupture 27 (45.0)* 47 (78.3)† 7 (11.7)‡ <0.001
Thrombus 37 (61.7)* 57 (95.0)† 25 (41.7)‡ <0.001
Values are number (%) or mean±standard deviation.
DC = dense calcium; FF = fibrofatty tissue; FI = fibrotic plaque; FT = fibrous tissue; IVUS = intravascular ultrasound; LA = lumen area; LL = lesion length;
MLA = minimum lumen area; NC = necrotic core; PA = plaque area; PB = plaque burden; PIT = pathological intimal thickening; VA = vessel area; VH-IVUS = virtual histology intravascular ultrasound; VH-TCFA = virtual histology intravascular ultrasound-derived thin-cap fibroatheroma; VH-ThFA = virtual histology intravascular ultrasound-derived thick-cap fibroatheroma.
*,†,‡The corresponding values with different symbols are significantly different from each other.
plaque composition, NC area was highest in the mid-segment in both groups. In addition, the mid-segment also showed the highest prevalence of VH-TCFA in both groups. In the low MLA group, the location of rupture was proximal or mid-segments, with no distal rupture.
Conversely, in the high MLA group, about 23.3% of lesions showed ruptured plaque at the distal segment. Further assessment according to segmental analysis between low and high MLA groups for these phenotypes and plaque features are shown in Table 5 and Figure 3. There was no significant difference between groups according to segmental analysis except prevalence of ruptured plaque in the distal segment of the high MLA group.
DISCUSSION
The current study had several major findings: 1) in culprit lesions of STEMI, mid-segments showed the highest PB and smallest luminal area; 2) plaque composition was significantly different among the 3 segments, with mid-segments showing a higher percentage of NC or NC areas than proximal or distal segments; 3) regarding plaque vulnerability, the proximal and mid-segments showed more vulnerable features such as higher prevalence of VH-TCFA, plaque rupture, and thrombus compared to distal segments; and 4) when classifying culprit lesions according to MLA, distribution of PB, plaque composition, and plaque phenotype and vulnerability were similar in low- and high-MLA groups. However, the location of plaque rupture was different between these MLA groups. Furthermore, no case of plaque rupture occurred in distal segments in the low-MLA group, while 23.3% of ruptured plaque occurrences were located in the distal segments of the high-MLA group.
Table 3. Grey-scale IVUS and VH-IVUS characteristics according to MLA
All (n=60) Low MLA (<4.0 mm2; n=30) High MLA (≥4.0 mm2; n=30) p value Grey-scale IVUS
IVUS LL (mm) 18.5±6.2 19.5±6.9 17.5±5.3 0.209
PB (%) 60.5±5.4 61.0±5.3 60.0±5.6 0.482
VA (mm2) 15.9±3.5 14.8±3.4 16.9±3.4 0.018
PA (mm2) 9.7±2.6 9.1±2.5 10.3±2.6 0.092
LA (mm2) 6.2±1.3 5.7±1.1 6.7±1.3 0.002
MLA (mm2) 4.3±0.8 3.7±0.3 4.8±0.8 <0.001
VH-IVUS
FT (%) 58.3±11.3 55.0±10.8 61.8±10.9 0.018
FF (%) 10.5±5.8 9.5±5.9 11.4±5.5 0.205
NC (%) 21.3±10.6 23.8±10.5 18.8±10.2 0.064
DC (%) 9.9±6.9 11.7±7.2 8.0±6.1 0.039
FT (mm2) 3.7±1.7 3.3±1.6 4.2±1.7 0.034
FF (mm2) 0.7±0.5 0.6±0.5 0.8±0.5 0.148
NC (mm2) 1.3±0.8 1.4±0.7 1.3±0.8 0.630
DC (mm2) 0.6±0.4 0.6±0.4 0.5±0.4 0.354
Phenotype
PIT 1 (1.7) 1 (3.3) 0 1.000
FI 2 (3.3) 0 2 (6.7) 0.492
VH-ThFA 19 (31.7) 8 (26.7) 11 (36.7) 0.405
VH-TCFA 38 (63.3) 21 (70.0) 17 (56.7) 0.284
Plaque feature
Plaque rupture 49 (81.7) 25 (83.3) 24 (80.0) 0.739
Thrombus 57 (95.0) 27 (90.0) 30 (100) 0.237
Values are number (%) or mean±standard deviation.
DC = dense calcium; FF = fibrofatty tissue; FI = fibrotic plaque; FT = fibrous tissue; IVUS = intravascular ultrasound; LA = lumen area; LL = lesion length;
MLA = minimum lumen area; NC = necrotic core; PA = plaque area; PB = plaque burden; PIT = pathological intimal thickening; VA = vessel area; VH-IVUS = virtual histology intravascular ultrasound; VH-TCFA = virtual histology intravascular ultrasound-derived thin-cap fibroatheroma; VH-ThFA = virtual histology intravascular ultrasound-derived thick-cap fibroatheroma.
Plaque rupture is the most common type of plaque complication, accounting for
approximately 70% of fatal acute myocardial infarctions and/or sudden coronary deaths.12) Acute coronary syndrome (ACS) caused by rupture of culprit lesions has been reported to result in worse clinical outcomes than those with an intact fibrous cap.13) Several previous studies were performed to evaluate various clinical presentations of plaque rupture and its triggering factors.1)4) However, clinical research focusing on the relationship between longitudinal lesion geometry and plaque rupture has been scarce. Since plaque rupture has a complex relationship with individual plaque vulnerability and hemodynamic forces on the plaque triggered to rupture, exploring distribution of hemodynamic forces and its relationship with lesion geometry might be important in understanding the complex mechanism of plaque rupture. Among the hemodynamic forces, WSS has been studied as a key and is known to be closely associated with transformation of plaque composition.14)15) In a recent study, researchers in the current study demonstrated through simulation with a virtual stenosis model derived from 3-dimensional geometries of patient coronary arteries that, as the DS of the coronary artery increased, WSS increased exponentially.16) In addition, Park et al.7) have also demonstrated that WSS was highest in the MLA segment in both resting and hyperemic conditions of patient-specific CFD models.
In the current study, we sought to comprehensively evaluate the impacts of lesion geometry and plaque characteristics on the location of plaque rupture using VH-IVUS images.
Segmental analysis demonstrated that mid-segments exhibited more vulnerable plaque characteristics (higher NC contents, more VH-TCFA, and ruptured plaque) than other Table 4. Segmental analyses of plaque characteristics according to MLA
Low MLA (<4.0 mm2; n=30) p value High MLA (≥4.0 mm2; n=30) p value
Proximal Mid Distal Proximal Mid Distal
Grey-scale IVUS
IVUS LL (mm) 5.8±4.8 7.0±4.6 6.1±4.7 0.547 4.9±2.7* 7.0±3.6† 4.7±3.2* 0.009
PB (%) 55.7±5.9* 69.2±5.7† 53.8±7.9* <0.001 55.5±5.8* 66.8±6.9† 54.4±6.7* <0.001
VA (mm2) 16.4±3.5* 14.7±3.2* 12.5±2.9† <0.001 18.0±3.3* 17.2±3.8† 15.4±3.9† 0.020
PA (mm2) 9.3±2.6* 10.3±2.9* 6.9±2.4† <0.001 10.0±2.3* 11.7±3.5† 8.5±2.7* <0.001
LA (mm2) 7.2±1.3* 4.4±0.5† 5.7±1.5‡ <0.001 8.0±1.6* 5.5±0.8† 6.9±1.7‡ <0.001
MLA (mm2) 5.4±0.9* 3.7±0.3† 4.6±1.0‡ <0.001 6.3±1.0* 4.8±0.7† 5.7±1.2* <0.001
VH-IVUS
FT (%) 55.7±12.2 52.2±12.3 58.9±12.2 0.116 61.4±13.2 62.5±11.4 63.4±11.6 0.804
FF (%) 9.2±7.6 9.1±5.6 12.4±10.1 0.202 10.3±6.4 11.4±6.3 13.9±7.6 0.115
NC (%) 22.6±11.5 26.2±11.1 19.3±11.6 0.071 19.1±12.0 19.1±10.4 15.7±10.8 0.383
DC (%) 12.4±8.5 12.5±7.9 9.5±9.7 0.316 9.2±8.1 7.0±5.9 7.0±7.3 0.378
FT (mm2) 3.2±1.6* 3.9±2.0† 2.3±1.4* 0.003 3.9±1.5* 5.2±2.3† 3.3±1.6* <0.001
FF (mm2) 0.6±0.6 0.7±0.6 0.5±0.5 0.316 0.7±0.5* 1.0±0.8† 0.7±0.4* 0.045
NC (mm2) 1.3±0.9* 1.8±0.9† 0.8±0.7‡ <0.001 1.2±1.0*,† 1.5±1.0† 0.8±0.7* 0.013
DC (mm2) 0.7±0.5* 0.8±0.5* 0.3±0.4† <0.001 0.6±0.6 0.5±0.4 0.4±0.4 0.179
Phenotype
PIT 1 (3.3)* 1 (3.3)* 8 (26.7)† 0.004 3 (10.0) 3 (10.0) 5 (16.7) 0.661
FI 1 (3.3) 0 0 0.364 3 (10.0) 2 (6.7) 1 (3.3) 0.585
VH-ThFA 16 (53.3) 10 (33.3) 17 (56.7) 0.147 14 (46.7)*,† 9 (30.0)* 19 (63.3)† 0.035
VH-TCFA 12 (40.0)* 12 (40.0)* 5 (16.7)† 0.001 10 (33.3)* 16 (53.3)* 5 (16.7)† 0.011
Plaque feature
Plaque rupture 13 (43.3)* 24 (80.0)† 0‡ <0.001 14 (46.7)* 23 (76.7)† 7 (23.3)* <0.001 Thrombus 19 (63.3)* 27 (90.0)† 9 (30.0)‡ <0.001 18 (60.0)* 30 (100.0)† 16 (53.3)* <0.001 Values are number (%) or mean±standard deviation.
DC = dense calcium; FF = fibrofatty tissue; FI = fibrotic plaque; FT = fibrous tissue; IVUS = intravascular ultrasound; LA = lumen area; LL = lesion length;
MLA = minimum lumen area; NC = necrotic core; PA = plaque area; PB = plaque burden; PIT = pathological intimal thickening; VA = vessel area; VH-IVUS = virtual histology intravascular ultrasound; VH-TCFA = virtual histology intravascular ultrasound-derived thin-cap fibroatheroma; VH-ThFA = virtual histology intravascular ultrasound-derived thick-cap fibroatheroma.
*,†,‡The corresponding values with different symbols are significantly different from each other.
segments. Conversely, distal segments showed the lowest prevalence of such vulnerable features, and PIT was more prevalent in the distal segment than the proximal and mid- segments. For VH-TCFA, a sequential order of incidence could be listed as mid-, proximal, and distal segments. In addition, the rupture location was also primarily the proximal or mid-segments. This result is in line with a previous observational study, which focused on evaluating rupture locations in ACS patients.17) In addition, considering previous studies that presented the potential role of WSS, which can increase plaque vulnerability,18) the highest percentage of NC or NC area, and the highest prevalence of VH-TCFA in the mid-segment
%
Proximal Mid Distal
A
80 60 40 20 0 100
%
Proximal Mid Distal
B
80 60 40 20 0 100
%
Proximal Mid Distal
C
80 60 40 20 0 100
** ** *
* * *
* * *
Segment Low MLA group
Segment Segment
FT FF NC DC Thrombus Plaque rupture
PIT FI ThFA TCFA
High MLA group
%
Proximal Mid Distal
D
80 60 40 20 0 100
%
Proximal Mid Distal
E
80 60 40 20 0 100
%
Proximal Mid
Segment Segment Segment
Distal F
80 60 40 20 0 100
* *
* * * *
FT FF NC DC Thrombus Plaque rupture
PIT FI ThFA TCFA
Figure 2. Segmental analysis of plaque characteristics according to MLA. (A, D) Relative contents of four tissue components for each segment, (B, E) phenotype classifications for each segment, and (C, F) plaque features for each segment according to MLA.
DC = dense calcium; FF = fibrofatty tissue; FI = fibrotic plaque; FT = fibrous tissue; MLA = minimum lumen area; NC = necrotic core; PIT = pathological intimal thickening; TCFA = thin-cap fibroatheroma; ThFA = thick-cap fibroatheroma.
*p<0.05.
Table 5. Comparison of plaque features between MLA groups for each segment
Proximal p value Mid p value Distal p value
MLA <4.0 MLA ≥4.0 MLA <4.0 MLA ≥4.0 MLA <4.0 MLA ≥4.0
VH-TCFA 12 (40.0) 10 (33.3) 0.592 12 (40.0) 16 (53.3) 0.432 5 (16.7) 5 (16.7) 1.000
Plaque rupture 13 (43.3) 14 (46.7) 0.795 24 (80.0) 23 (76.7) 0.754 0 7 (23.3) 0.011
Thrombus 19 (63.3) 18 (60.0) 0.791 27 (90.0) 30 (100.0) 0.237 9 (30.0) 16 (53.3) 0.067
Values are number (%).
MLA = minimum lumen area; VH-TCFA = virtual histology intravascular ultrasound-derived thin-cap fibroatheroma.
of the culprit lesions can be explained by WSS distribution according to longitudinal lesion geometry. The MLA site was found in the mid-segment, and more NC and VH-TCFA were identified as well as ruptured plaque and thrombus. Clinically, it was found that the mid- segment of a whole lesion was the culprit segment for STEMI lesions; thus, using IVUS, we could determine the culprit segment when the distal flow was minimal or the culprit lesions were separated.
One interesting phenomenon is distal segment plaque rupture. Tanaka et al.17) reported that downstream rupture was found in 36.1% of 72 ACS patients. In the current study, seven culprit lesions exhibited distal segment plaque rupture that occurred only in the high MLA groups. Since the direction of blood flow is antegrade, hemodynamic forces are generally higher in proximal or mid-segments than in distal segments.14) However, our previous study demonstrated that the downstream axial plaque stress, which presented as another potential hemodynamic force acting on plaque, can be higher in distal segments in the presence of longitudinal asymmetry of the plaque (i.e., plaque with a downstream shoulder).8)19) Furthermore, unlikely with the upstream axial plaque stress that linearly increases when stenosis severity increases, downstream axial plaque stress showed a biphasic response to stenosis severity. The risk of downstream rupture decreases in severe stenosis as downstream axial plaque stress decreases after a certain level of stenosis. The relatively lower incidence of STEMI in cases with distal segment rupture might be explained by the relatively lower stenosis severity of underlying culprit plaque and less flow disturbance in lesions with downstream rupture.8) Results of the current study are in line with these previous studies. Since the current study exclusively evaluated culprit plaque of STEMI, the incidence of distal segment rupture was relatively lower than that found by Tanaka et al.17) or Lee et al.8) In addition, distal segment plaque rupture was observed only in the high MLA subgroup, suggesting the higher probability of distal segment rupture in plaques with less severe stenosis. Hence, in STEMI lesion with MLA ≥4.0 mm2, the distal segment must be monitored in order to identify the existence of plaque rupture, and this information could be useful in clinical decisions related to PCI and the length of stent required for full coverage of the lesion.
Although the mechanism of plaque rupture that might occur as a result of complex interactions among various plaque characteristics, plaque vulnerability, and hemodynamic forces has
%
Proximal
40.033.3
Mid Distal
A
80 60 40 20 0 100
%
Proximal Mid Distal
B
80 60 40 20 0 100
63.3 53.3
16.7 16.7
63.3 60.0 90.0
100.0
30.0 53.3
43.3 46.7
80.076.7
0.0 23.3
%
Proximal Mid Distal
C
80 60 40 20 0 100
*
Segment Segment Segment
Low MLA High MLA Figure 3. Comparison of plaque features according to MLA.
(A) VH-TCFA, (B) thrombus, and (C) plaque rupture prevalence for each segment according to MLA.
MLA = minimum lumen area; VH-TCFA = virtual histology intravascular ultrasound-derived thin-cap fibroatheroma.
*p<0.05.
not been fully clarified, the above results imply a possible link between longitudinal lesion geometry and transformation of plaque composition, even within the same culprit lesion, and its association with plaque rupture location and consequent clinical presentation.
Some limitations of the current study should be noted. First, since the study sample exclusively evaluated STEMI patients who underwent VH-IVUS for a culprit lesion, selection bias could not be fully excluded. Second, the study population was small, as only discrete single LAD culprit lesions from STEMI patients were included. However, the specific methodologies of the study allowed the highest quality of findings and results. Third, although we excluded patients with post-balloon angioplasty in order to avoid procedure- related rupture, the possibility of IVUS catheter-related plaque damage, especially in the mid- segment, could not be fully excluded. Fourth, diffuse lesions were excluded from the analysis due to the complex geometry of their subsets; LA index cannot reliably represent longitudinal lesion geometry in those lesions.
The culprit lesions of STEMI showed significantly different plaque composition, prevalence of VH-TCFA, ruptured plaque, and thrombus, according to longitudinal segment. Therefore, the analysis of longitudinal lesion geometry using the LA index can be useful when evaluating plaque vulnerability and the incidence of plaque rupture and thrombus in STEMI patients.
REFERENCES
1. Dong L, Mintz GS, Witzenbichler B, et al. Comparison of plaque characteristics in narrowings with ST- elevation myocardial infarction (STEMI), non-STEMI/unstable angina pectoris and stable coronary artery disease (from the ADAPT-DES IVUS Substudy). Am J Cardiol 2015;115:860-6.
PUBMED | CROSSREF
2. Jang HJ, Koo BK, Lee HS, et al. Safety and efficacy of a novel hyperaemic agent, intracoronary nicorandil, for invasive physiological assessments in the cardiac catheterization laboratory. Eur Heart J 2013;34:2055-62.
PUBMED | CROSSREF
3. Takaoka N, Tsujita K, Kaikita K, et al. Comprehensive analysis of intravascular ultrasound and angiographic morphology of culprit lesions between ST-segment elevation myocardial infarction and non-ST-segment elevation acute coronary syndrome. Int J Cardiol 2014;171:423-30.
PUBMED | CROSSREF
4. Maehara A, Mintz GS, Bui AB, et al. Morphologic and angiographic features of coronary plaque rupture detected by intravascular ultrasound. J Am Coll Cardiol 2002;40:904-10.
PUBMED | CROSSREF
5. Stone GW, Maehara A, Lansky AJ, et al. A prospective natural-history study of coronary atherosclerosis. N Engl J Med 2011;364:226-35.
PUBMED | CROSSREF
6. Samady H, Eshtehardi P, McDaniel MC, et al. Coronary artery wall shear stress is associated with progression and transformation of atherosclerotic plaque and arterial remodeling in patients with coronary artery disease. Circulation 2011;124:779-88.
PUBMED | CROSSREF
7. Park JB, Choi G, Chun EJ, et al. Computational fluid dynamic measures of wall shear stress are related to coronary lesion characteristics. Heart 2016;102:1655-61.
PUBMED | CROSSREF
8. Lee JM, Choi G, Hwang D, et al. Impact of longitudinal lesion geometry on location of plaque rupture and clinical presentations. JACC Cardiovasc Imaging 2017;10:677-88.
PUBMED
9. American College of Emergency PhysiciansSociety for Cardiovascular Angiography and
InterventionsO'Gara PT, et al. 2013 ACCF/AHA guideline for the management of ST-elevation myocardial infarction: a report of the American College of Cardiology Foundation/American Heart Association Task Force on Practice Guidelines. J Am Coll Cardiol 2013;61:e78-140.
PUBMED | CROSSREF
10. Mintz GS, Nissen SE, Anderson WD, et al. American College of Cardiology clinical expert consensus document on standards for acquisition, measurement and reporting of intravascular ultrasound studies (ivus). A report of the American College of Cardiology Task Force on clinical expert consensus documents. J Am Coll Cardiol 2001;37:1478-92.
PUBMED | CROSSREF
11. García-García HM, Mintz GS, Lerman A, et al. Tissue characterisation using intravascular radiofrequency data analysis: recommendations for acquisition, analysis, interpretation and reporting. EuroIntervention 2009;5:177-89.
PUBMED | CROSSREF
12. Naghavi M, Libby P, Falk E, et al. From vulnerable plaque to vulnerable patient: a call for new definitions and risk assessment strategies: part I. Circulation 2003;108:1664-72.
PUBMED | CROSSREF
13. Niccoli G, Montone RA, Di Vito L, et al. Plaque rupture and intact fibrous cap assessed by optical coherence tomography portend different outcomes in patients with acute coronary syndrome. Eur Heart J 2015;36:1377-84.
PUBMED | CROSSREF
14. Kwak BR, Bäck M, Bochaton-Piallat ML, et al. Biomechanical factors in atherosclerosis: mechanisms and clinical implications. Eur Heart J 2014;35:3013-20, 3020a-3020d.
15. Fukumoto Y, Hiro T, Fujii T, et al. Localized elevation of shear stress is related to coronary plaque rupture:
a 3-dimensional intravascular ultrasound study with in-vivo color mapping of shear stress distribution. J Am Coll Cardiol 2008;51:645-50.
PUBMED | CROSSREF
16. Lee KE, Kim GT, Lee JS, Chung JH, Shin ES, Shim EB. A patient-specific virtual stenotic model of the coronary artery to analyze the relationship between fractional flow reserve and wall shear stress. Int J Cardiol 2016;222:799-805.
PUBMED | CROSSREF
17. Tanaka A, Shimada K, Namba M, et al. Relationship between longitudinal morphology of ruptured plaques and TIMI flow grade in acute coronary syndrome: a three-dimensional intravascular ultrasound imaging study. Eur Heart J 2008;29:38-44.
PUBMED | CROSSREF
18. Slager CJ, Wentzel JJ, Gijsen FJ, et al. The role of shear stress in the destabilization of vulnerable plaques and related therapeutic implications. Nat Clin Pract Cardiovasc Med 2005;2:456-64.
PUBMED | CROSSREF
19. Choi G, Lee JM, Kim HJ, et al. Coronary artery axial plaque stress and its relationship with lesion geometry: application of computational fluid dynamics to coronary CT angiography. JACC Cardiovasc Imaging 2015;8:1156-66.
PUBMED | CROSSREF