S S S e e e n n n s s s o o o r r r s s s & & & T T T r r r a a a n n n s s s d d d u u u c c c e e e r r r s s s
© 2014 by IFSA Publishing, S. L.
http://www.sensorsportal.com
Computer-Aided Diagnosis Sensor and System of Breast Sonography: A Clinical Study
* Jong-Ha Lee and Eun-Jin Lee
Keimyung University, School of Medicine, Medical Imaging and Biosignals Laboratory, Daegu, South Korea
Tel.: 053-580-3736, fax: 053-580-3746
* E-mail: [email protected]
Received: 21 June 2014 /Accepted: 30 September 2014 /Published: 31 October 2014
Abstract: Early detection of breast cancer is critical in determining the best possible treatment approach.
Ultrasound imaging has become an important modality in breast tumor detection and classification owing to its superiority to mammography in its ability to detect focal abnormalities in dense breast tissue. This paper discusses novel Fourier-based shape feature extraction techniques that provide enhanced classification accuracy for breast tumors in the computer-aided B-mode ultrasound diagnosis system. To verify the effectiveness of the proposed technique, experiments were performed using 4,107 ultrasound images containing 2,508 malignancy cases. Experimental results showed that the breast tumor classification accuracy has specificity of 95.8 %, sensitivity of 94.1 %, precision and recall of 95.7 %, and accuracy of 94.9 %. Copyright © 2014 IFSA Publishing, S. L.
Keywords: Computer-aided diagnosis, Ultrasound, Big data, Breast cancer, Early detection.
1. Research Background
1.1. The Need for Breast Ultrasonography The incidence of breast cancer in women worldwide has been on the rise for 30 years. In particular, the incidence of breast cancer has increased by 2.5 fold of that of other cancers. In 2010 alone, 1.6 million women worldwide were diagnosed with breast cancer, while 425,000 people died of it, 68,000 of who were women between the ages 15 and 49 years living in developing countries [1]. In addition, breast cancer has the highest incidence rate among all cancers in females in Korea, and the World Health Organization reported that the rate of increase in breast cancer patients was the highest in Korea globally during the past 10 years. In order to curb the rate of breast cancer mortality, early diagnosis is
essential, and regular check-ups are necessary starting at the age of 35 at the latest due to the high number of breast cancer patients in their 40s in Korea.
Mammography is the standard imaging technique for breast cancer diagnosis [2]. Mammography is used to identify abnormal lesions or tumors in the breasts and takes 2 images of each breast using the craniocaudal (CC) and mediolateral oblique (MLO) imaging techniques [3]. In CC, the patient stands facing the X-ray tube with feet apart and lifts the breast so that the angle between the breast and the chest becomes 90°. The technique requires matching the height of the cassette holder to that of the breast, pulling breast to the front of the chest, and compressing it until it is tight and the profile of the nipple is located at the center of the image. In MLO, the direction of the X-ray tube is set at 40–60°,
depending on the physique of the patient, and the height of the film tray is adjusted while the patient is holding onto a handle on the equipment with the hand on the side being examined. The patient places the other hand toward the ribs on the other breast in order to stretch the breast tissues, as well as the front and inside chest muscles, while pressure is gradually applied to the patient who is leaning against the equipment with the breast and chest muscles facing forward on the tray.
In mammography, breast cancer appears as masses or patterns of microcalcifications; however, most are identified as irregular masses with ragged borders. Approximately 1/4 of cases show patterns of microcalcifications, while early-phase breast cancer shows only microcalcifications without masses. The examination results are either normal or require further examinations which include breast ultrasonography or zoom imaging of suspected areas.
However, such breast imaging techniques have limitations for early diagnosis [4]. The average size of a tumor detectable by mammography is 1 cm and is often discovered in the 1B phase; in addition, the cost of equipment is approximately 200 to 300 million KRW, and the imaging process causes discomfort and pain in women. Furthermore, young Korean women (mostly single women in their 30 s or those with firm breasts) tend to have tight breast form with dense fibrous tissues and less fat tissues, which makes the detection of calcification or masses difficult because the images appear cloudy or blurry.
Therefore, the U.S. is increasingly mandating the notification of breast density to breast cancer patients, and a statute was enacted in 2010 requiring ultrasound examination to be performed in parallel to mammography for women with dense breast tissues.
In contrast, breast ultrasonography is more effective for imaging dense breasts and is being increasingly preferred by specialists because it achieves higher resolution enabling a better-quality diagnosis. However, despite its advantage of real- time examination, diagnosis results vary greatly depending on the device used for ultrasonography and the experience of the physician, which has prevented the technique from being recognized as a standard and objective method among all tests. In addition, there is a high possibility of fatigue-induced misdiagnosis in general hospitals with a large number of patients because the physician must identify the presence of lesions while conducting the ultrasonography directly. Moreover, the same imaging may yield different readings depending on physicians because it involves subjective interpretation by physicians. Cancer diagnosis by breast ultrasonography is achieved by identifying specific lesions in the imaging, which are then categorized as malignant or benign. However, for inexperienced physicians, it is not easy to identify and categorize lesions. In addition to such difficulty arising from the varying skills of physicians, other factors that may cause error in diagnosis include (1) dissimilarity among images in the imaging device
and (2) noise within the digital image. Noise is the major cause of diagnostic error. Ultrasonography by nature has considerable image noise, and imaging processing techniques are critical. These factors pose serious difficulties in detecting a certain lesion.
Breast ultrasonography, unlike mammography, cannot produce an image of the entire breast, it requires a long examination time, and it cannot diagnose the microcalcifications within breasts.
1.2. The Need for a Computer-aided Diagnosis System
Therefore, in order to overcome such difficulties, a computer-aided diagnosis (CAD) system is needed to assist with diagnosis by automatically processing the acquired breast ultrasonography imaging to detect lesions and analyze patterns [5, 6]. With such a technique, the subjectivity among physicians can be minimized while enhancing the overall sensitivity, accuracy, and detection rate in the diagnostic procedures performed by physicians. This study examined a CAD system for diagnosing lesions in breast ultrasonography by recording and analyzing abnormal findings in an image by interpreting, digitalizing, and automatically calculating the image according to the Breast Imaging-Reporting and Data System (BI-RADS) categorization method as specified by the U.S. Radiological Society [7]. BI- RADS is a lexicon for organizing interpretation items to ensure consistency in ultrasonography terminology and includes definitions for tumors, structural distortion of breasts, asymmetry, density, and calcification [8]. BI-RADS results quantified by various algorithms are provided to physicians as secondary findings to supplement overall lesion discovery and diagnostic procedures, while CAD acts as a supplementary diagnostic system for inexperienced physicians by digitalizing the subtle differences between malignant and benign lesions that are difficult to detect by gross examination only.
2. Methods
2.1. Meaning and Mechanism of CAD
Fig. 1 shows the CAD system diagram of breast ultrasonography suggested in this study. Breast ultrasonography CAD is divided into CADe, which indicates suspected areas of lesions, and CADx, which indicates the malignancy of the lesions.
Suspected areas are first identified with CADe, and the lesions are then described and diagnosed according to BI-RADS in CADx. The BI-RADS items of CADx are used not only for the physician’s diagnosis but also for calculating the malignancy of the lesions. In order to diagnose the malignancy of the lesions, an automated diagnostic model created in advance is required. This model is created from the
BI-RADS result of each image from a large database of breast ultrasonography called the Picture Archiving and Communication System (PACS).
First, suspected areas of lesions are marked in the breast ultrasonography, and results are classified according to the BI-RADS lexicon by radiologists.
Fig. 1. Configuration of breast ultrasonography CAD system. CAD consists of CADe and CADx. The automatic breast cancer diagnosis model is generated from the large database of ultrasonography images in PACS.
2.2. BI-RADS
BI-RADS lexicon items include shape, orientation, margin, echo pattern, and posterior;
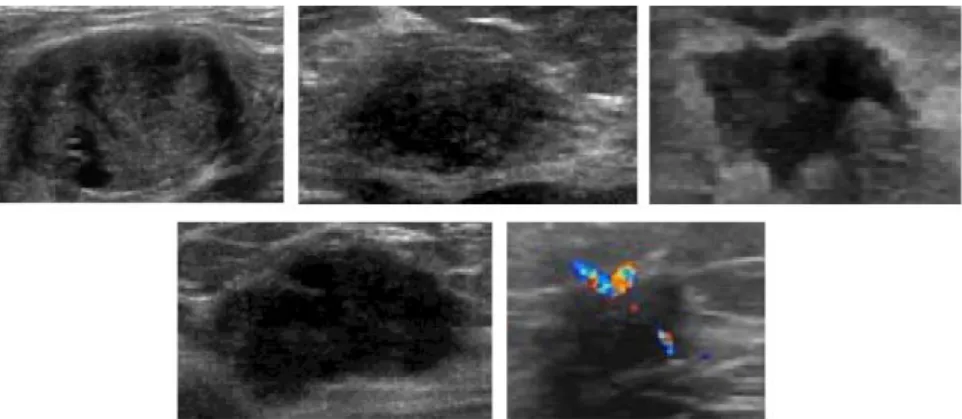
particularly, the shape of the lesion acts as the most important factor in diagnosing breast cancer [9]. Fig.
2 is the example of ultrasonography. Shape is
determined as oval when it is ellipsoidal or there are 2 or 3 curves, as round when it is circular, and as irregular when neither description applies. Benign tumors are usually oval or round with smooth edges because they do not metastasize, while malignant tumors are irregular with ragged edges due to invasive metastasis and irregular growth.
Fig. 2. Examples oval, round, and irregular lesions in ultrasonography.
This study used a Fourier-conversion-based lesion shape calculator which quantifies irregularity by Fourier-converting the border of the lesions in order to express the irregularity quantitatively [10].
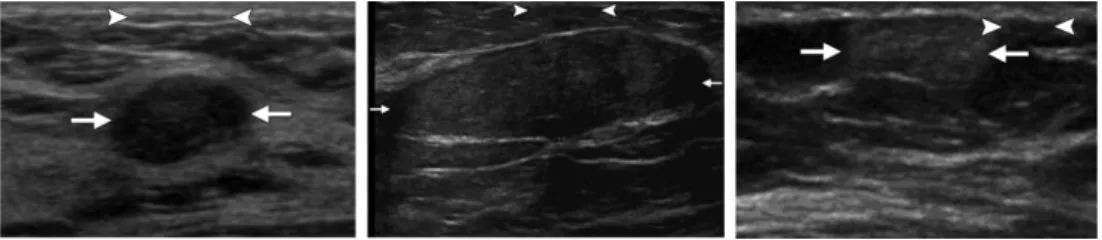
Orientation is described as parallel when the long axis of the tumor is parallel to skin wrinkles and when the horizontal axis is longer than the vertical axis, or as nonparallel when the long axis is not
aligned with the skin wrinkles and when the vertical axis is longer than the horizontal axis. Benign tumors are more flexible compared with malignant tumors;
they become distorted or displaced when pressure is applied, while malignant tumors tend to retain their shape. Fig. 3. Shows the examples of parallel and nonparallel lesions in ultrasonography.
Fig. 3. Examples of parallel and nonparallel lesions in ultrasonography.
A margin is defined as the border between a lesion and the surrounding tissues; it is described as circumscribed when the border is clearly visible or noncircumscribed if it is not. Noncircumscribed cases are further classified into indistinct (indistinct border between the mass and surrounding tissues), angular (several or all edges of the borders are clear and
contain acute angles), microlobulated (showing fan shapes in short cycles along the border of the mass), and spiculated (having a needle-shaped border).
Benign tumors are separated from surrounding tissues and are wrapped in fibrous film, while malignant tumors are not covered in film; therefore, circumscribed borders usually indicate benign tumors while noncircumscribed cases are most often malignant.
Lesion boundaries are divided into abrupt interface and echogenic halo types. In an abrupt interface, a clear border between the lesion and the surrounding tissues is very narrow, and the echo around the edges is clearly visible regardless of the thickness of the surrounding tissues. Conversely, in an echogenic halo, the border between the lesion and the surrounding tissues is not clear, and it appears to be continuous with the reflected areas. Fig. 4. Shows the examples of ultrasonography.
Fig. 4. Examples of (a) circumscribed; (b) indistinct; (c) angular; (d) microlobulated, and (e) spiculated lesions in ultrasonography.
Echo patterns are categorized into anechoic (no internal reflection), hyperechoic (internal reflectivity is higher compared to fat and similar to that of fibrous tissues), hypoechoic (showing low echo in fat tissues), complex (having the characteristics of both
anechoic and echogenic) and isoechoic (difficult to distinguish due to a similar degree of reflection as fat tissues in other tissues).
Fig. 5. Shows the examples of an abrupt interface and echogenic halos in ultrasonography.
Fig. 5. Example of an (a) abrupt interface, and (b) echogenic halos in ultrasonography.
Posterior acoustic features are divided into
enhancement (increased echo in the posterior of the tumor), shadowing (reduced echo, excluding the shadow of the border), no posterior acoustic feature
(without enhancement or shadowing), and combined pattern (showing both enhancement and shadowing or damping in the posterior). Fig. 6 shows the examples of ultrasonography patterns. Fig. 7 shows the examples of enhancement and shadowing in ultrasonography.
In addition to the shape of the lesions, a characteristic extractor was created to suite the purpose of each item in order to determine the BI- RADS categories such as posterior acoustic, orientation, margin, and echo pattern as characteristics in the image. In order to create an
automatic lesion diagnosis model, a supplementary breast cancer diagnosis model was generated by determining the characteristics of each BI-RADS category from a large database of PACS breast ultrasonography images using a characteristic extractor, and then using a pattern-recognition algorithm and data mining technique. The supplementary breast cancer diagnosis model created by this method was able to identify the location of the lesions and identify benign or malignant tumors automatically when a new breast ultrasonography image was input into the CAD system.
Fig. 6. Examples of (a) hypoechoic; (b) isoechoic, and (c) hyperechoic patterns in ultrasonography.
Fig. 7. Examples of (a) enhancement, and (b) shadowing in ultrasonography.
2.3. Image Segmentation and Detection The CAD system suggested in this study extracts lesions from breast ultrasonography images, describes extracted lesion areas based on their BI- RADS classification, and processes the information using a lesion diagnostic modeling categorizer [11].
The identification of tumors includes three steps: 1) detection of lesion areas, 2) extraction of the lesion boundaries, and 3) determination of lesion malignancy.
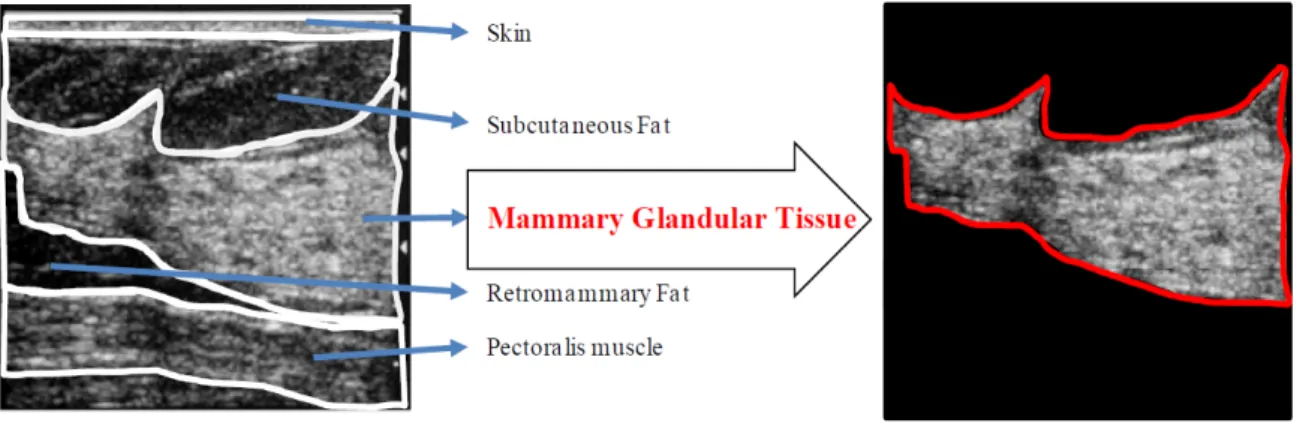
2.3.1. Lesion Area Detection Using the Morphological Information of Lesions and Structural Information of Breasts The characteristics of breast ultrasonography include speckle noise and the appearance distinguishing skin, subcutaneous fat, mammary
glandular tissue, retromammary fat, and pectoralis muscle. Fat layers and lesions appear dark, while breast tissues appear white. Therefore, the characteristics of lesions include a dark interior compared to surroundings with a circular or oval shape. In addition, the location of lesions is generally in the mammary glandular tissue. Therefore, lesion detection may be higher when looking for lesions in the mammary glandular tissue area rather than in the entire image. Therefore, this study examines the algorithm for detecting lesions in the mammary glandular tissue area using morphological information of the lesion and the structural information of the breasts. Fig. 8 shows the mammary glandular tissue area in breast ultrasonography.
2.3.2. Extraction of Lesion Boundaries Using the Canny Algorithm
Once a lesion area has been detected, the boundaries of the lesion must be extracted. In general, the lesion area in breast ultrasonography is darker than the surrounding tissues, and the pixel value abruptly changes in the image. In this study, the boundaries of the lesion are extracted using the gradient information of the pixel value. First, the image is convoluted through a Gaussian mask which is a blurring technique that smoothens the image by removing fine details. Then, the gradient magnitude and direction is calculated for each resulting pixel.
The second derivative is then calculated along the gradient direction, and a point with a value of 0 is categorized as a lesion boundary. The lesion boundaries are extracted by connecting all such points.
Fig. 8. Example of morphological information in breast ultrasonography and the area of mammary glandular tissue separated from the image.
2.3.3. Determining the Malignancy
of a Tumor Using BI-RADS Category Information
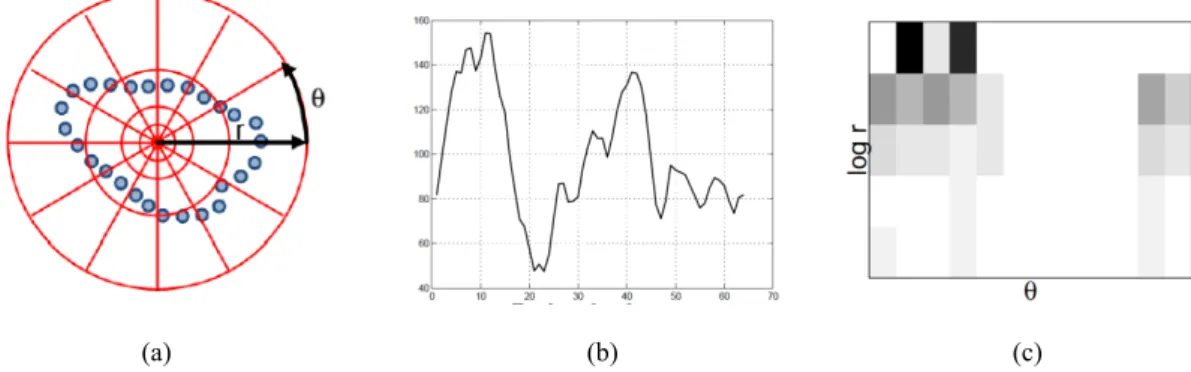
An algorithm that analyzes lesions using the extracted lesion outline was studied. In this study, the malignancy of lesions in breast ultrasonography is calculated using five types of BI-RADS category information. The BI-RADS categories to be calculated include Shape (Regular/Irregular), Orientation (Parallel/Nonparallel), Margin (Circumscribed/Noncircumscribed), Echo pattern (Anechoic/Hyperechoic) and Posterior (No posterior/Shadowing). These BI-RADS categories are part of the mass categories and are essential to the diagnosis of lesions. In order to extract each BI- RADS category, the morphological characteristics and texture characteristics of lesions are used. In particular, the morphology of the lesion is the most important factor in determining its malignancy. In order to express the morphology of the lesion clearly, the study suggests Fourier conversion based a lesion morphology description algorithm. The Fourier- conversion-based lesion morphology description algorithm first calculates a morphology histogram from the lesion outline and converts this histogram into a one-dimensional signal. The morphology histogram is generated by a log–polar bin histogram generator [12]. The Fourier coefficient is obtained by Fourier transforming the one-dimensional signal. The Fourier coefficient is used as a characteristic for determining the morphology of the lesion. In general, a greater malignancy of the lesion results in greater irregularity of lesion shape, and the change in the Fourier coefficient is expected to differ greatly from benign to malignant. Fig. 9 shows the location of malignant lesion in breast ultrasonography of breast cancer patient.
Fig. 10 shows the histogram calculated using the lesion histogram from lesion outline in Fig. 9 with the one-dimensional signal from it.
In order to determine the malignancy of lesions, an automatic breast cancer diagnosis model was created from a large database of PACS breast
ultrasonography images using a data mining technique. Data mining calculates all BI-RADS characteristics by analyzing ultrasonography of previous breast cancer patients saved in PACS and then creates a model. The model created in such a manner extracts the BI-RADS characteristics in an image when a new breast ultrasonography is input and determines whether the lesion is benign or malignant based on the values. Table 1 shows the BI- RADS feature lists.
(a) Breast ultrasonography of breast cancer patient.
(b) Location of malignant lesion in breast ultrasonography (red border)
Fig. 9. Location of malignant lesion in breast ultrasonography of breast cancer patient.
(Samsung Medical Center, 2012).
(a) (b) (c)
Fig. 10. (a) log-polar diagram. (b) 2-dimensional boundary histogram contained in per bin unit.
(c) Histogram transformed into 1-D.
2.4. Feature List
Table 1. BI-RADS Feature List.
Extractor Feature No. Feature Name
1 F1–F140 Spatial gray-level dependence (SGLD) matrix 2 F141–F203 Fourier with shape context
3 F204–234 Fourier with centroid distance (Magnitude) 4 F235–F265 Fourier with centroid distance (Phase) 5 F266 Intensity in the mass area
6 F267 Gradient magnitude in the mass area
7 F268 Orientation
8 F269 Depth–width ratio
9, 10, 11 F270–F272 Distance between mass shape and best-fit ellipse 12, 13, 14,
15, 16, 17 F273–F278 The average gray changes between tissue area and mass area 18 F279 The average gray changes between posterior and mass area 19, 20, 21, 22 F280–F283 The histogram changes between tissue and mass (bin 0–3)
23 F284 Compare the gray value of left, post, and right under lesion 24 F285 The number of lobulate areas
25 F286 The number of protuberances 26 F287 The number of depressions
27 F288 Lobulation index
28, 29 F289–F290 Elliptic-normalized circumference 30, 31, 32,
33, 34, 35 F291–F296 Histogram (mean, variance, skewness, kurtosis, energy, entropy) 36, 37 F297–F298 Fourier power spectrum (annular-ring and wedge sampling
geometries)
38, 39, 40, 41, 42, 43, 44,
45, 46
F299 Circularity
F300 Norm. radial length standard dev.
F301 Area ratio
F302 Roughness index
F303 Spiculation index ratio (CCW) F304 Spiculation ratio (CCW) F305 D-W Ratio (density gradient) F306 D-W Ratio (interclass variance) F307 D-W Ratio (variance)
2.5. Machine Learning Algorithm
In order to create an automatic lesion diagnostic model, an automatic breast cancer diagnostic model was created using a pattern recognition algorithm and big data mining technique after calculating the characteristics of BI-RADS from a large database of PACS breast cancer ultrasonography images using the characteristics extractor. In order to create this model, learning was performed using the five representative machine learning algorithms (Aadaboost, J48, Logitboost, NaïveBayes, J48). A machine learning algorithm inputs data into the computer, performs learning based on a specific algorithm, establishes criteria for categorization, and predicts the category of the data when new data are input. Data mining refers to the process of discovering useful correlations hidden in large quantities data and extracting information which can be used in future decision-making. The five algorithms used in model creation are described below.
2.5.1. Support Vector Machine (SVM)
A machine learning algorithm refers to an algorithm which inputs given data into the computer, performs learning based on a specific algorithm, establishes criteria for categorization, and predicts the category of the data when new data are input. Data mining refers to the process of discovering useful correlations hidden in large quantities data and extracting information which can be used in future decision-making.
In order to create an automatic lesion diagnostic model, an automatic breast cancer diagnostic model was created using a pattern recognition algorithm and big data mining technique after calculating the characteristics of BI-RADS from a large database of PACS breast cancer ultrasonography images using a characteristics extractor. This paper will describe in detail the SVM algorithm which is most frequently used with an elevated accuracy.
Ci refers to the variable having the value of 1 or −1 and is the class xi belongs to, while xi is the real vector in the p-dimension. H3 does not properly sort the points in the 2 classes. H1 and H2 classify the points in the 2 classes, and it can be see that H2
classifies them with a larger margin than H1 does.
Many learning algorithms, including neural networks, have the common goal of identifying the hyperplane which separates the ci = 1 points from the ci = −1 points when such learning data were given. What differentiates SVM from other algorithms is that it identifies the maximum-margin hyperplane among many potential planes which may separate the points.
Here, margin refers to the minimum value for the distance from the hyperplane to each point. In order to maximize the margin while classifying points into 2 classes, the hyperplane must be located so that the minimum value among the distances belonging to
class 1 and the minimum value among the distances belonging to class −1 must be the same. Such a hyperplane is known as the maximum-margin hyperplane. In conclusion, SVM is an algorithm that identifies how to maximize the distance between the points of the 2 classes among the countless hyperplanes which separate the points belonging to the 2 classes.
2.5.2. Adaboost
Adaboost is an algorithm that creates a strong classifier by combining weak classifiers. Here, a weak classifier generally uses a threshold classifier of a specific dimension.
2.5.3. J48 (Decision Tree)
A decision tree is a graphic representation of procedures for categorizing or assessing items of interest.
2.5.4. Logitboost
While Adaboost is an algorithm that can minimize exponential loss, Logitboost is an algorithm that can minimize logistics damage.
2.5.5. Naïve Bayes
Naïve Bayesian classification is a simple probabilistic categorization. The probabilistic model can be induced using the Bayes’ Theorem and includes a strong independent assumption which cannot be derived in reality.
3. Experimental
A total of 4,107 breast cancer tumor images were obtained from Samsung Medical Center which were taken between 2006 and 2010. Among the images obtained, 1,599 images were of benign tumors taken from patients aged 11–81 (M = 45); the remaining 2,508 images were of malignant tumors taken from patients aged 24–86 (M = 49). All images were taken using the Philips ATL iU22 ultrasound device under the supervision of Samsung Medical Center. The scanner was mounted with a 6-cm linear probe set at 5–12 MHz. The image size in B-mode was 1024 × 768 pixels with a spatial resolution of 0.23 mm/pixel.
The generated algorithm was applied to the obtained images according to the BI-RADS categorization method in order to interpret and calculate images to identify benign or malignant tumors.
[Breast ultrasonography imaging BI-RADS characteristics extracted and calculated Pattern recognition algorithm + data mining technique Breast cancer diagnosis model creation]
Five types of algorithm learning were performed using “Weka,” a java-based data mining software application. In addition, each algorithm was applied using the filtered classifier.
When using SVM, options such as Gamma and Nu values, which affect the formation of the classifier, as well as Kernel type and Normalize, were varied. A more accurate diagnosis model could be identified by comparing the values for Specificity, Sensitivity, Accuracy, Precision, and Recall obtained as results.
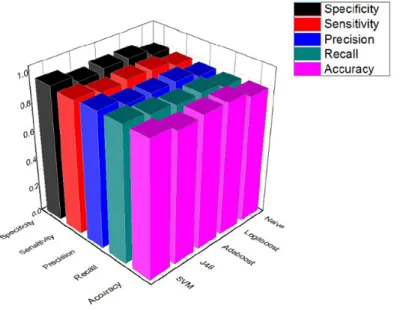
From individual images, a total of 290 BI-RADS- based characteristics were extracted, and a total of 5 types of algorithms, namely, J48, Adaboost, Logitboost, NaïveBayes, and SVM, were used in
order to determine whether the lesion was benign or malignant using the distribution of characteristic values. The category performance measured by each algorithm was compared using Specificity, Sensitivity, Precision, Recall, and Accuracy, and the results are shown in Fig. 11. According to the experiment, the performance of SVM was the highest with specificity of 95.8 %, sensitivity of 94.1 %, precision and recall of 95.7 %, and accuracy of 94.9 %. Therefore, the provided characteristics and SVM algorithm could categorize benign and malignant lesions with the highest probability in all 5 categories. Table 2 outlines the performances of the 5 algorithms.
Fig. 11. Comparison of specificity, sensitivity, precision, recall, and accuracy of lesion categorization algorithms.
Table 2. Results of algorithm execution.
SVM Adaboost Logitboost J48 Naïve Bayes
Specificity 0.958 0.921 0.92 0.917 0.891
Sensitivity 0.944 0.901 0.912 0.909 0.875
Accuracy 95.066 % 91.1272 % 91.6222 % 91.3366 % 88.3283 % Precision 0.951 0.911 0.916 0.913 0.883
Recall 0.951 0.911 0.916 0.913 0.883
Experiments showed that the best results are obtained when SVM is applied to the filtered classifier. This diagnostic model is therefore expected to diagnose breast cancer with the highest accuracy.
4. Results
This study examined an automatic analysis system for breast ultrasonography images. In order to describe the lesions detected in ultrasonography, images were interpreted, digitalized, and automatically calculated according to the BI-RADS
categorization method to study a CAD system for breast ultrasonography examination that records radiological findings and analyzes them to diagnose lesions. As a result, the suggested system could categorize a total of 4,107 breast cancer images taken between 2006 and 2010 at the Samsung Medical Center with specificity of 95.8 %, sensitivity of 94.1 %, precision and recall of 95.7 %, and accuracy of 94.9 %. The automatic ultrasonography analysis system proposed in this paper is an essential system contributing to forestalling the fatigue of physicians and enhancing diagnostic accuracy.
References
[1]. A. Jemal, R. Siegel, E. Ward, Y. Hao, J. Xu, M. J.
Thun, Cancer statistics, 2011, CA: A Cancer Journal for Clinicians, Vol. 61, Issue 2, 2011, pp. 225-249.
[2]. S. A. Feig, Effect of service screening mammography on population mortality from breast carcinoma, Cancer, Vol. 95, 2002, pp. 451–457.
[3]. V. Jackson, R. Hendrick, S. Feig, D. Kopans, Imaging of the radiographically dense breast, Radiology, Vol. 188, 1993, pp. 297-301.
[4]. K. Doi, H. MacMahon, M. L. Giger, K. R. Hoffman, Computer aided diagnosis in medical imaging, Computer-aided diagnosis and its potential impact on diagnostic radiology, Elsevier Science B V, 1999, pp. 57-59.
[5]. K. Horsch, M. L. Giger, C. J. Vyborny, L. A. Venta, Performance of computer-aided diagnosis in the interpretation of lesions on breast sonography, Acad Radiol, Vol. 11, 2004, pp. 272–280.
[6]. E. Lazarus, M. B. Mainiero, B. Schepps, S. L.
Koelliker, L. S. Livingston, BI-RADS lexicon for US and mammography: interobsever variability and
positive predictive value, Radiology, Vol. 239, 2006, pp. 385-391.
[7]. C.-M. Chen, Y.-H. Chou, K.-C. Han, C.-M. Tiu, H.-J.
Chiou, S.-Y. Chiou, Breast lesions on sonograms:
Computer-aided diagnosis with nearly setting- independent features and artificial neural networks, Radiology, Vol. 226, Issue 2, 2003, pp. 504-514.
[8]. C. T. Zhan, and R. Z. Roskies, Fourier descriptors for plane closed curves, IEEE Trans. Computers, C-21, 1972, pp. 269-281.
[9]. S. Belongie, J. Malik, J. Puzicha. Shape Matching and Object Recognition Using Shape Contexts, IEEE Trans. Pattern Anal. Mach. Intell., Vol. 24, Issue 24, 2002, pp. 509-521.
[10]. J. Otero, L. Sánchez, Induction of descriptive fuzzy classifiers with the Logitboost algorithm, Soft Computing, Vol. 10, Issue 9, pp. 825-835.
[11]. Liangxiao Jiang, Learning Instance Weighted Naïve Bayes from labeled and unlabeled data, Materials, Vol. 38, No. 1, pp. 257–268.
[12]. E. Frank, M. Hall, L. Trigg, G. Holmes, I. H. Witten, Data mining in bioinformatics using Weka, Bioinformatics Applications Note, Vol. 20, Issue 15, 2004, pp. 2479-2481.
___________________
2014 Copyright ©, International Frequency Sensor Association (IFSA) Publishing, S. L. All rights reserved.
(http://www.sensorsportal.com)