I. INTRODUCTION
With the advancement of modern technology in medicine and improvement in living environment, the average life expectancy of the elderly has increased, and we are entering
an aging society where 13.1% of the population in a country includes elderly >65 years old. An aging society is generally defined as that having over 7% elderly, and this percentage has been increasing every year in South Korea (Statistics Korea, 2015). Aging-related physiological
KJSB
http://e-kjsb.org eISSN 2093-9752ORIGINAL
Analyses of Plantar Foot Pressure and Static Balance According to the Type of Insole in the Elderly
Kang-Ho Bae1, Jin-Hyung Shin1, Joong-Sook Lee2, Jeong-Ok Yang2, Bom-Jin Lee2, Seung-Bum Park3
1Department of Physical Education, Graduate School of Silla University, Busan, Korea
2Department of Kinesiology, College of Health and Welfare, Silla University, Busan, Korea
3Footwear Biomechanics Team, Footwear Industrial Promotion Center, Busan Economic Promotion Agency, Busan, Korea
Received : 30 October 2015 Revised : 23 December 2015 Accepted : 11 March 2016
Corresponding Author Joong-Sook Lee
Department of Kinesiology, College of Health and Welfare, Silla University, 140, Baekyang- daero 700beon-gil, Sasang-gu, Busan, 46958, Korea
Tel : +82-51-999-5064 Fax : +82-51-999-5576 Email : [email protected]
Objective: The purpose of this study was to investigate plantar foot pressure and static balance according to the type of insole in the elderly.
Methods: Thirteen elderly (mean age: 67.08±2.25 years, mean height: 159.63±9.64 cm, mean body weight: 61.48±9.06 kg) who had no previous injury experience in the lower limbs and a normal gait pattern participated in this study. Three models of insoles of the normal, 3D, and triangle types were selected for the test. The Pedar-X system and Pedar- X insoles, 3.3 km/h of walking speed, and a compilation of 20 steps walking stages were used to analyze foot-pressure distribution. Static balance test was conducted using Gaitview AFA-50, and balance (opening eyes, closing eyes) was inspected for 20 s. One- way ANOVA was conducted to test the significance of the results with the three insoles.
p-value of less than .05 was considered statistically significant.
Results: The mean foot pressure under the forefoot regions was the lowest with the 3D insole during treadmill walking (p<.05). The mean value under the midfoot was the highest with the 3D insole (left: p<.05, right: p<.01). The mean value under the rearfoot was the lowest with the 3D insole (p<.001). The maximum foot pressure value under the foot regions was the lowest on both sides of the forefoot with the 3D insole. A statistically significant difference was seen only in the left foot (p<.01). The maximum value under the midfoot was the highest with the 3D insole (p<.001). No statistically significant difference was detected on the values under the rearfoot. In the case of vertical ground reaction force (GRF), statistically significant difference was seen only in the left side rearfoot (p<.01). However, static balance values (ENV, REC, RMS, Total Length, Sway velocity, and Length/ENV) did not show significant differences by the type of insole.
Conclusion: These results show that functional insoles can decrease plantar pressure and GRF under the forefoot and rearfoot. Moreover, functional insoles can dislodge the overload of the rearfoot and forefoot to the midfoot. However, functional insoles do not affect the static balance in the elderly.
Keywords: Gait, Foot plantar pressure, Ground reaction force, Static balance, Elderly
changes not only involve calcification of the tendon and ligament, but also a decrease in proprioceptive activities, resulting in decreased strength and endurance (Spirduso, Francis, Eakin, & Stanford, 2005). In addition, changes in the nervous system delays reactions to a stimulus and slows the nerve impulse transmission time, which impairs body balance (Lee, Lee, & Song, 2014). Especially, decrease in muscle strength impairs the daily activity of the elderly, which leads to a decrease in quality of life (Jette & Branch, 1981). One of the important factors that improve the quality of life in the elderly is the ability to maintain body balance, which is the most basic function for daily physical activities, and it refers to the ability to sustain stability (Cohen, Blatchly,
& Gombash, 1993; Wade & Jones, 1997).
Balance ability is considered as the most important func- tion in the elderly, as it is closely related to the risk of falls, and deterioration of vision, vestibular organ, proprioceptive organ, and the musculoskeletal system impairs balance ability (Shumway-cook & Woollacott, 1995). Furthermore, a poor balance in the elderly decreases dynamic balance ability such as gait ability due to deterioration in body balance control function, and increases the risk of falls accordingly (Province et al., 1995; Lockhart, Smith, &
Woldstad, 2005; Bird, Hill, Ball, & Williams, 2009).
Importantly, gait, the most prevalent movement activity in daily life, is very closely related to the balance ability of the elderly and directly related to the risk of falls. Lee et al. (2010) reported that when balance became unstable during gait, continuous balance adjustment was required between the lower limbs or between lower and upper limbs to maintain the stability in the elderly (Lee et al., 2010). Cromwell and Newton (2002) found that the ability of propulsion of the body was intimately related to stability, and unstable gait was caused by the functional deterio- ration of joint muscles of lower extremity (Kerrigan et al., 1998). Therefore, aging impairs the function of the lower limbs and stability during movement, which results in smaller stride and slower walking speeds, and these can be risk factors for falls in the elderly (Park, Choi, & Hwang, 2002).
When the insole or other types of support are used in shoes, the plantar pressure can be distributed, and almost normal gait can be achieved when electromyogram acti- vities and movement analysis are evaluated. Therefore,
many products have been developed to provide these benefits. Products of various designs are available, but the effects and benefits are similar, including proper posture, stability in gait, pain relief, and joint function restoration (Song, Lee, Baek, & Park, 2008). Min-Chi and Mao-Jiun (2007) reported that, when arch support was used in shoes for people who stand for long periods, a greater contact area could disperse the arch pressure. Donovan, Mary, Paul, Kirk and Michael (2007) also observed stress reduction and pressure distribution when a metatarsal pad was used.
Plantar foot pressure improved and enabled normal gait with foot orthotics (Lee, Lee, Lee, & Park, 2007). Song, Lee, Baek and Park (2008) showed that the foot pressure was distributed in the exterior of the rear-foot without foot orthotics, while the pressure distribution was observed in the center and left side of the forefoot with foot orthotics.
The results imply that foot orthotics absorbed the shock relatively well and contributed to increased propulsion.
This study attempts to investigate the plantar foot pres- sure and static balance, which are intimately related to falls and injury in the elderly, using two ways. First, the effect of the type of insole on foot pressure and the maximum vertical ground reaction force (GRF) was investigated in the elderly. Second, the effect of the type of insoles on static balance during standing in the elderly was examined. This study quantitatively measured the pressure during gait and the static balance during standing in elderly women with different types of insoles to provide necessary information for the prevention of plantar injury, such as stress fracture in the metatarsal bone or plantar fasciitis, and falls.
Therefore, with the different types of insoles, this study analyzed the mean foot pressure, maximum foot pressure, and plantar pressure distribution during treadmill walking and static balance with open and closed eyes.
II. METHODS
1. SubjectsSubjects were recruited from the lifelong education center in S University in Busan, with either heel striking or normal gait, and sensors were attached sequentially for foot pressure measurement. Subjects with low-arched foot and high-arched foot were excluded. Among subjects
with no history of lower limb injury within the last 1 year, 13 subjects met the criteria for selection.
All subjects received adequate explanations of the pur- pose of the study prior to the experiment and signed a voluntary agreement. The characteristics of subjects are shown in (Table 1).
2. Insole model
Selected normal insole contained normal cushion and shock absorption function, and the 3D insole contained a hard wedge at the foot arch for support that could relieve foot stress and foot pain, increase wearing comfort, position the heel bone to correct supination and pronation, and induce bone arrangement. An insole with a poron urethane foam in the metatarsal bone area for cushioning was selected (hardness 45, C type, peel strength 63 N/cm). A triangle insole was designed with higher external side to
promote the position of the footstep closer to the center during gait, and a U-shaped molded product of a hard material attached to the rear insole (hardness 75, C type) supported the interior and exterior foot arch and calcaneus, and thereby prevented the internal rotation by maintaining the calcaneus in a neutral position (hardness 45, C type, peel strength 63 N/cm). The shape of the normal insole, 3D insole, and triangle insole are shown in (Figure 1) below.
3. Experiment procedures and equipment The equipment used in the study is shown in (Table 2).
Table 1. General characteristics of the subjects
N
=13 Age (years)
Height (cm)
Weight (kg)
Foot length (mm)
Arch of the foot (cm)
L R L R
A 66 151.4 77.1 220 225 1.1 0.9
B 66 147.5 52.2 231 230 0.4 0.4
C 69 155.1 55.1 235 230 0.8 0.8
D 69 156.2 69.3 230 230 0.7 0.5
E 65 155.3 51.7 230 229 1 0.6
F 70 158.5 62.8 240 241 1.1 0.9
G 65 155.1 51.8 230 229 1 0.6
H 65 158.2 59.7 227 224 0.7 0.4
I 72 170.5 65.3 245 245 0.8 0.9
J 65 165.5 65.1 232 230 0.8 0.8
K 67 155.1 62.8 235 232 0.9 0.7
L 66 162.2 50.5 232 231 1 1
M 67 185.7 75.9 270 270 2 1
M 67.08 159.63 61.48 235.15 234.31 0.95 0.75 SD 2.25 9.64 9.06 12.07 12.15 0.36 0.25
Normal Triangle 3D
Figure 1. Types of insoles
Table 2. Measurement equipment Section
Measurement equipment
name
Model Purpose of use
Production companies
Measurement equipment
Body composition
analyzer
X-Scan PLUS II
Physical properties measurement
JAWON, Daejeon, Korea
Plantar pressure measurement
equipment
Pedar-x
Plantar pressure
& pressure center moving
path measurement
Novel, Munich, Germany
Digital video camera
GK-2 NTSC
Walking motion recording
Canon, Tokyo, Japan
Static balance measurement
equipment
Gaitview AFA-50
Static balance measurement
Alfoots.
Inc, Seoul, Korea
1) Measurement of plantar foot pressure during treadmill walking
When Studenski et al. (2011) measured the walking speed of 34,485 elderly over 65 years old and monitored for 6~21 years, the average walking speed of the elderly over 65 years old was 3.31 km/h (0.92±0.27 m/s), There- fore, in this study, we set the treadmill speed as 3.3 km/h after confirming that the subjects showed natural strides and their number of strides. The treadmill experiments were performed in the following order: wearing normal insole, 3D insole, and triangle insole. Three measurements were made for each subject, one every minute, and 20 con- sistent datasets were extracted for analysis. Subjects took 1 min of rest between measurements. The experimental scene is shown in (Figure 2).
When an error took place in the sensor during the experiment, the experiment was resumed after resetting the equipment and resolving the error. For the pressure measurements, the plantar region was divided into three regions, forefoot, midfoot, and rearfoot, by creating a mask as shown in (Figure 3) (Park et al., 2011), and the sensor detected the pressure per unit area. In order to objectively measure the plantar pressure by adding the pressure of each area together and utilizing Pedar-X system, mean foot pressure, maximum foot pressure, vertical GRF, and foot pressure distribution were measured.
2) Static balance test
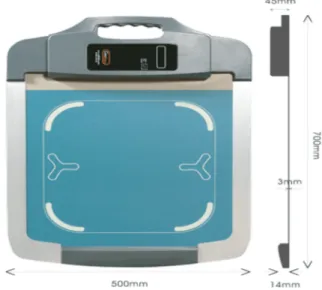
The static balance test was performed by measuring the change in the center of weight during standing for 20 s with the static balance measurement equipment as shown
in (Figure 4) in the open and closed eyes conditions. For the open eyes condition, a marker was attached to the wall 15° in front of the subject. Like the plantar pressure measurement, the experiments were performed in the following order: wearing shoes with normal insole, 3D insole, and triangle insole.
Table 2. Measurement equipment (Continued) Section
Measurement equipment
name
Model Purpose of use
Production companies
Processing unit
Plantar pressure analysis software
Pedar-x Recorder
Pressure data analysis
Novel, Munich, Germany
Laptop Xnote
LPG1 Data analysis LG, Seoul, Korea
Figure 2. Pedar-X setting and test scene
Figure 3. The division of the plantar region
4. Data analysis
The average value from the three measurements made with natural gait was used, and the plantar pressure of 20 walking steps from each foot were used in case of one time measurement, using the software provided with the Pedar-X system. For statistical analysis, data from the fore- foot, midfoot, and rearfoot, for each subject were analyzed, and the mean foot pressure, maximum foot pressure, and
vertical GRF were calculated for each type of insole. The maximum vertical GRF was normalized by dividing the measured values by the weight of each subject.
For the data from the static balance test, ENV (envelope area), REC (rectangle area), RMS (root mean square area), Total Length (total trajectory length), Sway velocity (Cop speed), and Length/ENV (Length per unit envelope area) were analyzed. The statistical analysis was performed by SPSS Ver. 23.0 statistical software using One-way ANOVA with Tukey post-hoc test, and the statistical significance was set at α=.05.
III. RESULTS
The analyzed data from the foot pressure measurements during treadmill walking and static balance test during standing were as follows:
1. The mean foot pressure
The mean foot pressure analyzed by the software pro- vided with the Pedar-X system at walking speed of 3.3 km/h for each type of insole is shown in (Table 3). The highest mean foot pressure was observed in the left fore- foot region with the normal insole (110.05±15.17 kPa), while the lowest mean foot pressure was observed with the 3D insole (100.01±15.99 kPa) with statistical significance
Table 3. Mean plantar pressure with the normal, 3D, and triangle insoles (unit: kPa)
Section Normal (A) 3D (B) Triangle (C)
F p Post-hoc
M ± SD M ± SD M ± SD
Fore foot
Left 110.05±15.17 100.01±15.99 107.09±22.19 3.182 .045* A>B
Right 111.71±19.30 106.34±15.40 112.31±20.42 1.232 .295
Mid foot
Left 67.71±13.18 63.72±10.08 70.89±13.77 3.248 .042* C>B
Right 64.83±10.31 63.14±7.78 70.76±10.79 6.606 .002** C>A
C>B
Rear foot
Left 112.13±14.71 94.94±17.04 97.73±19.80 11.071 .000*** A>B
A>C
Right 112.44±15.51 96.11±15.97 101.44±19.42 9.304 .000*** A>B A>C
*p<.05, **p<.01, ***p<.001 Figure 4. Gaitview AFA-50
(p<.05). In the case of the right forefoot region, the highest mean foot pressure was observed with the normal insole (111.71±19.30 kPa), and the lowest mean foot pressure was observed with the 3D insole (106.34±15.40 kPa), but no statistical significance was found between the two.
In the case of the midfoot region, the lowest foot pres- sure was observed with the 3D insole in both left and right feet (p<.05 and p<.01, respectively), followed by the normal insole, and triangle insole in the order of increasing mean foot pressure.
In the case of the rearfoot region, the order of the mean foot pressure was normal insole > triangle insole >
3D insole (p<.001).
2. The maximum foot pressure
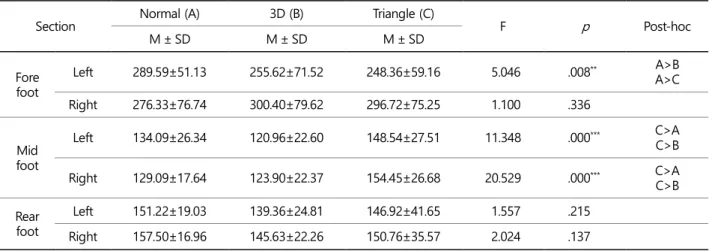
The maximum foot pressure analyzed by the software provided with the Pedar-X system at a walking speed of 3.3 km/h for each type of insole is shown in (Table 4).
The left forefoot region with the normal insole showed the highest maximum foot pressure (289.59±51.13 kPa;
p<.01). The right forefoot region with the 3D insole showed the highest maximum foot pressure (300.40±79.62 kPa) without statistical significance. In the case of the midfoot region, the highest maximum foot pressure was observed with the 3D insole in both left and right feet (120.96±
22.60 kPa, and 123.90±22.37 kPa, respectively), and the highest maximum pressure was observed with the triangle
insole in both left and right feet (148.54±27.51 kPa and 154.45± 26.68 kPa, respectively; p<.001). In the case of the rearfoot region, the order of the maximum foot pres- sure was 3D insole < triangle insole < normal insole, but without statistical significance.
3. The maximum vertical ground reaction force
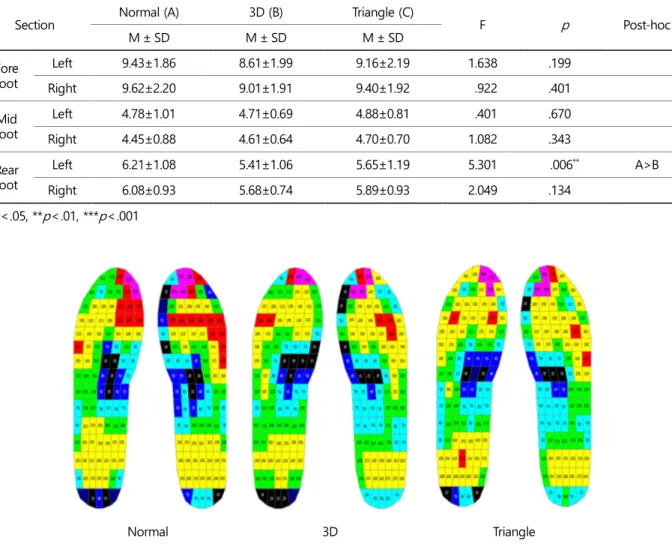
The result of the maximum vertical GRF analyzed by the software provided with the Pedar-X system at walking speed of 3.3 km/h for each type of insole after normal- ization by the weight of each subject is shown in (Table 5). The highest GRF was observed in the forefoot region in both left and right feet with the normal insole (9.43±
1.86 N/kg and 9.62±2.20 N/kg, respectively), and the lowest GRF was observed in the forefoot region in both left and right feet with the 3D insole (8.61±1.99 N/kg and 9.01±
1.91 N/kg, respectively), but without statistical significance.
In the case of the midfoot region, the highest GRF was observed in both left and right feet with the triangle in- sole (4.88±0.81 N/kg and 4.70±0.70 N/kg, respectively), but without statistical significance. In the case of the left rearfoot region, the lowest GRF was observed with the 3D insole (5.41±1.06 N/kg), and the highest GRF was observed with the normal insole (6.21±1.08 N/kg; p<.01).
Table 4. Maximum plantar pressure with the normal, 3D, and triangle insoles (unit: kPa)
Section Normal (A) 3D (B) Triangle (C)
F p Post-hoc
M ± SD M ± SD M ± SD
Fore foot
Left 289.59±51.13 255.62±71.52 248.36±59.16 5.046 .008** A>B
A>C
Right 276.33±76.74 300.40±79.62 296.72±75.25 1.100 .336
Mid foot
Left 134.09±26.34 120.96±22.60 148.54±27.51 11.348 .000*** C>A
C>B
Right 129.09±17.64 123.90±22.37 154.45±26.68 20.529 .000*** C>A C>B Rear
foot
Left 151.22±19.03 139.36±24.81 146.92±41.65 1.557 .215
Right 157.50±16.96 145.63±22.26 150.76±35.57 2.024 .137
*p<.05, **p<.01, ***p<.001
4. The foot-pressure distribution per region
The foot-pressure distribution analyzed by the software provided with the Pedar-X system at walking speed of 3.3 km/h for each type of insole is shown in (Figure 5). The red color indicates the region with high foot pressure.
Compared to the normal insole, the 3D insole and triangle insole substantially decreased the excessive foot pressure in the forefoot region and provided a uniform distribution of the foot pressure overall.
5. The static balance test during standing The results of the weight center change during standing
measured by static balance measurement equipment for 20 sec in both open eyes and closed eyes conditions are summarized in (Table 6) and (Table 7), respectively.
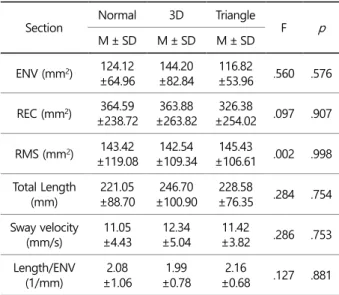
When the measured data was compared among the types of insoles in each section, for ENV, REC, RMS, Total Length, Sway velocity, and Length/ENV, no statistical signifi- cance differences were found. A larger value of length/
ENV can be considered to be more stable in sway, and it showed the highest value with the triangle insole in the open eyes condition (2.16±0.68 1/mm), but showed the lowest static balance value in the closed eyes condition (1.86±0.54 1/mm).
Table 5. Maximum vertical GRF with the normal, 3D, and triangle insoles (unit: N/kg)
Section Normal (A) 3D (B) Triangle (C)
F p Post-hoc
M ± SD M ± SD M ± SD
Fore foot
Left 9.43±1.86 8.61±1.99 9.16±2.19 1.638 .199
Right 9.62±2.20 9.01±1.91 9.40±1.92 .922 .401
Mid foot
Left 4.78±1.01 4.71±0.69 4.88±0.81 .401 .670
Right 4.45±0.88 4.61±0.64 4.70±0.70 1.082 .343
Rear foot
Left 6.21±1.08 5.41±1.06 5.65±1.19 5.301 .006** A>B
Right 6.08±0.93 5.68±0.74 5.89±0.93 2.049 .134
*p<.05, **p<.01, ***p<.001
Normal 3D Triangle Figure 5. Distribution of plantar pressure with different types of insoles
IV. DISCUSSION
1. The mean foot pressureAn insole is directly inserted into the shoes and enhances the wearing comfort by protecting the foot from shock.
Moreover, it has been reported that the insole prevents flattening of arch during movement or walking by min- imizing the gap during the contact at different heights of the foot arch (Kogler, Solommidis & Paul, 1995). Park et al. (2011) reported that the functional insoles could relieve foot stress by increasing the contact area of the sole, com- pared to a normal insole. However, Nigg (2001) suggested that a shock-absorbing insole could reduce the risk of injury, but might not reduce the risk of fracture. Jo (2004) analyzed the plantar pressure with five type of insoles made of different materials and found that Arufoam could absorb shock in the rearfoot region, x2 well dispersed the shock, and Plastazote could disperse the pressure near the toe. Woo et al. (2015) reported low plantar pressure and GRF in both forefoot and rearfoot regions with functional insoles, and Lee (2011) observed a reduction in the plantar pressure in the interior rearfoot region with increasing angle of the interior foot arch. Kim (2011) found that a higher angle of the insole in the rearfoot region could better disperse the foot pressure, but without statistical signifi- cance. Kim (2008) reported an increase in the hardness of the insole could better absorb shock, and triangle insole and especially, the 3D insole, showed substantial decrease in the plantar pressure in the forefoot region and rearfoot region,. The decrease in the foot pressure was more pro- minent with the 3D insole, and the triangle insole, which supports the interior foot arch, could disperse the high foot pressure in the forefoot and rearfoot regions by in- creasing the foot pressure in the midfoot region. These results agree with previous studies in the literature. This study showed that two functional insoles resulted in a lower mean foot pressure in both the forefoot and rearfoot regions than a normal insole. Therefore, the functional insole is considered protective for the foot by distributing the foot pressure.
2. The maximum foot pressure and vertical GRF
The human body receives the impact force from the ground during movement, such as walking or running. This force is transmitted to the body via the foot and can act as a stress on tendons and ligaments. The repeated and excessive stress to the body can potentially cause injuries, such as back pain (Wosk & Voloshin, 1982) or stress frac- Table 7. Balance with closed eyes with the normal, 3D, and
triangle insoles
Section Normal 3D Triangle
F p
M ± SD M ± SD M ± SD
ENV (mm2) 173.56
±104.53
174.38
±108.83
184.56
±85.84 .046 .955
REC (mm2) 383.38
±213.46
470.45
±301.05
537.03
±335.00 .932 .403
RMS (mm2) 148.66
±109.07
209.62
±168.39
227.10
±165.38 .978 .386 Total Length
(mm)
291.28
±100.35
304.84
±103.38
310.52
±120.98 .108 .898 Sway velocity
(mm/s)
14.55
±5.01
15.24
±5.18
15.52
±6.04 .111 .895 Length/ENV
(1/mm)
2.01
±1.06
2.01
±0.65
1.86
±0.54 .168 .846
*p<.05, **p<.01, ***p<.001
Table 6. Balance with open eyes with the normal, 3D, and triangle insoles
Section
Normal 3D Triangle
F p
M ± SD M ± SD M ± SD
ENV (mm2) 124.12
±64.96
144.20
±82.84
116.82
±53.96 .560 .576
REC (mm2) 364.59
±238.72
363.88
±263.82
326.38
±254.02 .097 .907
RMS (mm2) 143.42
±119.08
142.54
±109.34
145.43
±106.61 .002 .998 Total Length
(mm)
221.05
±88.70
246.70
±100.90
228.58
±76.35 .284 .754 Sway velocity
(mm/s)
11.05
±4.43
12.34
±5.04
11.42
±3.82 .286 .753 Length/ENV
(1/mm)
2.08
±1.06
1.99
±0.78
2.16
±0.68 .127 .881
*p<.05, **p<.01, ***p<.001
ture (Milgrom, 1985). Meanwhile, the elasticity and strength of the muscle could decrease greatly in the elderly, because of deterioration with age. Therefore, their susceptible body leads to an increase in the risk of injury even if the amount of stress is not excessive. The benefits of foot orthotics or insole can be classified into two types: one by uniformly distributing the pressure throughout the sole, such that a specific region with high foot pressure can be relieved (Jin, 2007), and another, by repositioning and supporting the foot in an ideal position (Hunter, Dolan, & Davis, 1995).
Moreover, Song (2008) mentioned that foot orthotics could be used for foot arrangement, foot support, prevention, and correction of foot deformity, and enhancement of foot function. Foot orthotics is used to decrease the vertical impact and to prevent excessive supination and pronation, which are the basic causes of the lower limb injury, and according to several studies (Gross et al., 1993; Kang, 2008;
Lee, 2010; Hyung, 2008). The movement across the coronal plane in the calcaneus has been considered as an impor- tant indicator for the pronation of foot, and the most impor- tant purpose of an insole treatment is to control the ex- cessive foot pronation. The excessive movement in the rearfoot region and abnormal lower leg alignment are closely related to lower limb injury.
These previous studies suggest that it is preferable to reduce the impact in walking by decreasing the maximum plantar pressure and maximum vertical GRF, and our study showed that the maximum plantar pressure and maximum vertical GRF were lower with the 3D insole or triangle insole than with the normal insole in both left and right feet. Therefore, our results suggest that the functional in- soles can more significantly reduce the risk of lower limb damage and injury from excessive load during movement in the elderly by decreasing the impact on the sole than the normal insole.
3. The foot-pressure distribution per region
Repeated shock in the foot has been reported to in- crease the risk of injury (Olsen, Myblebust, Engebrestsen,
& Bahr, 2004; Hootman, Dick, & Agel, 2007; Woo et al., 2015). Therefore, previous studies suggest that concen- trating the foot pressure onto one region during walking is not appropriate due to increased overload. When the
foot pressure distribution was visualized by color, it was found that the foot-pressure was more dispersed with the 3D insole or triangle insole when compared to the normal insole, especially in the forefoot region. Particularly, the red and purple distribution shown in (Figure 4) was not considered appropriate as the overload was concentrated on one region, and similar distribution was observed with the normal insole. Especially, the elderly are more suscep- tible to overload than those in their middle age, so the functional insole will allow the elderly to walk with a more uniform gait.
4. The static balance test during standing
Previous research has utilized a force platform in standing to study the change of the center of pressure and corre- lated it with the balance ability. Yoon, Park and Kim (2002) reported that the weight-bearing ratio was significantly increased when the shoes were elevated by 10 mm in the affected side, and Hong (2003) observed a significant change in the balancing ability when the lateral wedge insole was used in the paralyzed side shoe in patients with hemiplegia during exercise training. In addition, Jin (2007) found an increased balancing ability of the front, back, left, and right side when the subjects received custom orthotics during a 10-week walking exercise. Yang (2013) studied the static balance during standing in 30 high school students with socks, insole, and shoes to raise their height, and found the best balancing ability with the barefoot followed by shoes with insoles. This study examined the change in the center of pressure during 20 s of standing with open eyes or closed eyes, and no statistical significant difference was observed between the normal insole and functional insoles, which did not agree with previous study results.
Winter (1995) suggested that the forward or backward movement of the center of pressure during standing was controlled by the dorsiflexor or plantar flexors. Therefore, when measuring the static balance with foot orthotics or functional insoles without enough acclimatization and training period, these contributed little to the activation of dorsiflexor muscles in the elderly during standing.
V. CONCLUSION
The study aimed to investigate the effect of the normal insole (2 dimensional insole), 3D insole, and triangle insole on the plantar pressure and static balance during standing in the elderly. Thirteen elderly subjects over 65 years old were selected, and the mean plantar pressure, maximum plantar pressure, and maximum vertical GRF were meas- ured by Pedar-X system at walking speed of 3.3 km/h, and the change in the center of pressure was measured with open eyes or closed eyes for 20 sec for the static balance test. The analysis of the plantar pressure results showed that the two types of functional insoles lowered the mean plantar pressure and maximum plantar pressure, and GRF in both forefoot and rearfoot regions, when compared to the normal insole. Lower mean plantar pressure, maximum plantar pressure, and vertical GRF result in lower pressure and shock on the foot, and hence, functional insoles are expected to decrease the risk of lower limb injury during walking.
No statistical significance was observed in the static balance test during standing in the elderly with the func- tional insoles. Based on previous studies, other methods could be utilized in the future studies to evaluate the balancing ability.
The results from the study are expected to assist in gait training of musculoskeletal and neurological patients, and to build basic scientific data for the development of in- soles that can more effectively prevent foot injury and falls in the elderly during treadmill walking.
The currently available foot orthotics and insoles are usually replicated from existing foreign models, and their efficacy needs to be verified scientifically. Therefore, in order to develop or apply new products for gait training, the commercial products have to be examined and validated through various methods from an ergonomic viewpoint.
ACKNOWLEDGEMENTS
This work was supported by the Brain Busan 21 Project in 2016.
REFERENCES
Bird, M. L., Hill, K., Ball, M. & Williams, A. D. (2009). Effects of resistance and flexibility exercise interventions on balance and related measures in older adults. Journal of Aging and Physical Activity,17(4), 444-454.
Cohen, H., Blatchly, C. A. & Gombash, L. L. (1993). A study of the clinical test of sensory interaction and balance.
Physical Therapy, 73(6), 346-351.
Cromwell, R. L. & Newton, R. A. (2002). Forrest G. Influence of vision on head stabilization strategies in old. The Journals of Gerontology, 57(7), 442-448.
Donovan, J. L., Mary, K. H., Paul, K. C., Kirk, E. S. & Michael, J. M. (2007). Effect of footwear and orthotic devices on stress or eduction and soft tissue strain of the neuropathic foot. Clinical Biomechanics, 22, 352-359.
Gross, M. L. & Napoli, R. C. (1993). Treatment of lower extremity injuries with orthotics shoe insert. Sports Medicine, 15, 69-70.
Hong, D. S. (2003). A Study on Effect of Therapeutic Exercise through Lifting a paralyzed side Shoe upon Balancing Ability of Hemiplegic Patients. Unpublished master's thesis, Graduate School of Korea University.
Hootman, J. M., Dick, R. & Agel, J. (2007). Epidemiology of collegiate injuries for 15 sports: summary and recom- mendations for injury prevention initiatives. Journal of Athletic Training, 42(2), 311-319.
Hunter, S., Dolan, M. G. & Davis, M. (1995). Foot Orthotics in Therapy and Sport. Champaign, Human Kinetics.
Hyung, I. H. (2008). The effect of Balance and Muscle Acti- vities on the Stability of Foot. Unpublished doctoral dissertation, Graduate School of Daegu University.
Jette, A. M. & Branch, L. G. (1981). The framingham dis- ability study: II. Physical disability among the aging.
American Journal of Public Health, 71(11), 1211-1216.
Jin, S. H. (2007). The Effects of Custom Orthotics on Foot Biomechanics, Posture, Pressure, Balance, and Pain.
Unpublished master's thesis, Graduate School of Ewha Womans University.
Joo, C. I. (2004). Study on the Measurements of Plantar Foot Pressure Distribution for understanding Charac- teristics of Insole Materials: Focused on the Insole Materials in Footwear. Unpublished master's thesis, Graduate School of Korea University of Technology and
Education.
Kang, H. J. (2008). The Effect of a Customized Insole for High Arched Patients with Hind foot Supination. Un- published master's thesis, Graduate School of Yonsei University.
Kerrigan, D. C., Todd, M. K., Della Croce, U., Lipsitz, L. A. &
Collins, J. J. (1998). Biomechanical gait alterations in- dependent of speed in the healthy elderly: Evidence for specific limiting impairments. Archives of Physical Medicine and Rehabilitation, 79(3), 317-322.
Kim, C. S. (2008). A Study On the EVA Material Hardness Effect to the Balance and Cushion in Case of Standing and Walking. Unpublished master's thesis, Graduate School of Dongseo University.
Kim, K. H. (2011). Biomechanical Analysis of Arch Supprot Devices on Normal and Low Arch. Unpublished master's thesis, Graduate School of Kyungsung University.
Kogler, G. F., Solomnidis, S. E. & Paul, J. P. (1995). Invitro method for quantifying the effectiveness of the long- itudinal arch support mechanism of the orthoses.
Clinical Biomechanics, 10(5), 245-252.
Lee, H. J., Song, C. H., Lee, K. J., Lee, Y. W., Lee, G. C., Shin, W. S. & Lee, S. W. (2010). The effects of complex ex- ercise training for lower legs muscle strength, muscle endurance, balance ability and gait ability in the elderly.
Journal of Sport and Leisure Studies, 41(2), 935-947.
Lee, H. K., Lee, J. C. & Song, G. H. (2014). The effects of rhythmic sensorimotor training in unstable surface on balance ability of elderly women. Journal of the Korean Academy of Family Medicine, 9(2), 181-191.
Lee, H. T. (2010). The Effect of the Wedge Insole Angle of Supinated Group on Foot Contact Time, Foot Contact Area and Foot Pressure While Walking. Unpublished master's thesis, Graduate School of Pukyong National University.
Lee, J. H., Lee, Y. S., Lee, J. O. & Park, S. H. (2007). Bio- mechanical gait analysis and simulation on the normal, cavus and flat foot with orthotics. Journal of Mech- anical Science and Technology, 31(11), 1115-1123.
Lee, J. I. (2011). The Effect of Wedge insole of Pronated Group on Maximum Force. Unpublished master's thesis, Graduate School of Pukyong National University.
Lockhart, T. E., Smith, J. L. & Woldstad, J. C. (2005). Effects of aging on the biomechanics of slips and falls. Human
Factors, 47(4), 708-729.
Milgrom, C., Giladi, M., Kashtan, H., Simkin, A., Chisin, R., Margulies, J., Steinberg, R., Aharonson, Z. & Stein, M.
(1985). A Prospective study of the effect of a shock- absorbing orthotic device on the incidence of stress fractures in military recruits. Foot & Ankle, 6, 101-14.
Min-Chi, C. & Mao-Jiun, J. W. (2007). Professional footwear evaluation for clinical nurses. Applied Ergonomics, 38, 133-141.
Nigg, B. M. (2001). The role of impact forces and foot pronation: A new paradigm. Clinical Journal of Sport Medicine. 11, 2-9.
Olsen, O. E., Myblebust, G., Engebresten, L. & Bahr, R. (2004).
Injury mechanism for anterior cruciate ligament in- juries in team handball. American Journal of Sports Medicine, 32(4), 1002-1012.
Park, J. S., Choi, E. Y. & Hwang, T. Y. (2002). The effects of strengthening leg Muscular strength on the elderly's walking and balance ability. The Journal of Korean Society of Physical Therapy, 14(2), 71-79.
Park, S. B., Lee, K. D., Kim, D. W., Ryu, J. H. & Kim, K. H.
(2011). Comparative analysis of foot pressure distri- bution by functional Insole to be transformed and restored during walking. Korean Journal of Sport Bio- mechanics, 21(2), 231-241.
Province, M. A., Hadley, E. C., Hornbrook, M. C., Lipsitz, L. A., Miller, P., Mulrow, C. D., Ory, M. G., Sattin, R. W., Tinetti, M. E. & Wolf, S. L. (1995). The effects of exercise on falls in elderly patients. The Journal of the American Medical Association, 273(17), 1341-1347.
Shumway-cook, A.,& Woollacott, M. H. (1995). Motor Control; Theory and Practical Applications. Baltimore, Williams & Wilkin.
Song, J. H. (2008). The Kinematic comparative study about effects of foot orthotics. Korean Journal of Sport Science, 19(3), 11-21.
Song, J. H., Lee, S. H., Baek, J. H. & Park, J. H. (2008). The influence kinetic variables of the foot orthotics wearing.
Korean Journal of Sport Science, 19(4), 55-63.
Spirduso, W. W., Francis, K., Eakin, T. & Stanford, C. (2005).
Quantification of manual force control and tremor.
Journal of Motor Behavior, 37(3), 197-210.
Statistics Korea (2015). 2015 Elderly Demographics. from http://kostat.go.kr.
Studenski, S., Perera, S., Patel, K., Rosano, C., Faulkner, K., Inzitari, M. (2011). Gait speed and survival in older adults. JAMA, 305(1), 50-58.
Wade, M. G. & Jones, G. (1997). The role of vision and spatial orientation in the maintenance of posture.
Physical Therapy, 77(6), 619-628.
Winter, D. A. (1995). Human balance and posture control during standing and walking. Gait Posture. 3(4), 193- 214.
Woo, J. H., Lee, J. S., Yang, J. O., Lee, B. J., Han, D. W., Bae, K.
H., Park, S. M. & Bae, J. W. (2015). Analysis of plantar foot pressure according to 2D & 3D insole types during treadmill gait. Korean Journal of Sport Bio-
mechanics, 25(1), 113-122.
Wosk, J. & Voloshin, A. (1982). An in vivo study of low back pain and shock absorption in the human loco- motor system. Journal of Biomechanics, 15, 21-27.
Yang, S. M. (2013). The Effects of the Balance among the increasing Hight Shoes, Socks and Insoles in Men. Un- published master's thesis, Graduate School of Catholic University of Daegu.
Yoon, J. K., Park, J. M. & Kim, J. M. (2002). The effect of shoe lift of the paretic limb on gait patterns in hemiplegics.
The Journal of Korean Society of Physical Therapy, 9(2), 83-96.