논문 2010-5-8
Decision Tree를 이용한 효과적인 유방암 진단
Effective Diagnostic Method Of Breast Cancer Data Using Decision Tree
정용규*, 이승호**, 성호중***
Yong-Gyu Jung, Seung-Ho Lee and Ho Joong Sung
요 약 최근 의료분야에서는 대규모의 데이터를 빠르게 검색 및 추출이 가능하게 의사결정트리 기법에 대한 연구들 이 진행되고 있다
.
현재CART, C4.5, CHAID
등 여러 기법이 개발되었는데,
이러한 클레시파이 기법들은 몇몇 의사 결정 나무 알고리즘이 이진분리로 분류를 하는데,
나머지 데이터의 결과가 손실될 우려가 있다.
그중C4.5
는 엔트로 피의 측정값에 높고 낮음으로 트리 모양을 구성해 가는 방식이고, CART
알고리즘은 엔트로피 매트릭스를 사용하여 범주형 자료나 연속형 자료에 적용할수가 있다.
이에 본 논문에서는 클래시파이 기법 중C4.5
와CART
를 유방암 환 자 데이터에 대해 적용하여 실험하여,
그 결과 분석을 통한 성능 평가를 수행하였다.
실험에서는 교차검증을 통해 그 결과에 대한 정확성을 측정하였다.
Abstract Recently, decision tree techniques have been studied in terms of quick searching and extracting of massive data in medical fields. Although many different techniques have been developed such as CART, C4.5 and CHAID which are belong to a pie in Clermont decision tree classification algorithm, those methods can jeopardize remained data by the binary method during procedures. In brief, C4.5 method composes a decision tree by entropy levels. In contrast, CART method does by entropy matrix in categorical or continuous data.
Therefore, we compared C4.5 and CART methods which were belong to a same pie using breast cancer data to evaluate their performance respectively. To convince data accuracy, we performed cross-validation of results in this paper.
Key Words : CART, C4.5, Breast, Cancer
*종신회원, 을지대학교 의료IT마케팅학과
**정회원, 을지대학교 의료산업학부 의료전산학전공
***정회원, 을지대학교 임상병리학과 (교신저자) 접수일자 2010.9.23 수정일자 2010.10.8 게재확정일자 2010.10.15
I. Introduction
Regarding collect the massive data of symptoms and medical conditions of patients in medical fields, data mining techniques have been studied extensively in these days. In terms of data mining, it has been developed in various ways such as a significant
correlation analysis, a decision tree, a clustering and a
neural network. Among those developed techniques, a
classification method is well known to compose
classification models based on characterization of past
data, and predicts the class of new data by
pre-classification. Although this method has been used
frequently, it has been suffered from several weak
points that this method is insufficient to manage
continuous data, sensitive to data size and slower than
other methods. Therefore, we improved the accuracy
using C4.5 and CART methods. Using same data, we
confirmed the result by cross-validation of both methods. Concerning C4.5 method, this algorithm composes a tree by entropy levels under a certain condition. In contrast, CART method builds multiple candidate trees and selects the best optimized tree to find better results. In our study, we recruited a 10-fold cross-validation method to evaluate results and compared the performance between C4.5 and CART.
II. Related research
1. C4.5 Algorithm
C4.5 algorithm is developed by J. Edited and Ross Quinlan decision algorithm. This subversion of the initial ID3 (Interactive Dichotomizer) machine learning algorithms gave a lot of areas. CART in the two won each section is divided and separated form the rigid structure of the tree against the C4.5 is a continuous predictor variables with regard to separation, but with regard to nominal predictor variables for each category, the Dodge has a separate one of the words structure consists of a tree. C4.5 decision tree to form the first time to perform the operation divide and conquer is.
Enter the training set to be divided into successful, all belonging to the Class of a sub-set of the trees until they are configured to form. C4.5 information uses the concept. p is a message when the trial balloon, is delivered to the Message Information is measured in a-log2p. For examsae, messages with the same a-lbability 8 (Equally P-lbable Message), if any, of the Information, is a message. It happepepepea small a-lbability of a message in order to know the more it means that more information is needed. S is a set of Case to select at random a Case, the Case Cj belong to the probability that follows.
(1)
Here, |S| is belonging to a number of Case and, freq
(Cj, S) belongs to Cj in the set S is the number of Case. Therefore, the information passed to Case (Information) is as follows.
(2)
Gain an existing ID3 algorithm to select a test to the maximum which in this case, a large number of categories of variables that caused the problem is a serious bias. For example, for each Terminal Node contains only one Case, and Case are all being assigned to the probability of a separation variable suppose. In this case, info x (T) = 0 will be. Therefore, using some variables than would be the maximum Information Gain. However, this separation does not mean that at all. So, as far as T belongs to Case Subset (Class instead) define (Identify) the average amount of information needed (Split Info) normalization (Normalize) may be necessary to.
2. CART Algorithm
ID3 approach and the same, but the selection criteria for the property as opposed to using the change of entropy entropy matrix is used. The strengths of the candidate trees to create more than one of them to find the best way is to use wood.
Gini Index (discrete variables applied if the goal), reduction of variance (continuous target variable is applicable) by using the binary separation begin to have the entire dataset, two child node of the repeated node to generate all predictor variables using a subset of the data set to generate a decision tree is seperated.
If a child node called one of the gini index b can be expressed as follows
[3].
(3)
In this equation, r represents the number of
categories of the target variable P (i) the probability of
a given material to be classified in the category of
shows i.
III. Wisconsin Breast Cancer
In modern society, cancer incidence has a long incubation period of time, it is very difficult to determine if it was cancer. In addition, to devote his time to determine the presence or absence of cancer the best hospitals and doctors should be examined to see you are gonna be a hassle. Until then, go to the hospital to know whether the disease is that nothing.
So, by your own state if only the data that can be tested in advance to be able to do prevention, cancer incidence will be able to reduce the number of.
This paper Cancer self-diagnosis of breast cancer patients to determine the standard of cancer based on data for the Class attribute benign (benign) and malignant (malignant), let's bring the results to two pies at Clermont were analyzed by applying . Them,
"Cell_ Size_Uniformity" whether the infection in relation to target Class property Cart and C4.5 algorithm performed by applying a pie in the class were performance evaluation techniques.
IV. Experiments and experimental results
1. Experimental data
The data used in this experiment include "Wisconsin Breast Cancer Database" be collected from the Breast-w.arff use the material and experimental tool WEKA v3.7.1
[4]was used.
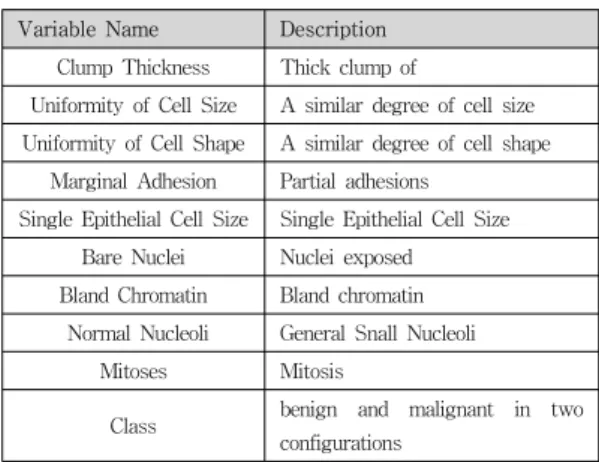
Experimental data Clump_Thickness, Cell_Size_Uniformity, Cell_Shape_Uniformity and clinical practice physician Dr. Wolbert sample properties of the report is organized into 11. The data used in this experiment the total numbered 699, for details on each of the properties shown in Table 1.
[5]Variable Name Description
Clump Thickness Thick clump of
Uniformity of Cell Size A similar degree of cell size Uniformity of Cell Shape A similar degree of cell shape
Marginal Adhesion Partial adhesions Single Epithelial Cell Size Single Epithelial Cell Size
Bare Nuclei Nuclei exposed Bland Chromatin Bland chromatin Normal Nucleoli General Snall Nucleoli
Mitoses Mitosis
Class benign and malignant in two configurations
표 1. 실험데이터의 속성
Table 1. experimental property data
Resulting from the operation of the experimental data collected to determine for the treatment of benign and malignant way of Validation Set of training data, or averages are available, and. Validation Set In this experiment, using a value between benign and malignant processes were carried out to determine.
2. Experimental results
Breast-w.arff experimental data is based on the C4.5 algorithm and Cart pie method has been applied at the class, 10-folds CV to be seen through the increased reliability was performed. Table 2 and Table 3 for each algorithm, the simulation results showed, CART and C4.5 for Class of benign and malignant were classified as clean as the average.
Rate TP FP
Rate Precision Recall F-Measure ROC Area Class 0.9151 0.126 0.9275 0.9151 0.9203 0.8824 benign
0.874 0.085 0.8689 0.874 0.8702 0.8825 malignant Weighted
Avg. 0.9086 0.1194 0.9102 0.9086 0.9084 0.8824
표 2. CART를 적용한 10회 평균 실험결과Table 2. The average test results apply CART
In Table 2, respectively, per 70 separate verification
data to the data using the CART algorithm, made a
total of 10 times the average result is brought results.
TP Rate benign values of the calculated values between malignant 0.9151, about 0.041 to 0.874 and showed a difference in degree, Weighted Avg. That was about 0.9086. Class test positive in approximately 91% of which is semantically the occasion, about 12%
do not fit. Include approximately 87% malignant, although semantically match is determined, approximately 8% was not right there. Each taking a weighted average value of about 90% when semantically correct, here comes out does not match value is approximately 11%.
Correctly Classified Instances 63.5 0.90844%
Incorrectly Classified Instances 6.4 0.09156%
Kappa statistic 0.79087
Mean absolute error 0.11615
Root mean squared error 0.27518
Relative absolute error 26.279%
Root relative squared error 59.2285%
Total Number of Instances 69.9
표 3. CART를 적용한 10회 결과 요약Table 3. Summary of results in applying CART
Table 3 is summary of 10 fold cross validation results. The total value of the instance is 69.9. It correctly classified 63.5 values and instances to be about 90%, incorrectly classified instances is about 9%
value is 6.4.
a b <-- classified as
42.4 3.4 a = benign
3 21.1 b = malignant
표 4. CART의 Confusion Matrix Table 4. CART Confusion Matrix.
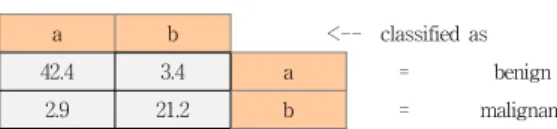
Table 4 as a matrix to classify benign and malignant category names a and b. Side a from a higher portion is to be regarded as positive and b side is found to be malignant is higher.
TP
Rate FP
Rate Precision Recall F-Measure ROC Area Class 0.9194 0.1236 0.9316 0.9194 0.9249 0.8896 benign 0.8764 0.0806 0.8546 0.8764 0.8647 0.8896 malignant Weighte
d Avg. 0.9101 0.1139 0.9115 0.9101 0.9101 0.8896
표 5. C4.5를 적용한 10회 평균 실험결과Table 5. C4.5 applied 10 times the average experimental results
Table 5 in the same conditions, a total of 10 times by applying the C4.5 algorithm is the result of experiments done, CART as well as malignant TP Rate is between the values of the benign 0.9194, 0.8764 difference of approximately 0.073 showed, Weighted Avg. that was about 0.9101.
CART algorithm and there is no significant difference when compared. More semantically correct values were higher. The CART algorithm and C4.5 algorithm using binary tree classification technique is used to quickly perform operations with the same purpose, because very similar results would represent.
Correctly Classified Instances 63.6 0.90987%
Incorrectly Classified Instances 6.3 0.09013%
Kappa statistic 0.78968
Mean absolute error 0.1073
Root mean squared error 0.28659
Relative absolute error 24.691%
Root relative squared error 62.3857%
Total Number of Instances 69.9
표 6. C4.5를 적용한 10회 결과 요약Table 6. Summary of results in applying the C4.5
The total value of an instance of a summary value
from 69.9 to 63.6 or about 90 percent were classified
into the correct instance, 6.3, or about 9 percent were
classified as an invalid instance.
a b <-- classified as
42.4 3.4 a = benign
2.9 21.2 b = malignant
표 7. C4.5의 Confusion Matrix Table 7. C4.5의 Confusion Matrix