P R O C E E D I N G S
Open Access
Multivariate classification of urine metabolome
profiles for breast cancer diagnosis
Younghoon Kim
1, Imhoi Koo
2, Byung Hwa Jung
3, Bong Chul Chung
3, Doheon Lee
1*From Third International Workshop on Data and Text Mining in Bioinformatics (DTMBio) 2009
Hong Kong. 6 November 2009
Abstract
Background: Diagnosis techniques using urine are non-invasive, inexpensive, and easy to perform in clinical settings. The metabolites in urine, as the end products of cellular processes, are closely linked to phenotypes. Therefore, urine metabolome is very useful in marker discoveries and clinical applications. However, only univariate methods have been used in classification studies using urine metabolome. Since multiple genes or proteins would be involved in developments of complex diseases such as breast cancer, multiple compounds including
metabolites would be related with the complex diseases, and multivariate methods would be needed to identify those multiple metabolite markers. Moreover, because combinatorial effects among the markers can seriously affect disease developments and there also exist individual differences in genetic makeup or heterogeneity in cancer progressions, single marker is not enough to identify cancers.
Results: We proposed classification models using multivariate classification techniques and developed an analysis procedure for classification studies using metabolome data. Through this strategy, we identified five potential urinary biomarkers for breast cancer with high accuracy, among which the four biomarker candidates were not identifiable by only univariate methods. We also proposed potential diagnosis rules to help in clinical decision making. Besides, we showed that combinatorial effects among multiple biomarkers can enhance discriminative power for breast cancer.
Conclusions: In this study, we successfully showed that multivariate classifications are needed to precisely diagnose breast cancer. After further validation with independent cohorts and experimental confirmation, these marker candidates will likely lead to clinically applicable assays for earlier diagnoses of breast cancer.
Background
Breast cancer is currently the second most common type of cancer [1] after lung cancer and the fifth most common cause of cancer death [2]. Therefore, with the appearance of many high-throughput measurement technologies, there have been many studies of the diag-nosis of breast cancer using high-throughput methods of analysis. Samples for the diagnostic analysis of the breast cancer include urine, serum, plasma, or tissue, and various components are measured, including mRNA, proteome, metabolome, epigenome.
Of the various types of samples, diagnostic techniques using urine are advantageous in terms of clinical
application to real patients because these techniques are non-invasive, inexpensive, and easy to perform, likely leading to earlier detection for malignancies [3]. In addi-tion, since metabolites are end products of cellular pro-cesses, their concentrations reflect the systems-level response of biological systems and are closely linked to phenotypes and diseases [4]. Urine, moreover, contains many classes of compounds, including organic acids, amino acids, purines, pyrimidines, sugars, sugar alcohols, sugar acids, and amines, which can be diagnostic clues for a variety of abnormalities. Therefore, urine metabo-lome is very useful in biomarker discoveries and clinical applications. However, only univariate methods such as a t-test, chi-square, and ANOVA have been used in classification studies using urine metabolome [5-11].
* Correspondence: [email protected]
1
Department of Bio and Brain Engineering, KAIST, Daejeon, South Korea
© 2010 Lee et al; licensee BioMed Central Ltd. This is an open access article distributed under the terms of the Creative Commons Attribution License (http://creativecommons.org/licenses/by/2.0), which permits unrestricted use, distribution, and reproduction in any medium, provided the original work is properly cited.
Principal Component Analysis (PCA) or Partial Least Squares (PLS) methods, which is a multivariate method, also has been used, but it is, as a dimension reduction method, not meant for constructing classification mod-els, but for visualizing overall distributions of given data or examining separability between different groups.
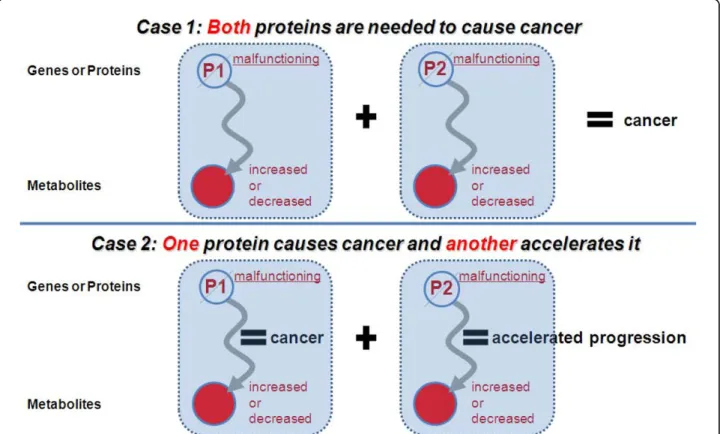
Since multiple genes or proteins would be involved in developments of complex diseases such as breast cancer, multiple compounds including metabolites would be related with the complex diseases, and multivariate methods would be needed to identify those multiple metabolite markers. Moreover, because combinatorial effects among the markers can seriously affect disease developments and there also exist individual differences in genetic makeup or heterogeneity in cancer progres-sions, single marker is not enough to identify cancers. Figure 1 shows multiple components involved in cancers and combinatorial effects among them. However, there have been no multivariate classification studies for urine metabolome data. Although Denkert et al. [12] per-formed multivariate-based classifications for metabo-lome data, they used tissue metabometabo-lome datasets. Besides, they did not consider biological implications of multivariate classifications in the paper.
Therefore, in this study, we proposed classification models using multivariate classification techniques (Figure 2) and developed an analysis procedure for clas-sification studies using metabolome data. (Figure 3) Through this strategy, we identified five potential urin-ary biomarkers for breast cancer with high accuracy, among which the four biomarker candidates were not identifiable by only univariate methods. (Figure 4, Table 1,2,3) We also proposed potential diagnosis rules to help in clinical decision making. (Figure 5) Besides, we showed that combinatorial effects among multiple bio-markers can enhance discriminative power for breast cancer. (Figure 6 and 7)
Data
Urine sample collection
Urine samples were collected from female breast cancer patients (n = 50, age 47.6 ± 7.89 yr) and healthy subjects as normal controls (n = 50, age 46.64 ± 7.38 yr) at the Samsung and Hanyang University Medical Centers (Seoul, Korea). All study subjects underwent the same diagnostic procedures, i.e., a physical examination of the breasts, mammography, and ultrasonography as detailed by the American Joint Committee on Cancer staging.
Figure 1 Potential cases in which multiple proteins are simultaneously related to cancer developments In the case one, two metabolites should be measured simultaneously to identify cancer. Both metabolites also should be detected in the case two for accurate diagnosis. Therefore, these cases show that only one metabolite may not be enough for cancer diagnosis.
Breast cancer patients underwent either a modified radi-cal mastectomy (MRM) or a lumpectomy with an auxili-ary lymph node dissection. Both pre- and postoperative urine samples were collected, with the latter obtained 2 weeks after surgery. The sex- and age-matched controls had no evidence of benign or malignant breast disease. All of the urine samples were collected in the early mornings and kept frozen at −20°C until analysis. In
this study, we used only pre-operative and normal sam-ples to construct models to distinguish between breast cancer and normal samples.
Sample preparation
Urinary metabolites were prepared by extraction under four conditions. First, each urine sample (1 mL) was loaded into a Strata-X cartridge (60 mg, 3 mL; Phe-nomenox, Torrance, CA), washed with distilled water (1 mL), and extracted with 4 mL of methanol. The eluate was divided in half, and one half of the eluate (2 mL) was evaporated and dried in the desiccator over 30 min. For the second condition, the other half of the eluate was evaporated, dissolved in 1 mL of 0.2 M acetate buffer (pH 5.2), and hydrolyzed with b-glu-curonidase/arylsufatase (50 μL) from Helix Pomatia (Roche, Mannheim, Germany) at 55°C for 3 hr. After cooling, urinary metabolites were extracted with 5 mL of diethyl ether by mechanical shaking for 20 min and centrifugation at 2500 rpm for 5 min. The separated organic layer was evaporated under nitrogen and kept in the desiccator over 30 min. For the third condition, the remaining aqueous layer was adjusted to pH 1-2 with 200 μL of 3 M HCl and extracted with 5 mL of diethyl ether. The separated organic extract was evapo-rated and dried. For the fourth condition, the remain-ing aqueous layer was adjusted to pH 10 – 11 with 0.73 g of K2CO3 and extracted with 5 mL of diethyl ether and dried. All dried extracts were derivatized by 50 μL of MSTFA/TMSI/TMCS (100:2:5, v/v/v) mixture at 60°C for 15 min and injected into a GC-MS system.
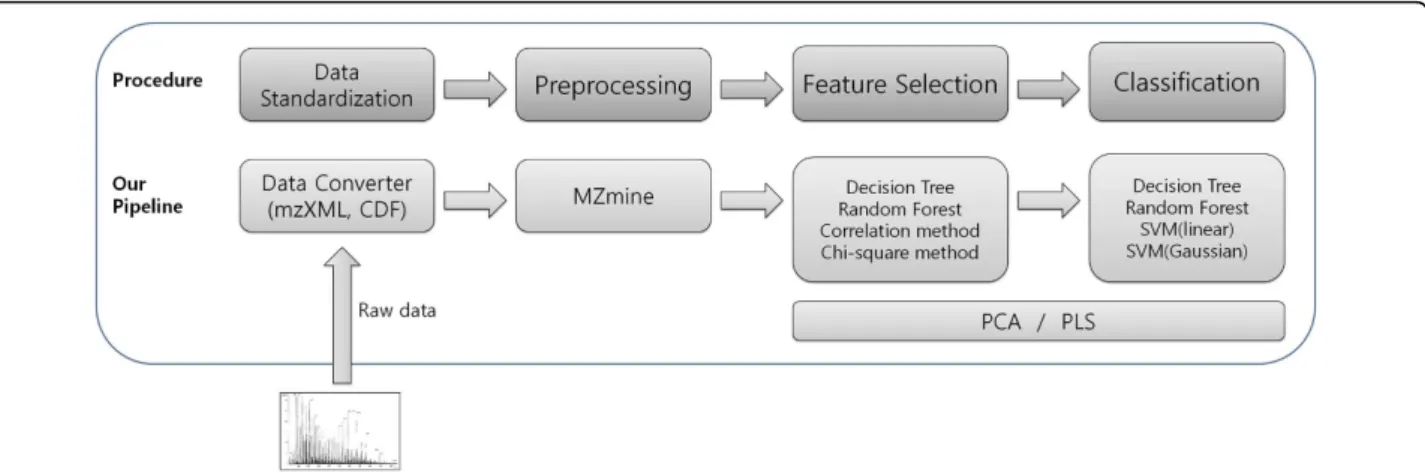
Figure 2 An overview of the analysis procedure used to construct classification models based on metabolome datasets The procedure consists of four stages; data standardization, preprocessing, feature selection, and classification. The raw data from mass spectrometry machines are converted into the standard data formats mzXML [13] and CDF, and in turn preprocessed using the MZmine tool [14,15]. The data are then analyzed with various feature selection and classification techniques. For feature selection, we use chi-square as a univariate method, the correlation-based method as a multivariate method, and Decision tree and Random forest as classifier-embedded methods. For classification, we use Decision tree and Random forest as tree-based non-parametric methods and Support vector machine (SVM) as a generalized linear discriminative method. (An Artificial neural network (ANN) is not used here, since it is known that the ANN has weak points in many cases, compared to the SVM [18,19].) The dimension reduction methods PCA and PLS are used for visualizing overall distributions of given data.
Figure 3 A result of partial least square (PLS) for the given data The datasets are gas chromatography coupled to mass spectrometry (GC-MS) profiles from urine samples of 50 breast cancer patients and 50 normal women. The crosses represent cancer patients, while the asterisks represents normal women. Two classes are separated well on two principal component axes. This result suggests a high likelihood that urine samples have separability between normal women and breast cancer patients.
Instrumental conditions
All samples prepared were separated through a Ultra-1 capillary column (25 m x 0.2 mm ID, 0.33 μm film thickness; Agilent, Palo Alto, CA) and analyzed by a Thermo Finnigan GC-MS system consisting of a Trace 2000 GC and a Polaris Q mass-selective detector in the scan range of m/z 50 – 800 (Thermo Finnigan, Wal-tham, MA).
Methods
In this study, we have organized an analysis procedure to construct classification models based on metabolome datasets using various multivariate classification meth-ods. The procedure consists of four stages: data standar-dization, preprocessing, feature selection, and classification. (Figure 2)
1) Data standardization stage: raw data from the mass spectrometry machine is converted into standard
formats. The mzXML [13] and CDF formats are well-known and used in this work.
2) Preprocessing stage: multiple steps are used to pre-process raw data, including smoothing, peak detection, and peak alignment. For those purposes, MZmine soft-ware [14,15] is suitable and used in this work; this pro-gram is freeware and is appropriate for liquid chromatography coupled to mass spectrometry (LC-MS), gas chromatography coupled to mass spectrometry (GC-MS), and capillary electrophoresis coupled to mass spectrometry (CE-MS).
3) Feature selection stage: it is critical in the construc-tion of classificaconstruc-tion models and in biomarker discovery to extract the meaningful variables from among thou-sands of variables (in this work, m/z peaks). To reflect various types of distributions of data, we have used a variety of feature selection algorithms comprising univariate (t-test and chi-square), multivariate (the
Figure 4 The proposed classification model using the first dataset (Table 1A) This model was constructed by Decision tree. The dataset consists of three features: M191, M65, and M345. The rectangles represent nodes in a tree, and the box-plots are the corresponding t-test results of each node, including their p-values, showing the discriminating power of the features.
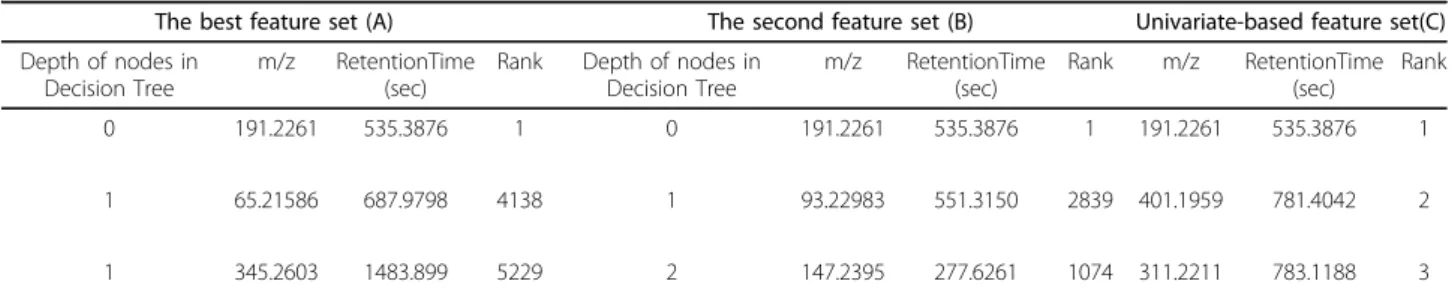
Table 1 A list of selected feature sets in the feature selection stage
The best feature set (A) The second feature set (B) Univariate-based feature set(C) Depth of nodes in
Decision Tree
m/z RetentionTime (sec)
Rank Depth of nodes in Decision Tree m/z RetentionTime (sec) Rank m/z RetentionTime (sec) Rank 0 191.2261 535.3876 1 0 191.2261 535.3876 1 191.2261 535.3876 1 1 65.21586 687.9798 4138 1 93.22983 551.3150 2839 401.1959 781.4042 2 1 345.2603 1483.899 5229 2 147.2395 277.6261 1074 311.2211 783.1188 3 The best feature set (A), the second-best set (B) by the multivariate feature selection method, and a feature set (C) by the univariate method for comparison. Rank in the feature list from the univariate feature selection is shown.
correlation-based feature selection (CFS) algorithm), and model-embedded methods (Decision tree [16] and Ran-dom forest [17]).
4) Classification stage: with selected feature sets, clas-sification models are constructed. In this work, Decision tree and Random forest are used as tree-based non-parametric methods. Support vector machine (SVM) is
used as a generalized linear discriminative method. An Artificial neural network (ANN) is not used since it is known that SVM outperforms ANN unless training datasets are sufficient [18], and ANNt is also weak at over-fitting and computational complexity because too many parameters must be estimated [19]. All the algo-rithms are multivariate.
Table 2 Contingency table for the first feature set
Actual Output Accuracy Sensitivity Specificity Cancer Normal Decision Tree Confidence=0.25 Cancer 47 3 94.00% 94.00% 94.00% Pruning=true Normal 3 47 Random Forest Tree=500 Cancer 47 3 95.02% 94.00% 96.00% Feature=6 Normal 2 48
Support Vector Machine (Linear)
Cost=1 Cancer 50 0 89.06% 100.00% 72.00%
Gamma=0.33 Normal 14 36 # of Support Vectors: 52
Support Vector Machine (Gaussian)
Cost=45 Cancer 49 1 95.16% 98.00% 92.00%
Gamma=0.33 Normal 4 46 # of Support Vectors: 22
Classification results for the first feature set (Table 1A)
Contingency table showing number of cases classified for each of the diagnostic classes for the first feature set (Table 1A).
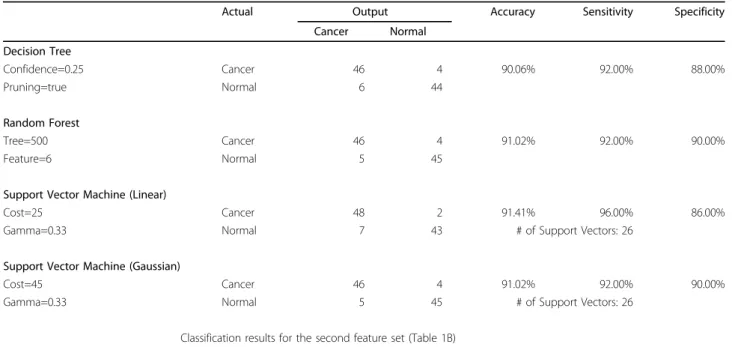
Table 3 Contingency table for the second feature set
Actual Output Accuracy Sensitivity Specificity Cancer Normal Decision Tree Confidence=0.25 Cancer 46 4 90.06% 92.00% 88.00% Pruning=true Normal 6 44 Random Forest Tree=500 Cancer 46 4 91.02% 92.00% 90.00% Feature=6 Normal 5 45
Support Vector Machine (Linear)
Cost=25 Cancer 48 2 91.41% 96.00% 86.00%
Gamma=0.33 Normal 7 43 # of Support Vectors: 26
Support Vector Machine (Gaussian)
Cost=45 Cancer 46 4 91.02% 92.00% 90.00%
Gamma=0.33 Normal 5 45 # of Support Vectors: 26
Classification results for the second feature set (Table 1B)
In addition, for visualization of datasets the dimension reduction algorithms PCA and PLS, are used, allowing separablity of given datasets to be checked.
Results
Preprocessing of urine metabolome datasets
We have constructed models to classify urine metabo-lome data into breast cancer and normal, and we have
identified several potential biomarkers for breast cancer, which are detectable in urine samples, with the meta-bolome-data analysis procedure described above. First, a total of 26,306 features, which are m/z valued-peaks with retention time information, are standardized through our data converter and then preprocessed by MZmine (Smoothing, peak detection, peak alignment, gap-filling, and normalization of the software were
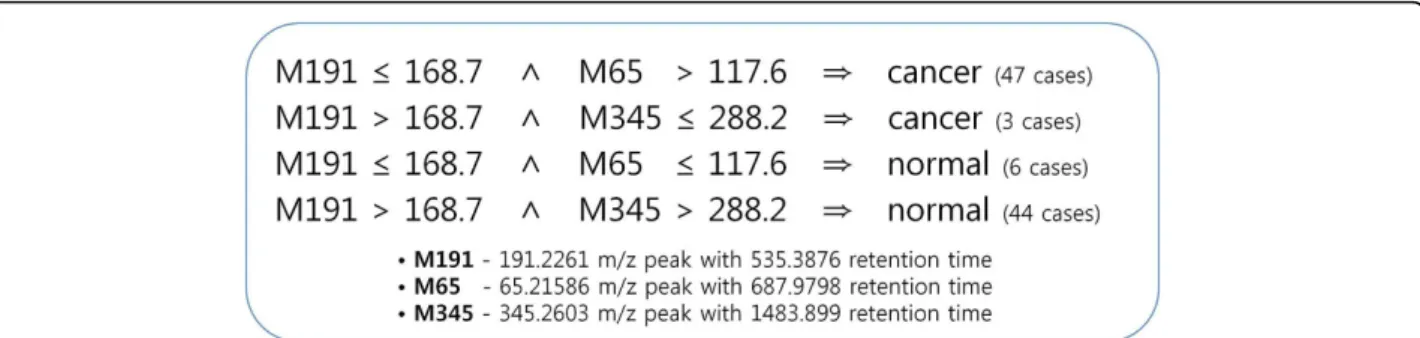
Figure 5 Potential diagnosis rules to help clinical decision making for breast cancer These rules are derived from the classification model by Decision tree for the first dataset (Table 1A). The values indicate intensities of mass spectrometry of each peak.
Figure 6 The comparison of the performance of univariate versus multivariate classification A t-test, which is a univariate method, has been applied to the identified feature sets. A) M191 shows a p-value of 2.866e-06 in the t-test, and it seems that this peak can be identified by both of the univariate and multivariate method. B) However, M65 shows a p-value of 0.7528; therefore this peak cannot be identified by only the univariate method. In this case, if the multivariate method is applied, then M65 can be identified, because the multivariate method considers more than two features at the same time and, that is, can find the case that breast cancer and normal samples are classified if two conditions should be satisfied simultaneously; here, the intensity of M65 is more than 117.6 and the intensity of M191 is less than 168.7. It seems that this discriminative power of multivariate methods is highly appropriate for biological systems in which more than dozens of factors are able to affect single disease. As a result, since both conditions are applied together, the criterion becomes strict and the p-value of M65 is dramatically decreased from 0.7528 (left boxplot; by univariate method) to 5.478e-08 (right boxplot; by multivariate method). C) The p-value for M345 has also been decreased from 0.4299 (left) to 0.00299 (right).
performed with default parameters. Peaks with the same m/z value are regarded as different if their retention times are different.).
Separability analysis using Partial Least Square
Next, to inspect overall distributions of the data, PLS analysis has been performed (Figure 3). Two classes have been separated well on two principal component axes, showing the suitability of the data for this biomar-ker finding study. Further, these results show that urine samples contain information that can discriminate breast cancer from normal, presenting the possibility to diagnose breast cancer by acquiring and analyzing urine samples from the patients. The information contained in the urine samples is likely to be related to the causes of breast cancer.
Feature selection analysis
Among 26,306 peaks, feature selection has been per-formed to extract significantly meaningful metabolite peaks between two groups of people. After many trials using different feature selection methods, 10 feature sets have finally been selected by Decision Tree (C4.5 algo-rithm) [16] in different datasets of 10-fold cross-validation. Among the 10 feature sets, the best feature set (Table 1A) and the second set (Table 1B) are shown here. These two sets consist of five features including one common feature (191.2261 m/z with 535.3876 retention time). The features consist of m/z valued-peaks with retention time informa-tion, and the optimal number of features in each set has been automatically selected by the C4.5 algorithm, which has pruning functions to avoid over-fitting. For compari-son, a feature set (Table 1C) is selected by the univariate feature selection method (Chi-square), and the ranks in the feature list from the univariate feature selection are provided for the three feature sets.
Construction of classification models
Using selected feature sets, classification models have been constructed through various classification algo-rithms in our analysis procedure with 10-fold
cross-validation. In both of the two feature sets, overall accuracies were more than 90 percent. In the first set, performance, including both sensitivity and specificity, was more than 94 percent in all of the classifiers except the linear SVM. (Table 2 and 3) Finally, we have devel-oped reliable potential diagnosis models for breast can-cer based on urine samples (Table 1 and Figure 4). In addition, diagnosis rules to help in clinical decision making for breast cancer have been proposed from the models of the Decision Tree (Figure 4 and 5), and these rules can be useful to clinical applications if the pro-posed potential biomarkers are confirmed by further experiments. For performance comparison with univari-ate classification, three univariunivari-ate classifiers have been constructed by each feature of the feature set from the univariate feature selection using Decision Tree with only one feature. (Table 4) These results showed that multivariate classifications outperform univariate meth-ods by about 6.6~12.7 percent. In addition, as a semi-multivariate classification, the three features selected by the univariate feature selection have been applied to multivariate classification methods to match the number of features used in the multivariate classifications. How-ever, in all the classification algorithms, multivariate classification methods were comparable to or also out-performed the semi-multivariate approach.
Confirmation of multivariate classification’s power
Last, to confirm the multivariate classification’s power, a t-test, which is a univariate method, has been applied to the identified feature sets. A metabolite peak of 191.2261 m/z with 535.3876 retention time shows a p-value of 2.866e-06 in the t-test, and it seems that this peak (M191) can be identified by both the univariate and multivariate methods (Figure 6A). However, a metabolite peak of 65.21586 m/z with 687.9798 retention time (M65) shows a p-value of 0.7528, and it seems that this peak cannot be identified by only the univariate method, given the high p-value. In this case, if the multivariate method is applied, then M65 can be identified, because the multivariate method considers more than two features at the same
Figure 7 M191 causes cancer and M65 and M345 accelerate it In the results, M191 itself had enough discriminative power for breast cancer, but when it worked together with M65 and M345, the discriminative power was considerably enhanced. This is the second case of the figure 1 and shows that there exists an issue of significant combinatorial effects among multiple metabolites in real dataset analysis.
time, although the rank of M65 in the feature list from the univariate feature selection is very low, whose rank is 4138 among 26306 (Table 1A). That is, the multivariate algo-rithm can find the case that breast cancer and normal samples are classified if two conditions should be satisfied simultaneously; in this experiment, the intensity of M65 is more than 117.6 and the intensity of M191 is less than 168.7. It seems that this discriminative power of multivari-ate methods is highly approprimultivari-ate for biological systems in which more than dozens of factors are able to affect single disease. (in an algorithmic view, since M191 is a higher node than M65 in the decision tree of our constructed classification model, by a split of M191 node, all the instances are rearranged and divided into two groups so as to make the lower uncertainty of instance sets at the lower nodes than M191. Then, in M65 node, classification rules are searched using only one half of the instances). As a result, since both conditions are applied together, the cri-terion becomes strict and the p-value of M65 is dramati-cally decreased from 0.7528 to 5.478e-08 (Figure 6B). A metabolite peak of 345.2603 m/z with 1483.899 retention time (M345) has also been decreased from a p-value of 0.4299 to 0.00299 (Figure 6C).
Discussion
To apply the proposed classification models and poten-tial biomarkers to real clinical situations, the following analysis procedures are required:
First, additional validations must be performed using independent datasets that may have different character-istics from the data used in this study so as to guarantee the generality of the proposed models; there have been
a few studies [20-22] performing validations using inde-pendent datasets. After strict validations, the metabolites corresponding to the identified peaks, which are the potential markers, must be identified. In addition, bio-logical interpretation is required to understand why the proposed metabolites are significantly different in patients with breast cancer. This work can be accom-plished by functional analysis of the metabolic pathways for the metabolites or enzymes related to them.
However, although further work remains to be done for actual application in clinical settings, this study proposes several possibilities for classification and biomarker discov-ery research using the urine metabolome. The first possi-bility is that breast cancer can be recognized by analyzing urine metabolome samples. This becomes more obvious with the results of partial least square analysis (PLS), showing that urine samples have the information that can discriminate between normal and breast cancer groups. Second, this study shows the possibility that reliable diag-nosis models and potential markers, whose performance were all better than 94 percent, can be constructed from GC-MS urine metabolome datasets. After experimental validation, the proposed marker candidates will likely lead to clinically applicable assays for earlier diagnosis of breast cancer. Furthermore, this study shows the possibility that multivariate methods can discover‘hidden features’ that univariate methods cannot easily find. It seems that this capability is very important with complex, noisy data, such as urine metabolome data that may be affected by hetero-geneity in cancer progression, individual differences of genetic makeup, or the averaging of multiple characteristic signals into undistinguishable signals.
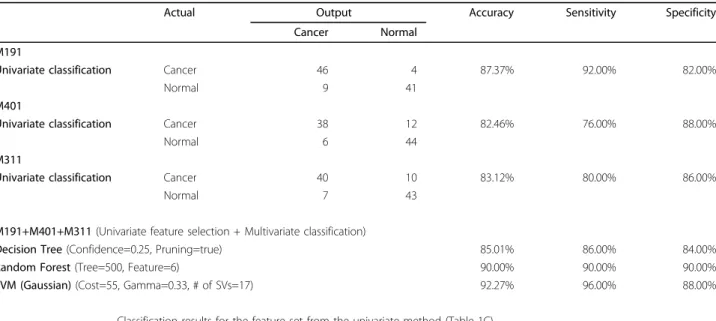
Table 4 Contingency table for the feature set from the univariate method
Actual Output Accuracy Sensitivity Specificity
Cancer Normal M191
Univariate classification Cancer 46 4 87.37% 92.00% 82.00%
Normal 9 41
M401
Univariate classification Cancer 38 12 82.46% 76.00% 88.00%
Normal 6 44
M311
Univariate classification Cancer 40 10 83.12% 80.00% 86.00%
Normal 7 43
M191+M401+M311 (Univariate feature selection + Multivariate classification)
Decision Tree (Confidence=0.25, Pruning=true) 85.01% 86.00% 84.00%
Random Forest (Tree=500, Feature=6) 90.00% 90.00% 90.00%
SVM (Gaussian) (Cost=55, Gamma=0.33, # of SVs=17) 92.27% 96.00% 88.00% Classification results for the feature set from the univariate method (Table 1C)
Conclusions
Diagnostic assays based on urine samples have several major advantages, including non-invasiveness, inexpen-siveness, and ease of performance, that will likely lead to impacts in clinical settings including the earlier detec-tion of malignancies. As the end products generated by an organism, metabolites are closely linked to pheno-types and can be diagnostic clues regarding abnormal-ities. In this study, we have proposed analysis procedures using multivariate classification to more pre-cisely analyze these urine metabolome data. By using multivariate classification methods, we were able to more effectively analyze urine metabolome datasets for which univariate analysis is not powerful enough due to the data’s complexity. We have found in our experi-ments that this multivariate approach can identify fea-tures that are not recognizable by univariate methods. In conclusion, we have proposed classification models and five potential urinary biomarkers for breast cancer diagnosis. Our findings will be helpful in real clinical settings if additional validations and experimental con-firmations are performed.
Acknowledgements
This work was supported by the Korean Systems Biology Program (No. M10309020000-03B5002-00000) and the National Research Lab. Program (R0A-2005-000-10094-0) from the Ministry of Education, Science and Technology through the Korea Science and Engineering Foundation. We would also like to thank CHUNG Moon Soul Center for BioInformation and BioElectronics and the IBM SUR program for providing research and computing facilities.
This article has been published as part of BMC Bioinformatics Volume 11 Supplement 2, 2010: Third International Workshop on Data and Text Mining in Bioinformatics (DTMBio) 2009. The full contents of the supplement are available online at http://www.biomedcentral.com/1471-2105/11?issue=S2. Author details
1Department of Bio and Brain Engineering, KAIST, Daejeon, South Korea . 2
Korea Institute of Oriental Medicine, Daejeon, South Korea .3Bioanalysis and Biotransformation Research Center, KIST, Chengryang, Seoul, South Korea . Authors’ contributions
YK designed metabolome data analysis procedures, implemented them, analyzed classification results, and wrote the manuscript. IK co-designed the analysis procedures and advised on statistical methods. BJ and BC produced metabolome profiles and analyzed them. DL conceived this research and critically reviewed the whole data analysis works and the manuscript. Competing interests
The authors declare that they have no competing interests. Published: 16 April 2010
References
1. World Health Organization International Agency for Research on Cancer -World Cancer Report. 2008.
2. World Health Organization (February 2006) - Fact sheet No. 297: Cancer. 3. Hoyer J PR, Riek R, Fricke L, Steinhoff J: Quantitative determination of
urine proteins: a rapid, noninvasive, sensitive, and inexpensive method to monitor renal grafts. Transplantation proceedings 1995, 27(5):2571-2572. 4. Fiehn O: Metabolomics–the link between genotypes and phenotypes.
Plant Mol Biol 2002, 48(1-2):155-171.
5. Heijne WHM, Lamers R-JAN, van Bladeren PJ, Groten JP, van Nesselrooij JHJ, van Ommen B: Profiles of Metabolites and Gene Expression in Rats with Chemically Induced Hepatic Necrosis. Toxicol Pathol 2005, 33(4):425-433. 6. Schnackenberg L, Sun J, Espandiari P, Holland R, Hanig J, Beger R:
Metabonomics evaluations of age-related changes in the urinary compositions of male Sprague Dawley rats and effects of data normalization methods on statistical and quantitative analysis. BMC Bioinformatics 2007, 8(Suppl 7):S3.
7. Kim K, Aronov P, Zakharkin SO, Anderson D, Perroud B, Thompson IM, Weiss RH: Urine metabolomic analysis for kidney cancer detection and biomarker discovery. Mol Cell Proteomics 2008, M800165-MCP800200. 8. Walsh MC, Brennan L, Pujos-Guillot E, Sebedio J-L, Scalbert A, Fagan A,
Higgins DG, Gibney MJ: Influence of acute phytochemical intake on human urinary metabolomic profiles. Am J Clin Nutr 2007, 86(6):1687-1693.
9. Wang J-N, Zhou Y, Zhu T-Y, Wang X, Guo Y-L: Prediction of Acute Cellular Renal Allograft Rejection by Urinary Metabolomics Using MALDI-FTMS. Journal of Proteome Research 2008, 7(8):3597-3601.
10. Klawitter J, Bendrick-Peart J, Rudolph B, Beckey V, Klawitter J, Haschke M, Rivard C, Chan L, Leibfritz D, Christians U, et al: Urine Metabolites Reflect Time-Dependent Effects of Cyclosporine and Sirolimus on Rat Kidney Function. Chemical Research in Toxicology 2009, 22(1):118-128. 11. Kind T, Tolstikov V, Fiehn O, Weiss RH: A comprehensive urinary
metabolomic approach for identifying kidney cancer. Analytical Biochemistry 2007, 363(2):185-195.
12. Denkert C, Budczies J, Kind T, Weichert W, Tablack P, Sehouli J, Niesporek S, Konsgen D, Dietel M, Fiehn O: Mass Spectrometry-Based Metabolic Profiling Reveals Different Metabolite Patterns in Invasive Ovarian Carcinomas and Ovarian Borderline Tumors. Cancer Res 2006, 66(22):10795-10804.
13. Pedrioli PGA, Eng JK, Hubley R, Vogelzang M, Deutsch EW, Raught B, Pratt B, Nilsson E, Angeletti RH, Apweiler R, et al: A common open representation of mass spectrometry data and its application to proteomics research. Nat Biotech 2004, 22(11):1459-1466.
14. Katajamaa M, Oresic M: Processing methods for differential analysis of LC/MS profile data. BMC Bioinformatics 2005, 6(1):179.
15. Katajamaa M, Miettinen J, Oresic M: MZmine: toolbox for processing and visualization of mass spectrometry based molecular profile data. Bioinformatics 2006, btk039.
16. Quinlan JR: C4.5: programs for machine learning. Morgan Kaufmann Publishers Inc. 1993.
17. Breiman L: Random Forests. Machine Learning 2001, 45:5-32.
18. Vanajakshi L, Vanajakshi L, Rilett LR: A comparison of the performance of artificial neural networks and support vector machines for the prediction of traffic speed A comparison of the performance of artificial neural networks and support vector machines for the prediction of traffic speed. In: Intelligent Vehicles Symposium 2004 IEEE: 2004; 2004, 194-199.
19. Lisboa PJG, Vellido A, Edisbury B: BUSINESS APPLICATIONS OF NEURAL NETWORKS. Progress in Neural Processing 2000, 13.
20. Agranoff D, Fernandez-Reyes D, Papadopoulos MC, Rojas SA, Herbster M, Loosemore A, Tarelli E, Sheldon J, Schwenk A, Pollok R, et al: Identification of diagnostic markers for tuberculosis by proteomic fingerprinting of serum. The Lancet 2006, 368(9540):1012-1021.
21. Theodorescu D, Wittke S, Ross MM, Walden M, Conaway M, Just I, Mischak H, Frierson HF: Discovery and validation of new protein biomarkers for urothelial cancer: a prospective analysis. The Lancet Oncology 2006, 7(3):230-240.
22. Aivado M, Spentzos D, Germing U, Alterovitz G, Meng X-Y, Grall F, Giagounidis AAN, Klement G, Steidl U, Otu HH: From the cover: Serum proteome profiling detects myelodysplastic syndromes and identifies CXC chemokine ligands 4 and 7 as markers for advanced disease. Proceedings of the National Academy of Sciences 2007, 104(4):1307-1312. doi:10.1186/1471-2105-11-S2-S4
Cite this article as: Kim et al.: Multivariate classification of urine metabolome profiles for breast cancer diagnosis. BMC Bioinformatics 2010 11(Suppl 2):S4.