1. Introduction
Precipitation characteristics in the frontal rain-band during the boreal summer monsoon season have been shown to be highly dependent on the state of moisture circulation from sea and thermal convection (Ha et al., 2005). In the Asian summer monsoon region, providing accurate precipitation data is imperative to
limiting damage from meteorological disasters and ensuring efficient management for water resources.
Efforts to produce accurate precipitation data have required the quantitative fraction of convective precipitation. Convective and stratiform rains have different characteristics for rainfall amount (Leary and Houze, 1979), hydrometeors (Churchill and Houze, 1984), and latent heating (Leary and Houze,
Classification of Convective/Stratiform Radar Echoes over a Summer Monsoon Front, and Their Optimal Use with
TRMM PR Data
Hyun-Mi Oh, Ki-Young Heo, and Kyung-Ja Ha†
Division of Earth Environmental System, College of Natural Science, Pusan National University, Busan, 609-735, Republic of Korea
Abstract : Convective/stratiform radar echo classification schemes by Steiner et al. (1995) and Biggerstaff and Listemaa (2000) are examined on a monsoonal front during the summer monsoon- Changma period, which is organized as a cloud cluster with mesoscale convective complex. Target radar is S-band with wavelength of 10cm, spatial resolution of 1km, elevation angle interval of 0.5-1.0 degree, and minimum elevation angle of 0.19 degree at Jindo over the Korean Peninsula.
For verification of rainfall amount retrieved from the echo classification, ground-based rain gauge observations (Automatic Weather Stations) are examined, converting the radar echo grid data to the station values using the inverse distance weighted method. Improvement from the echo classification is evaluated based on the correlation coefficient and the scattered diagram. Additionally, an optimal use method was designed to produce combined rainfalls from the radar echo and Tropical Rainfall Measuring Mission Precipitation Radar (TRMM/PR) data. Optimal values for the radar rain and TRMM/PR rain are inversely weighted according to the error variance statistics for each single station. It is noted how the rainfall distribution during the summer monsoon frontal system is improved from the classification of convective/stratiform echo and the use of the optimal use technique.
Key Words :radar echo classification, convective, stratiform, optimal use method.
Received June 9, 2009; Revised June 17, 2009; Accepted July 1, 2009.
†Corresponding Author: Kyung-Ja Ha ([email protected])
1979; Houze, 1982; Shige et al., 2004; Takayabu, 2002). Steiner and Houze (1997) suggest that convective rain fraction should be determined from the choice of Z-R relation. Therefore, accurate knowledge of the fractions of precipitation from convective and stratiform clouds is very important in the well-organized Z-R relations. In the present study, two representative schemes for convective/stratiform classification of Steiner et al. (1995) and Biggerstaff and Listemaa (2000) are applied to ground-based radar data, and the results are compared for the cases of rain bands in the Changma cloud system, which are organized by cloud cluster in mesoscale convective complex. In relation to the rain type classification for TRMM/PR (Tropical Rainfall Measurement Mission/Precipitation Radar), Awaka et al. (1997) suggest a vertical profile method considering the second derivative of reflectivity with respect to height, and the horizontal pattern method developed by Steiner et al. (1995).
In the present study, rainfall retrieved from two echo classifications are compared to the ground- based rain gauge observations (Automatic Weather Station, hereafter AWS). To improve classified ground-based radar rainfall, TRMM/PR data was used as well. The present study investigates whether the optimal use method (Oh et al., 2006) can improve the rainfall distribution. Optimal use method is applied to combine two kinds of rainfall from ground-based and space-born radars. This idea was obtained from the study of North et al. (1991), which suggest optimal weighting coefficients to combine satellite and rain gauge data that minimizes the mean square error. It is suggested that the detailed precipitation data is needed to produce quantitative precipitation for high-resolution grid and short-range nowcasting.
2. Targeted radar and case study
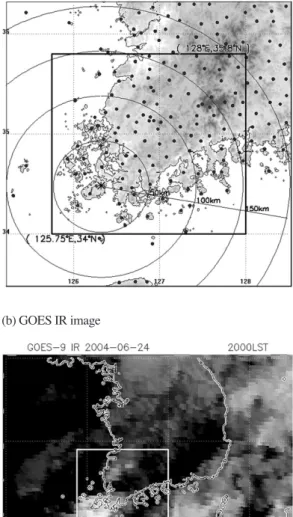
The summer monsoon front approaches the southwestern part of the Korean Peninsula from the Yellow Sea during the rainy season. Figure 1 shows the location of the ground-based radar (Jindo) and it’s surrounding AWS stations. In Fig. 1a, rectangles
Fig. 1. (a) The position of Jindo radar (*) and the verification area (rectangle area). The dots denote the AWS stations, (b) the GOES IR image on 2000LST 24 June 2004.
(b) GOES IR image
(a) Position of Jindo radar and verification area
indicate case regions used for validations, the dots indicate AWS stations, and the circles indicate the observation range of the radar. Jindo radar is an S- band weather radar and is located at the southern zone of a gateway from the south-westerly flow as shown in Fig. 1a. Observation is conducted every 10 minutes, with spatial resolution of about 1km and 12 elevations. CAPPI (Constant Altitude Plan Position Indicator) at the levels of 1.5km and 3km are used in this study.
The focus of this study is the summer monsoon- Changma case (Ha et al. 2005), which was observed almost simultaneously by both TRMM/PR and the radar at Jindo. The TRMM/PR is spaceborne instrument designed to provide three-dimensional structure of precipitation (Iguch, 1994). In the sections of validation and optimal use method, the AWS precipitation has been used. The AWS is a highly intensive surface observation network run by the Korea Meteorological Administration with a spatial resolution of 15km. Ground-based rain gauge of AWS is mounted in a horizontal level spot, and it is a representative of the surrounding area at the height of 30cm with measurements for accuracy of 0.5 mm. The study focused on 10 minutes of accumulated rain. In the section of optimal use, the TRMM/PR data (2A25) is used to combine with ground-based radar.
The case is 2020 LST, 24 June 2004. Fig. 1b is GOES (Geo-stationary Operational Environmental Satellite) IR image of 2000 LST, 24 June 2004 (this 2020 LST is nearest time for GOES around 2020 LST). The time is around Changma onset day, when the Changma front approaches the southwestern part of the Korea Peninsula from the Yellow Sea. The cloud exhibits band structure, which actually contains heavy rain over 100mm.
3. Methods for classification and optimal use
1) Two methods of radar echo classification
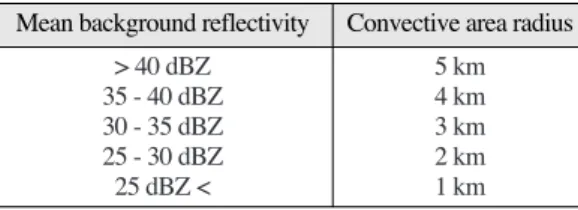
The Steiner et al. (1995) algorithm (SHY) uses gridded radar reflectivity data from the “working level”, which is defined as 1.5km CAPPI at ranges under 100km, and 3.0km CAPPI at ranges over 100km. The convective center is chosen by two criteria. First is the intensity criterion. Reflectivity over 40 dBZ is automatically labeled as a convective center. Second, even though the maximum value of reflectivity is less than 40 dBZ, if the value exceeds the average intensity taken surrounding background reflectivity, the peakedness reflectivity can be classified as a convective center. Here, the peakedness criterion for reflectivity difference relies on the mean background reflectivity. For each grid point identified as a convective center by one of the above two criteria, all surrounding grid points within the intensity-dependent convective radius are considered as convective rain. Peakedness criterion is a function of the mean background reflectivity.Convective area radius is dependent on the intensity of convective center as shown in Table 1.
Biggerstaff and Listemaa (2000) method (BL) is a modified SHY using vertical characteristics of stratiform/convective rain. Typically, the BL method is performed after the SHY method. This method uses vertical lapse rate, bright band fraction and horizontal gradient. The BL method’s essence is the
Table 1. The convective area radius as a function of mean background reflectivity
Mean background reflectivity Convective area radius
> 40 dBZ 5 km
35 - 40 dBZ 4 km
30 - 35 dBZ 3 km
25 - 30 dBZ 2 km
25 dBZ < 1 km
Mean background reflectivity Convective area radius
consideration of vertical lapse rate of reflectivity as
∇ZZ, bright band fraction (BBF) and horizontal gradient of reflectivity. The criteria of vertical lapse rate, BBF, and horizontal gradient are from Biggerstaff and Listemaa (2000). The criterion for the absolute value of vertical gradient of reflectivity is 3.5dBZkm-1, and the point of gradient less than the criteria is considered as a convective rain area. The decrease in reflectivity with increasing height is considered as a gradient between the maximum reflectivity height and 3-km layer above maximum reflectivity height. The criterion of the BBF is 0.6 and 0.4, and it is used to reclassify the cloud type from the SHY method. The horizontal gradient, ∇HZ is used when a steep reflectivity lapse rate, of |∇HZ| > 3.0 dBkm-1, is convective. Although the convective rain was classified from the SHY method, if the reflectivity satisfied |∇HZ| < 3.0 dBkm-1, |∇ZZ| >
3.5 dBkm-1, and Z < 35 dBZ, the convective rain is reclassified as stratiform rain. The convective rain can be reclassified when low reflectivity (Z < 28 dBZ) aloft (defined as roughly twice the altitude of the reflectivity maxima), and a weak horizontal reflectivity gradient |∇HZ| < 3.0 dBkm-1and BBF >
0.6 are satisfied. The stratiform precipitation can be reclassified as convective rain when |∇HZ| > 3.0 dBZkm-1is satisfied, and both of |∇HZ| > 2.0 dBZkm-1and BBF < 0.4 are satisfied.
The stratiform rain are applied the Marshall- Palmer relationship (Marshall et al., 1955).
Z = 200 R1.6 (1)
The rain classified as convective are applied relationship from Tokay and Short (1996).
Z = 170 R1.47 (2)
2) Projection method
Inverse distance weighted method is used to
convert the TRMM/PR and radar data into station values on the assumption that the interpolating surface should be influenced most by the nearby points and less by the more distant points. The interpolating surface is a weighted average of the scatter points and the weight assigned to each scatter point diminishes as the distance from the interpolation point to the scatter point increases.
Zp=
( ) / ( )
(3)Target point Zpis calculated by eq. (3). ziis each sample point and diis distance to target point from each sample point. n is the number of sample point within influence range. This method is used to find equal position values at which TRMM/PR and radar data are equal to AWS station point.
3) Optimal use method
To improve the horizontal rainfall distribution, we applied an optimal use of ground-based radar and satellite-based radar of TRMM/PR. North and Nakamoto (1989) and North et al. (1991) present a general formalism to calculate the mean square errors incurred in estimating space-time mean of rain rate field. The following formulation is for obtaining the optimal weighting coefficient for radar and TRMM/PR data converted to the point of AWS station. Y is real value of precipitation to approximate, YTis TRMM PR data (TR) and YGis ground-based radar data (GR). Equation (4) is mean square error, (5) is optimal weighting coefficient of TR data and (6) is optimal weighting coefficient of GR data. Now consider the value of aTand aRwhich minimizes the value of the mean square error e2. Optimal weighting coefficients of (5) and (6) are in inverse proportion to own mean square error.
ei2
= <(Y_Yi)2>, i = T(TR) or i = G(GR) (4) 1
di
S
n i=1zi di
S
n i=1aˆT= (5)
aˆG= (6)
In other words, the estimate from each sensor design is weighted inversely according to the error variance due to that design alone. A component that has a small error variance will be weighted very strongly and conversely.
Y
YA= aTYYT+ aGYYG (7)
1 = aT+ aG (8)
Equation (7) is the optimized precipitation data using optimal weighting coefficient with the above method. And sum of (5) and (6) is equal to 1.
4. Comparisons between convective and stratiform rain
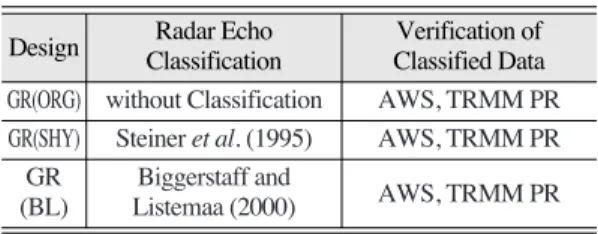
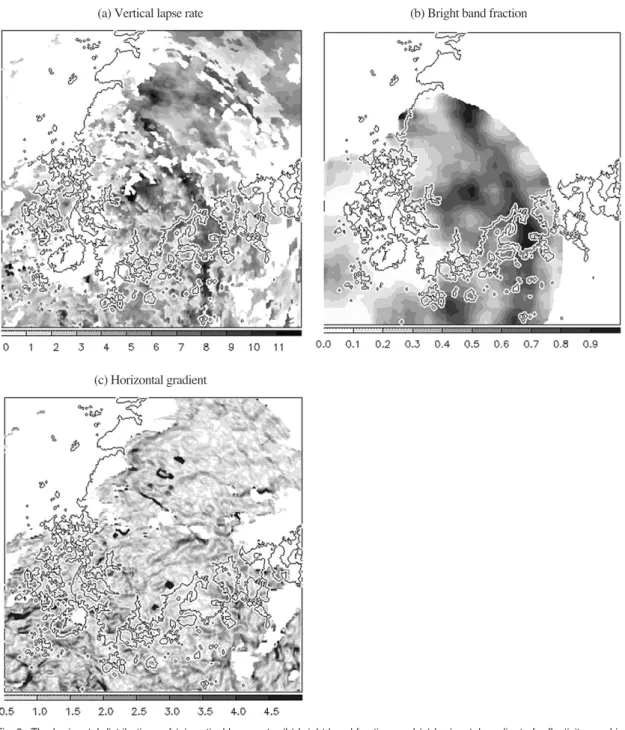
Table 2 explains the experimental design of classification. To investigate the impact of classification for convective/stratiform cloud, we compared the convective and stratiform rain area of Fig. 2 (b) and (c) from reflectivity at the working level from ground-based radar by SHY and BL classification method, respectively. The convective and stratiform cloud regions are not significantly different from those obtained by the SHY and BL methods. Fig. 3 shows vertical lapse rate, bright band
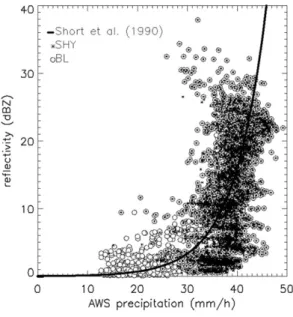
fraction, and horizontal gradient used in the BL method. The BL method tends to induce the convective type rain at smaller reflectivity, relative to that of the SHY method (Fig. 4). This may be due to reclassification from stratiform rain. The BL classification might improve the fitting error, compared to that of SHY.
After application of convective and stratiform Z-R relation, the rainfalls from the SHY and BL method were compared as shown in Fig. 5. Correlation coefficient between AWS and GR (BL) has the highest value among the three designs of classification. The value of coefficient between GR (BL) and AWS is 0.81, while those for GR (SHY) and GR (ORG) are 0.79 and 0.79, respectively. GR (BL) shows the most improvement in the applicability to the Korean Peninsula. Despite the hope, many tasks must be done in the technical scheme to evaluate adjustable coefficients and threshold values.
5. Verification of optimal use
To produce horizontal distribution of rainfall, optimal use of ground-based radar and TRMM/PR was examined. The optimal use was applied to the 10-min accumulated rain of GR and TR, compared to the AWS stations. The GR was divided by original (OPT (ORG)) using non-classified rainfall from ground-based radar, with classification of SHY (OPT (SHY)) and BL (OPT (BL)) methods. Table 3 shows the experimental design for optimal use. The result of optimal use with BL classification is shown as Fig. 6.
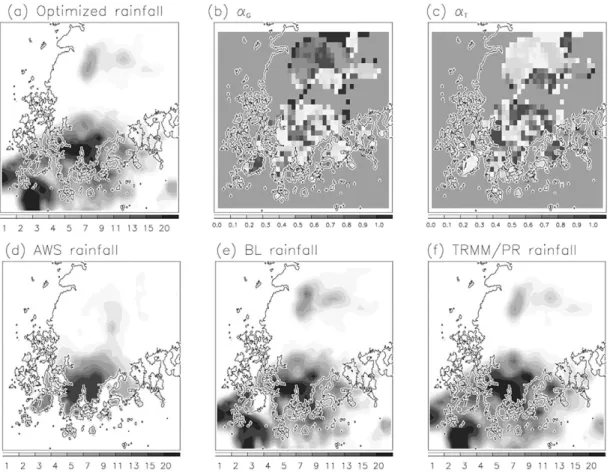
The rainfall (Fig. 6 (a)) by optimal use method with BL classification can be compared to the figure of AWS rain in Fig. 6 (d). The detailed heavy rain areas are seen in Fig. 6 (a) with the optimal coefficient as shown in Fig. 6 (b) and (c). It should be eT2
eT2+ eG2 eG2 eT2+ eG2
Table 2. The experimental design for classification of convective and stratiform rain
Design Radar Echo Verification of Classification Classified Data GR(ORG) without Classification AWS, TRMM PR GR(SHY) Steiner et al. (1995) AWS, TRMM PR
GR Biggerstaff and
AWS, TRMM PR (BL) Listemaa (2000)
Design Radar Echo Verification of Classification Classified Data
Fig. 2. (a) Reflectivity of the working level (1.5km) from radar at 2020LST 24 June 2004. The different colors in (b) and (c) indicate the convective and stratiform clouds by the use of SHY and BL methods. SHY indicates classification method from Steiner et al (1995) and BL indicates classification method from Biggerstaff and Listemaa (2002).
(c) SHY
(a) Reflectivity (b) BL
Fig. 3. The horizontal distributions of (a) vertical lapse rate, (b) bright band fraction, and (c) horizontal gradient of reflectivity used in the BL method.
(c) Horizontal gradient
(a) Vertical lapse rate (b) Bright band fraction
noted that the north and south area rain band in Fig. 6 (a) come from TRMM signal as shown in Fig. 6 (f).
In summary, the optimal combined precipitation with classified GR and TR tends to produce local heavy rainfall, and it could be used for very short-term warning in QPF (quantitative precipitation forecasting) and comparison of high resolution NWP models.
6. Summary and conclusion
We examined two classification methods of SHY (Steiner et al., 1995) and BL (Biggerstaff and Listemaa, 2000) for stratiform and convective rain in the Changma frontal rain band. The classification with SHY and BL induced improved horizontal precipitation over the Korean Peninsula. The results showed the BL method recognized broader area, which may be due to reclassification using BBF, vertical and horizontal gradients.
In this paper, optimal weighting coefficient was used to improve the rainfall distribution by combining classified ground-based radar data and space-born radar data. Optimal weighting function was produced by the error analysis of radar rain with respect to AWS measured rain. In this case, the best optimal use was a pair of TRMM/PR and GR (BL) rain. Optimal use of TRMM/PR and GR (BL) is suggested as a technical method to produce a horizontal map of heavy rainfall.
To conclude, we would like to suggest that the Table 3. The experimental design for optimal use after
classification of convective and stratiform rain
Real YT YG
OPT(ORG) AWS TRMM/PR GR(ORG)
OPT(SHY) AWS TRMM/PR GR(SHY)
OPT(BL) AWS TRMM/PR GR(BL)
Real YT YG
Fig. 4. The relation between reflectivities of convective cloud by the SHY and the BL method and AWS precipitation.
The thick curve denotes a Z-R relation by Short et al.
(1990).
Fig. 5. Comparison of radar precipitation from reflectivity and AWS ground precipitation. Radar precipitations were retrieved from the convective and stratiform cloud classifications with the BL method (BL) and the SHY method (SHY). The ORG radar precipitation was retrieved from reflectivity without any classification. The TR means TRMM/PR precipitation.
detailed optimized precipitation will be used to validate result of high resolution model and short- range nowcasting. In further study, it is recommended that some criteria for BBF and lapse rates of BL method and Z-R parameters of convective rain should be adjusted to the Korean Peninsula rainfall characteristics.
Acknowledgement
This subject is supported by ministry of environment as a ‘the eco-technopia 21 project’.
References
Awaka, J., T. Iguchi, H. Kumagai, and K. Okamoto, 1997. Rain type classification algorithm for TRMM precipitation radar. Proc. IGARSS 1997, Singapore, 4: 1633-1635.
Biggerstaff, M. I. and S. A. Listemaa, 2000. An improved scheme for convective/stratiform echo classification using radar reflectivity. J.
Appl., Meteorol., 39: 2129-2150.
Churchill, D. D. and R. A. Houze Jr., 1984.
Development and structure of winter monsoon and cloud clusters on 10 December 1979. J. Atmos. Sci., 41: 933-960.
Fig. 6. (a) The optimized rainfall (mm/h) distribution by the BL method. (b) and (c) show the optimal weighting coefficients for (b) ground-based radar and (c) the TRMM/PR. (d), (e), and (f) are horizontal distribution of rainfall from AWS, BL, and TRMM/PR, respectively.
Ha, K.-J., S. -K. Park, and K.-Y. Kim, 2005. On interannual characteristics of climate prediction center merged analysis precipitation over the Korean peninsula during the summer monsoon season. Int. J. Climatol., 25: 99-116.
Ha, K.-J., K.-S. Yun, J.-G. Jhun, and C.-K. Park, 2005. Definition of onset/retreat and intensity of changma during the boreal summer monsoon season. J. Korean Meteor. Soc., 41(6): 927-942.
Houze Jr., R. A., 1982. Cloud clusters and large-scale vertical motions in the Tropics. J. Meteor.
Soc. Japan, 60: 396-410.
Iguchi, T. and R. Meneghini, 1994. Intercomparison of single-frequency methods for retrieving a vertical rain profile from airborne or spaceborne radar data. J. Atmos. Oceanic Technol., 11, 1507-1517.
Leary, C. A. and R. A. Houze Jr., 1979. Melting and evaporation of hydrometeors in precipitation from the anvil clouds of deep tropical convection. J. Atmos. Sci., 36: 669-679.
Marshall, J. S., W. Hitschfeld, and K. L. S. Gunn, 1955. Advances in radar weather. Adv.
Geophys. 2: 1-56.
North, G. R. and S. Nakamoto, 1989. Formalism for comparing rain estimation designs. J. Atmos.
Oceanic Technol., 6: 985-992.
North, G. R., Samuel S. P. Shen, and R. B. Upson, 1991. Combining rain gauges with satellite measurements for optimal estimates of area- time averaged rain rates. Water Resour. Res., 27: 2785-2790.
Oh, H.-M., K.-J. Ha, and K.-Y. Heo, 2006.
Estimation of quantitative precipitation rate using an optimal weighting method with radar estimated rainrate and AWS rainrate. Korean J. Rem. Sens., 22: 485-493.
Shige, S., Y. N. Takayabu, W.-K. Tao, and D. E.
Johnson, 2004. Spectral retrieval of latent heating profiles from TRMM PR data. part I:
development of a model-based algorithm. J.
Appl., Meteorol., 43: 1095-1113.
Short, D. A., T. Kozu, and K. Nakamura, 1990:
Rainrate and raindrop size distribution observations in Darwin Australia. Proc. URSI 1990, Brazil, 35-40.
Steiner, M., R. A. Houze Jr., and S. E. Yuter, 1995:
Climatological characterization of three- dimensional storm structure from operational radar and rain gauge data. J. Appl., Meteorol., 34: 1978-2007.
Steiner, M. and R. A. Houze Jr., 1997. Sensitivity of the estimated monthly convective rain fraction to the choice of Z-R relation. J. of Appl. Meteorol., 36: 452-462.
Tokay A. and D. A. Short, 1996. Evidence from Tropical Raindrop Spectra of the Origin of Rain from Stratiform versus Convective Clouds, J. Appl. Meteor., 35: 355-371.
Takayabu, Y. N., 2002. Spectral representation of rain profiles and diurnal variations observed with TRMM PR over equatorial area.
Geophys. Res. Lett., 29: 1584.