비슷한 규모의 주변 건물에 둘러싸인 저층 건물의 풍하중 산정 방법
Methodology of Wind Load Evaluation of Low-Rise Building Surrounded by Similar-Sized Low-Rise Buildings
김 용 철*
Kim, Yong-Chul
1)
1. Introduction
Many studies have focused on the exami- nations of wind forces and flow fields around isolated low-rise buildings for decades thru wind tunnel tests and/or field measurements.
However, one of the problems associated with prediction of wind loads on a low-rise building in groups is the various surrounding conditions and this variety makes it difficult to formulate analytical procedures for predicting wind load effects on the low-rise building in groups.
Since the late 1970’s, studies examining wind
* 연구교수, 고려대학교, 건축사회환경공학부
Research Professor, Korea University, School of Civil, Environmental, and Architectural Engineering
Tel: +82-2-3290-3833, Fax: +82-2-921-2439
loads on a low-rise building immersed in a group of surrounding buildings(target low-rise building) have been reported, but for more precise evaluation of wind loads, the characteristics of wind load combination effects should be studied. The combination of wind force components is important to reflect the actual peak load effects in the structural design of buildings. Although there have been some studies on wind load combination effects for the isolated low-rise building, no previous studies have examined wind load combination effects on a low-rise building in a group.
Most of the previous studies qualitatively highlight the fact that shielding effects are magnified with increasing number of nearby
only isolated buildings have been studied. In this article, some recent accomplishments1),2) for the evaluation of wind loads and wind load combination effects on a target low-rise building in groups were introduced, which proposed the methodology for evaluating wind loads and their combination effects on a target low-rise building by introducing new design parameters.
2. Two Approaches for Wind Load Evaluations
There are two approaches to determine the wind loads on the target low-rise building in a group. Firstly, the target low-rise building is considered to be surrounded by the same or similar sized low-rise buildings. Hence, the wind loads on the target low-rise building generally, but not always, decrease on account of shielding effect. In this case, the changes of wind pressures and wind forces are reflected by introducing factors such as interference factor or shielding effect factor. The second approach is related to changes of incident flow conditions. As low-rise buildings are normally built in large groups and a large group of low-rise buildings can be regarded as roughness elements, the incident flow conditions change depending on the position of the target low-rise building. When the target low-rise building is designed considering changes of incident flow conditions or the development of an inner boundary layer, the wind pressures and wind forces should reflect the changing roughness conditions. When the first approach
(called interference effect approach) is used, the wind pressures and wind forces should be normalized by the same reference wind speed such as the incident flow at model height, and when the second approach(called roughness effect approach) is used, the coefficients should be normalized by the local wind speed measured at the target low-rise building position.
2.1 Interference effect approach and roughness effect approach
Wind loads can be derived from either the interference effect approach or the roughness effect approach, and the wind loads derived in these two different ways should be the same.
Wind loads from the interference effect approach and roughness effect approach can be estimated from Eq. (1) and Eq. (2), respectively, and comparisons were shown in Fig. 1 for some area densities. As shown, a good agreement was found between them.
WIEA = qH(peakCf)A (1) WREA = qH,local(peakCf,local)A (2)
where, WIEA(N): wind loads on structural frames based on interference effect approach; qH(N/m2) : velocity pressure calculated from the incident flow at model height; A(m2): subject area;
peakCf: peak force coefficients; WREA(N): wind loads on structural frames based on roughness effect approach; qH,local(N/m2): velocity pressure calculated from local mean wind speed; and peakCf,local: local peak force coefficients.
<Fig. 1> Comparison of horizontal wind loads derived by WIEA and WREA
Therefore, wind loads on a low-rise building in a group can be estimated by either method, but the estimation based on the interference effect approach seems to be easier and more understandable because one does not need to measure the local wind speeds, and sometimes it is impossible to measure the local wind speeds due to experimental limitations, which makes the interference factor approach more attractive to the practitioner.
2.2 Wind loads on structural frames based on interference effect approach
The wind loads on structural frames can be calculated from Eq. (1). Here, peak force coefficients(peakCf) of the target low-rise model should be modeled properly. Generally, the peak force coefficients are dependent on the area densities CA and upstream distances Lf. This dependence can be expressed by introducing the interference factor as follows(Eq. (3)).
peakCf = IFf × peakCf,isolated; (3a)
IF = function(C , L) (3b)
The interference factor IFf is a function of area density CA and upstream distance Lf. For example, the variation of maximum drag force is shown in Fig. 2. The maximum drag force change with increasing area density, but there is little variation with upstream distance Lf(<Fig. 2(a)>), implying IFD can only be a function of area density CA.
(a) Variation of maxCD
(b) Variation of IFD
<Fig. 2> Variation of maxCD and IFD
Thus, the ratio of the average value from the second to the last measurement point of maxi- mum drag force coefficient of the target model to the maximum drag force coefficient of the isolated model was calculated and the results are shown in Fig. 2(b) with the area densities.
of the area density CA as shown in Eq. (4).
IFD = 0.77e-3.18CA (4)
For the minimum lift force, considering the variation trend with area density, IFL were simply given as Eq. (5).
IFL = 0.7(CA<0.11); 0.4(CA≥0.11) (5)
2.3 Wind loads on components and cladding based on interference effect approach
Wind loads on components and cladding are calculated from Eq. (6)
WCC = qHČCAC (Č = max(min)Cp-Cpi*
) (6)
where, WCC(N): wind loads on components and cladding; ČC: peak wind force coefficient;
AC(m2): subject area of components and cladding, max(min)Cp: max(min)Cp; and Cpi*
: factor for effect of fluctuating internal pressure.
The effects of the surrounding buildings on peak pressure coefficients are incorporated in the max(min)Cp, and this can be done similarly by introducing the max(min)IF shown in Eq.
(7). Note that the interference factor depends not only on the area density CA and upstream distance Lf but also on the tap position (i,j).
max(min)Cp= max(min)IF × max(min)Cp,isolated
max(min)IF= function(CA, Lf, (i,j)) (7)
In the determination of the max(min)IF, one reasonable method may be to determine the
max(min)IF considering the zoning system prescribed in the current standards and codes of practice, i.e. after determining the max(min) IF for one zone, and applying it to that zone only. If the max(min)IF were determined con- sidering zoning of the building(called zoning interference factor), the variable of tap position (i,j) in Eq. (7) drops off, and the max(min)IF reduces to a function of the area density CA
and upstream distance Lf(Eq. (8)).
max(min)IF = (max(min)Cp)zoning
/(max(min)Cp,isolated)zoning
max(min)IF = function(CA, Lf, (i,j))
= function(CA, Lf)) (8)
(a) Variation of maxIF for zone I
(b) MaxIF for zone I and zone II
<Fig. 3> MaxIF for windward surface
Fig. 3(a) shows the variation of maxIF in zone I on the windward surface with area density and upstream distance. Although maxIF decreases with increasing area density, maxIF varies little in one area density, showing almost a constant value after the second measurement point. This means that the maxIF again can be obtained considering only the area density CA, no more upstream distance Lf and tap position (i,j). As for the maximum drag force coefficient, maxIF were obtained, and the relationships of maxIF to area density are shown in Fig. 3(b) for zone I and zone II. MaxIF is well expressed as an exponential function of area density CA
only, and a similar trend is also true for minIF on the side and roof surfaces.
2.4 Peak normal stresses in columns and wind load combinations
To examine load combination effects directly, peak normal stresses in column members of the frame model with rigid connections shown in Fig. 4 were examined.
<Fig. 4> Frame model and column section
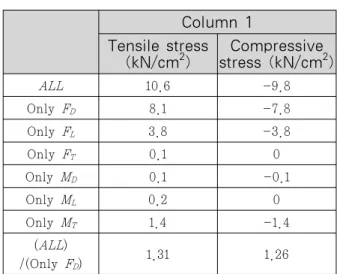
Table 1 compares the peak tensile and compressive stresses in Columns 1 for various wind load conditions of the isolated model. ALL
loading condition considering all six wind force components. It should be noted that when only FD is considered, peak tensile and compressive stresses on Columns 1 considering all wind forces are about 26% ~ 31% larger on average than that considering along-wind force only.
The contributions of FT, MD and ML are extremely small and the effects of these components are almost negligible.
Column 1 Tensile stress
(kN/cm2)
Compressive stress (kN/cm2)
ALL 10.6 -9.8
Only FD 8.1 -7.8
Only FL 3.8 -3.8
Only FT 0.1 0
Only MD 0.1 -0.1
Only ML 0.2 0
Only MT 1.4 -1.4
(ALL)
/(Only FD) 1.31 1.26
<Table 1> Normal stress in Column 1
Same analyses were conducted for the target model, and the tensile stresses in Column 1 is shown in Fig. 5(a) for the ALL Loading condition and in Fig. 5(b) for the FD Loading condition only. The dotted line indicates the stresses in the isolated model. The peak normal stresses decrease with increasing area density from the second measurement point. Note that the variation of peak normal stresses within one area density is small as discussed before.
Using the concept of combination factors γ(σ
ALL/σFX), the ratios of combination factors of the target model to that of the isolated model, which is defined as the interference factor of
shown in Eq. (9) and Fig. 6.
IFγ= 1.1e1.4CA (9)
(a) ALL Loading condition
(b) Only FD loading condition
<Fig. 5> Variation of tensile stresses
<Fig. 6> Interference factor of combination factor
The combination factor(σALL/σFX) of the isolated model is about 0.27, and the interference factor of combination factor increases roughly exponentially with increasing area density, showing that the relative contribution of
along-wind force decreases with area density, and when only along-wind force is considered in the design of a target low-rise building, wind load is ultimately underestimated in highly dense areas.
3. Concluding Remarks
A methodology for estimating wind loads and their combination effect on a flat-roofed low-rise building surrounded by similar-sized buildings or structures was proposed based on the interference factor approach. This metho- dology implements the velocity pressure obtained from the incident flow. As a new design parameters, various interference factors were introduced, and these factors were found to be expressed as an exponential function of area density only. Once the interference factors were evaluated, the design of a target low-rise building in a large group becomes more reason- able, that is, as the area density can be easily estimated, the wind loads can be more economi- cally estimated using the interference factors.
References
1. Y. C., Kim, A., Yoshida, and Y, Tamura,
“Influence of surrounding buildings on wind loads acting on low-rise building”, Journal of Structural Engineering 137(2), ASCE, 2013, pp. 275-283.
2. Y. C., Kim, Y, Tamura, and A., Yoshida,
“Shielding effects on wind force correlations and quasi-static wind load combinations for low-rise building in large group”, Journal of Wind Engineering and Industrial Aerodynamics 112, 2013, pp. 58-70.