1. INTRODUCTION
Research on a navigation safety system started from 1983 in order to cope with rapidly increasing air traffic volume in the future air navigation system. In particular, a study on Communication, navigation, surveillance/air traffic management among navigation safety systems has been actively conducted (Sajatovic et al. 2005, Lin et al. 2014).
The ground surveillance system in the aviation monitoring field can be divided into cooperative and non-cooperative systems according to whether inter-cooperation is performed between airplane and ground station as shown in Fig. 1 (Chang & Lee 2017).
In order to increase the resolution of positioning
Performance Analysis of Pulse Positioning Using Adaptive Threshold Detector (ATD)
Jae Won Chang
1†, Sang Jeong Lee
21
Avionics Research Team, Korea Aerospace Research Institute, Daejeon 34133, Korea
2
Department of Electronics Engineering, Chungnam National University, Daejeon 34134, Korea
ABSTRACT
This paper describes the measurement of pulse positioning (input time) to calculate a time of arrival (TOA) that takes from transmitting a signal from the target of multilateration (MLAT) system to receiving the signal at the receiver. In this regard, this paper analyzes performances of simple threshold method and level adjust system (LAS) method, which is one of the adaptive threshold detector (ATD) methods, among many methods to calculate pulse positioning of signal received at the receiver. To this end, Cramer-rao lower bound (CRLB) with regard to pulse positioning, which was measured when signals transmitted from a transponder mounted at the target were received at the receiver, was induced and then deviation sizes with regard to pulse positioning, which was measured with simple threshold and LAS methods through MATLAB simulations, were compared. Next, problems occurring according to a difference in amplitude of signals inputted to each receiver are described when pulse positioning is measured at multiple receivers located at a different distance from the target as is the case in the MLAT system. Furthermore, LAS method to resolve the problems is explained. Lastly, this study analyzes whether a pulse positioning error occurring due to the signal noise satisfies the requirement (6 nsec. or lower) recommended for the MLAT system when using these two methods.
Keywords: multilateration, pulse positioning, adaptive threshold detector
information of targets supplied by the secondary surveillance radar, which is an independent cooperative surveillance system currently used in airports, a multilateration (MLAT) system has been applied to aviation monitoring systems. MLAT is a system that calculates a position of target using a hyperbola or hyperboloid positioning method. A MLAT measures a time of arrival
Received July 24, 2017 Revised Aug 14, 2017 Accepted Aug 18, 2017
†
Corresponding Author E-mail: [email protected]
Tel: +82-42-860-2946 Fax: +82-42-870-3598 Fig. 1. Category of ground surveillance system.
(TOA) value by receiving signals, which are transmitted periodically or non-periodically from a transponder mounted at airplanes, at four or more ground receivers positioned and installed precisely. The TOA value is used to calculate a position of airplane by means of time difference of arrival (TDOA) among the receivers at the central processing system. To increase the positioning accuracy of the MLAT, it is required to accurately measure a TOA of signal that is received at the receiver after being transmitted from the transponder. A transponder transmits a pulse waveform according to whether or not data is available, and a receiver measures an input time of the received pulse waveform. A radar system, which is one of the measurement devices of target position, utilizes a simple threshold, adaptive threshold detector (ATD), and matched filter methods to measure an input time of pulse waveform (Torrieri 1997). In the radar system, a simple threshold that employs only comparator and ATD method that uses a delay have been utilized to determine the transmission time of waveform and detect an input time of waveform received after being reflected from the target. Although the MLAT does not transmit electric waves to the target, it can also apply a simple threshold and ATD methods to determine an input time of the received waveform as used in radars. This paper calculated the Cramer-rao lower bound (CRLB) and analyzed the simulation results when the threshold method was applied to measure an input time of the received signals in the MLAT system. Furthermore, problems of simple threshold method were presented, and a level adjust system (LAS), which is one of the ATD methods, is explained.
Moreover, simulation results using LAS are compared with those of CRLB.
2. MULTILATERATION SYSTEM
2.1 Configuration of Multilateration System
The MLAT refers to an aviation surveillance system that measures locations of airplanes and ground vehicles by acquiring signals, which are transmitted from transponders mounted at airplanes and 1090ES emitters mounted at ground vehicles, at multiple receivers located at precisely measured positions on the ground. A 1090 extended squitter (ES) employs 1090 MHz frequency, which is the same with the frequency used in transponders mounted in airplanes.
It is a device that transmits signals periodically even without additional interrogation from the interrogating transmitter located on the ground. It attaches to a ground moving vehicle to measure a position of the vehicle in an airport using MLAT.
The configuration of the MLAT that detects a position of airplanes and ground vehicles is shown in Fig. 2 (Kim &
Chang 2013).
As shown in Fig. 2, the MLAT system consists of multiple
receiving units (RUs), central processing system (CPS),
reference and monitoring transponder (RMT), control
and monitoring system, external interface unit (EIU),
and interrogating transmitter (ITX). Among them, an RU
receives signals from a transponder mounted in an airplane,
measures a TOA of signals based on the local time, and
Fig. 2. Multilateration system configuration.
transmits the information to the CPS. The CPS calculates the TOA of signal transmitted from multiple RUs, and identifies and tracks the position of target using the TDOA algorithm.
The RMT is used for time synchronization at each of the RUs by transmitting signals. Since the CPS knows the locations of the RMT and RUs, it calculates a difference in information about time-tagging of the RMT measured at the RUs, thereby correcting a time difference error to perform time synchronization. The EIU plays a role in transmitting data to external users. The ITX transmits interrogations to induce a response from the transponder mounted in an airplane. The ITX in MLAT is not used if a separate ITX is available in the configuration of the aviation monitoring system in airports. This MLAT is called passive MLAT.
2.2 Requirement of TOA at the RU in the MLAT System
The requirement of TOA measurement of RUs in MLAT applied in this paper is to calculate a position of pulse waveform of a transponder transmitted from the same target within 8 nsec. A standard deviation σ
τof TOA at the RU of MLAT occurs largely due to errors caused by signal-noise ratio (SNR) of received signals, errors caused by quantization of RUs, and errors caused by time synchronization. It can be expressed via Eq. (1).
2 2 2
2
clkSNR q
τ
σ = σ + σ + σ (1)
where σ
SNRrefers to an error occurring due to SNR, σ
qrefers to an error due to quantization of RUs, and σ
clkrefers to an error due to TDOA time synchronization.
To calculate an error due to quantization of RUs, it was assumed that a quantization noise was uniformly distributed in an interval of [-Δt/2, Δt/2] when a step increment of quantization was Δ t regardless of sample time. A mean of quantization noise is zero, and noise power of quantization that is the square of the error due to quantization can be expressed via Eq. (2).
/2 2
2 2 2 2
( )
/212
t
q t
MSE E q q f q dq q dq t
σ
∞ ∆−∞ −∆
∆
= = = ∫ = ∫ = (2)
where Δt refers to a quantization time (sample time), in which Δt is 10 nsec because RU is quantized at 100 MHz. Here, the error σ
qdue to quantization of RUs is approximately 2.9 nsec.
The error σ
clkdue to TDOA time synchronization can vary depending on which time synchronization method is used.
If time synchronization is performed using the RMT, σ
clkis in a range of 1 to 6 nsec. In the development requirement of this study, σ
clkwas set to 5 nsec.
The error σ
SNRdue to SNR can be calculated via Eq. (3).
2 2
2 2
8 2.9
2 25 43.09 6.5 nsec
2
clk2
SNR τ q
σ = σ − σ − σ = − − = ≈ (3)
Thus, the pulse positioning error requirement of pulse waveform generated by signal noise of MLAT RUs was set to 6 nsec or lower.
2.3 Transponder Pulse Waveform
Mode S signal, which is a transmission signal of transponder, consists of preamble and data blocks. A Fig. 3. The signal flame of mode S transponder.
Fig. 4. Detail structure of the pulse of mode S transponder.
preamble is composed of four sequential pulses, and data blocks follow the modulation method according to binary pulse location of 1Mega/s data. Fig. 3 shows the structure of signal data transmitted from the Mode S transponder. The detailed structure of a single pulse in Fig. 3 is shown in Fig. 4.
A transmission signal of transponder should satisfy rise time, duration time, and decay time of pulse waveforms defined by the Surveillance and Collision Avoidance Systems, which are found in Volume IV of Annex 10 Aeronautical Telecommunications in the International Civil Aviation Organization.
This paper implemented a pulse waveform generator that can change rise time, duration time, decay time, signal
size, and SNR using MATLAB for simulations of pulse positioning.
3. PULSE POSITIONING
3.1 Measure of Pulse Positioning
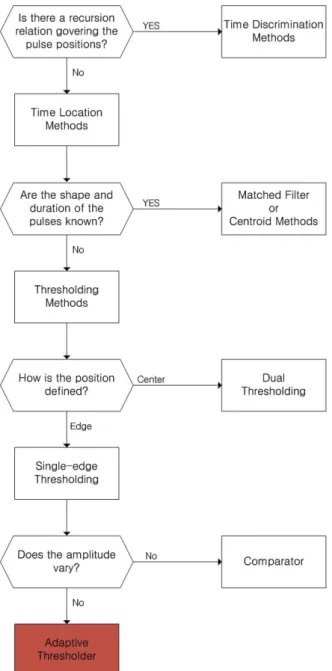
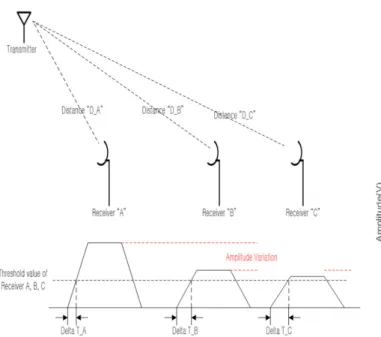
A method that determines a pulse position, which is an input time of pulse waveform to RUs, follows the logical flow, as shown in Fig. 5 (Torrieri 1997).
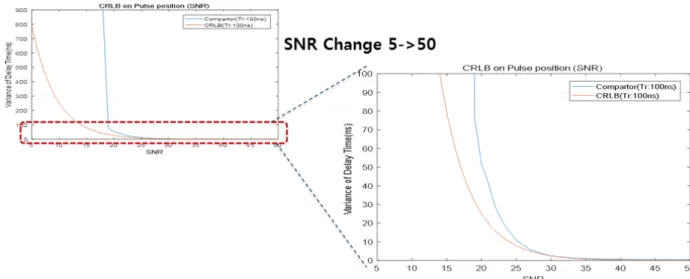
Fig. 5 explains that pulse position can be measured using a matched filter if the shape and length of the received pulse is known in advance. Without pre-known information about received pulse, a threshold method using a threshold can be used. Assuming that the amplitude of received signal is the same among RUs, a single-edge thresholding method, which is a simple thresholding method, can be used. However, the amplitude of received signal at RUs, which have a different separation distance from that of transponder that transmits signals as is the case in MLAT, may be measured differently at each of the RUs. To determine a position of pulse whose amplitude is variable, ATD using an adaptive thresholder should be applied. This paper compared and analyzed the performance of simple threshold method, one of the single-edge thresholding methods to which only simple comparator was applied, and LAS, one of the ATD methods.
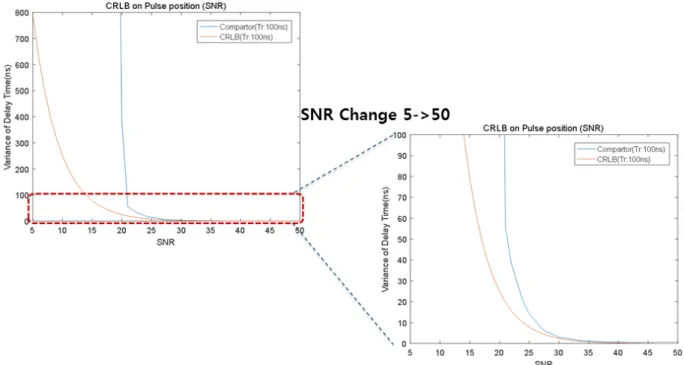
3.2 CRLB for Pulse Positioning
The CRLB means a minimum variance of estimation that is probabilistically distributed. The CRLB for pulse positioning is presented in Eq. (4).
2 2
2
1 1
CRLB
-E ln ( ; ) E τ ln ( ; ) p x τ τ p x τ
= =
∂ ∂
∂ ∂
(4)
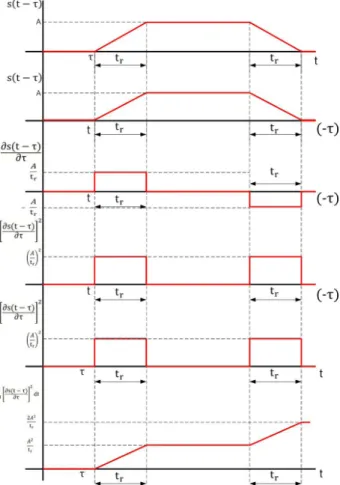
As shown in Fig. 6, Gaussian noise whose mean was zero and standard deviation was σ was used to calculate the minimum variance value of delay time of noise-added pulse signal at the pulse position using the CRLB.
The minimum variance value calculated from the CRLB is the inverse of the fisher information, which is calculated by conditional probability of double partial derivative value or square of partial derivative after putting a natural logarithm to the likelihood function. Thus, a likelihood function with respect to delayed pulse position τ from the probability density function whose mean is zero and standard deviation is σ can be calculated using Eq. (5) (McDonough & Whalen 2007).
Fig. 5. Flow chart of pulse position determination.
{ }2
2 ( ) ( )
1
2pdf ( ; ) 2
x t s t
x e
τ
τ
σπσ
− −
=
−(5)
The CRLB of pulse position calculated via Eq. (5) is presented in Eq. (6).
2 2
2 2 2
2
ˆ 1 CRLB var( )
ln pdf ( ; )
1
( )
1 ( )
E x
s t s t dt
E
τ τ
τ
σ τ τ
σ τ τ
= ≥
∂
− ∂
= =
∂ − ∂ −
∂ ∂
∫ (6)
To calculate Eq. (6) that acquires the CRLB from pulse signals input to the RU of MLAT, pulse signals were assumed and explained, as shown in Fig. 7.
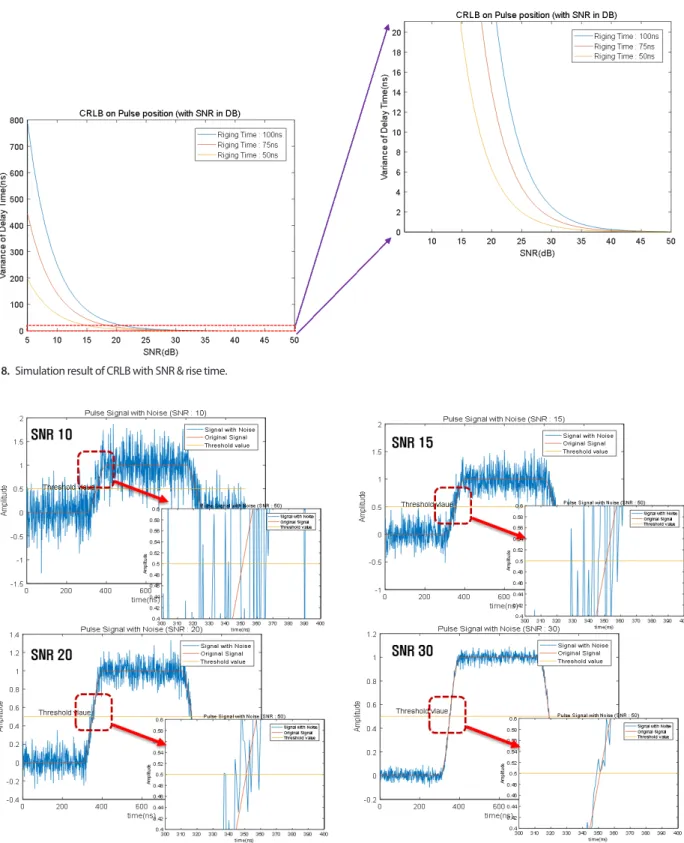
The CRLB of pulse position measured at the RU of MLAT in Fig. 7 can be calculated via Eq. (7) (Bensky 2016).
2 2 2
2 2
2
ˆ CRLB var( )
2 4 4
( : , : , : )
r r r
r