INTRODUCTION
CT has been the main imaging modality for the detection, characterization and follow-up of lung nodules, and lung nodules are the major radiologic fi nding of primary and metastatic lung cancers. These tasks have traditionally been performed by a combination of visual assessment and manual measurement by radiologists; however, the advances in CT technology in recent years have enabled newer and better performance in this endeavor with the development
A Computer-Aided Diagnosis for Evaluating Lung
Nodules on Chest CT: the Current Status and Perspective
Jin Mo Goo, MD
Department of Radiology, Seoul National University College of Medicine and the Institute of Radiation Medicine, Seoul National University Medical Research Center, Seoul 110-744, Korea
As the detection and characterization of lung nodules are of paramount importance in thoracic radiology, various tools for making a computer-aided diagnosis (CAD) have been developed to improve the diagnostic performance of radiologists in clinical practice. Numerous studies over the years have shown that the CAD system can effectively help readers identify more nodules. Moreover, nodule malignancy and the response of malignant lung tumors to treatment can also be assessed using nodule volumetry. CAD also has the potential to objectively analyze the morphology of nodules and enhance the workflow during the assessment of follow-up studies. Therefore, understanding the current status and limitations of CAD for evaluating lung nodules is essential to effectively apply CAD in clinical practice.
Index terms: Computed tomography (CT); Lung nodule; Computer-aided diagnosis; Volumetry; Follow-up
Received August 13, 2010; accepted after revision September 16, 2010.
This study was supported by grant #10888 from the Seoul R & BD program.
Corresponding author: Jin Mo Goo, MD, Department of Radiology, Seoul National University Hospital, 101 Daehang-ro, Jongno-gu, Seoul 110-744, Korea.
• Tel: (822) 2072-2624 • Fax: (822) 743-7418
• E-mail: [email protected]
This is an Open Access article distributed under the terms of the Creative Commons Attribution Non-Commercial License (http://creativecommons.org/licenses/by-nc/3.0) which permits unrestricted non-commercial use, distribution, and reproduction in any medium, provided the original work is properly cited.
pISSN 1229-6929 · eISSN 2005-8330 Korean J Radiol 2011;12(2):145-155
of 3D volumetric imaging as well as numerous post- processing techniques. Further, with the advent of picture archiving and communication systems (PACS), access to digital images is now easier and faster than ever before.
This unprecedented wealth of digital images has led to the development of computer-aided diagnosis (CAD) for the evaluation of lung nodules.
A good indication for applying CAD can be seen in the use of low-dose CT during lung cancer screening, which is typically a repetitive and burdensome task of dealing with mostly normal images. As a large proportion of the nodules detected on screening CT are smaller than 4 mm in diameter and most of them are benign, determining the malignancy of nodules by nodule characterization is crucial.
Nodule growth, which is expressed as the volume doubling time, can be an important discriminator for this purpose. In addition to the screening setting, CAD can also be applied to various oncologic settings for identifying metastatic lung nodules as well as monitoring the therapy for lung metastasis.
The goals of CAD for the evaluation of lung nodules
are to assist radiologists in detecting lung nodules,
differentiating benign from malignant nodules, monitoring the treatment response and enhancing the workfl ow. The purpose of this article is to review the current status of CAD in the evaluation of lung nodules and to suggest its future directions.
Nodule Detection
Computer-Aided Diagnosis Performance
In terms of spatial and contrast resolution, CT is currently the best imaging modality for evaluating lung nodules.
However, lung nodules on chest CT, and especially those smaller than 5 mm, can easily be missed by the reader when using visual assessment alone. CAD has been shown in many
studies to be able to improve radiologists’ performance for detecting these lung nodules (1-7) (Fig. 1). Many investigators have reported a wide range of sensitivities using CAD from 54% to 95% with false positive rates of 0.55 to 8.3 per examination for detecting lung nodules (3-4, 6-13) (Table 1). However, it is diffi cult to compare the results of CAD’s performance from the various studies as most of the performances were evaluated with different data sets, and particularly a different size database, the different nature and characteristics of the nodules and various evaluation methods, as well as the differences in the employed CAD algorithm. In addition, the standard of reference for the presence of nodule in most previous studies was usually determined by an expert panel, and this
Fig. 1. Snapshot of computer-aided diagnosis output for lung nodule.
Detected nodule is marked with circle, and information about nodule size is present in bottom of left panel. Magnifi ed views of detected nodule are presented in right panel with color overlay to show segmentation results.
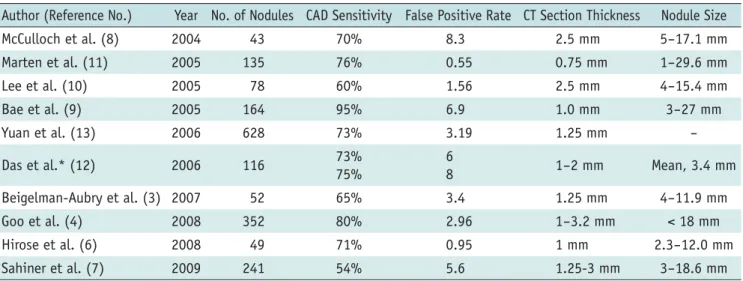
Table 1. Summary of Published Studies on Performance of CAD Systems for Detecting Lung Nodules
Author (Reference No.) Year No. of Nodules CAD Sensitivity False Positive Rate CT Section Thickness Nodule Size
McCulloch et al. (8) 2004 43 70% 8.3 2.5 mm 5-17.1 mm
Marten et al. (11) 2005 135 76% 0.55 0.75 mm 1-29.6 mm
Lee et al. (10) 2005 78 60% 1.56 2.5 mm 4-15.4 mm
Bae et al. (9) 2005 164 95% 6.9 1.0 mm 3-27 mm
Yuan et al. (13) 2006 628 73% 3.19 1.25 mm -
Das et al.* (12) 2006 116 73%
75%
6
8 1-2 mm Mean, 3.4 mm
Beigelman-Aubry et al. (3) 2007 52 65% 3.4 1.25 mm 4-11.9 mm
Goo et al. (4) 2008 352 80% 2.96 1-3.2 mm < 18 mm
Hirose et al. (6) 2008 49 71% 0.95 1 mm 2.3-12.0 mm
Sahiner et al. (7) 2009 241 54% 5.6 1.25-3 mm 3-18.6 mm
Note.— *Two CAD systems were evaluated using same dataset. CAD = computer-aided diagnosis, No. = number
determination may be subjective. Substantial variability has been reported in establishing a “truth” reference for identifying nodules on CT scans (14).
The scan and reconstruction parameters of CT and the number of false positive detections are also important factors. In general, the sensitivity can be increased at the cost of increasing the number of false positive detections.
Das et al. (12) compared the effects of two commercial CAD systems with using the same dataset, and the overall sensitivities for each system were 73% and 75% with false positive rates of 6% and 8%, respectively.
There have been several studies that have compared the performance of radiologists and CAD (11, 15). These studies have shown that the CAD system performs the nodule detection task differently from that of a radiologist. In a study by Lee et al. (15), the sensitivity of the CAD system for detecting isolated nodules was signifi cantly higher than that of a radiologist, while the sensitivities of a radiologist for detecting nodules > 5 mm and nodules attached to other structures were higher than those of the CAD system.
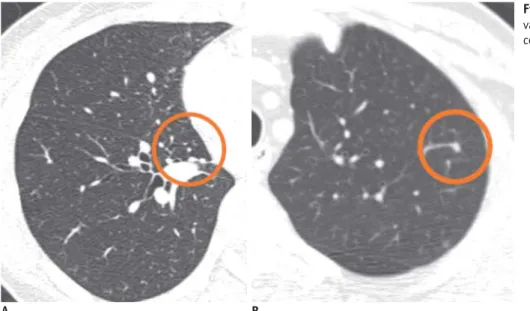
Similarly, Marten et al. (11) showed that detection of nodules 5 mm or less in diameter was signifi cantly higher for a CAD system than that for readers. In addition, while the CAD system detected more nodules that were without vascular attachment, the readers detected more nodules with vascular attachment (Fig. 2). If we may sum up these fi ndings, in general, a CAD system is good at detecting isolated and small nodules, while radiologists are better at detecting attached and relatively larger nodules.
It has been shown that for detecting nodules, CAD can assist observers more effectively than a second reader, and
therefore the combined performance of radiologists with CAD may be better than that of a double reading. In one such study by Rubin et al. (16), the mean sensitivity for an individual reading was 50% and a double reading resulted in an increase to 63%. Yet with CAD, by setting a threshold of three false positive detections per CT scan, the mean sensitivity was able to be increased to 76%.
However, high sensitivity has been known to be highly related to the number of false positive markings. As rejecting the numerous false positive markings generated by the CAD system is time consuming, the number of false positive markings should always be a consideration.
Although there is no consensus on the acceptable false positive rate, fi ve or less false positive detections per case would be acceptable because the false positive marks when detecting lung nodule with CAD are usually easy to reject.
Various features may cause a false positive marking such as scars, bronchial wall thickening, vessel bifurcations, motion artifacts and inadequate segmentation of the mediastinal structures (Fig. 3).
As for the time required to perform CAD, in a study by Beigelman-Aubry et al. (3), the overall reading time on the CAD workstation and the clinical workstation was comparable. The average time required to assess all the CAD marks per case was 39 seconds (3) and most of the CAD false marks could be easily dismissed. The average reading time per CAD mark is usually between 5 to 8 seconds (3, 16).
Detection of Malignant Nodules
The ultimate task of CAD in the detection of lung nodules
A B
Fig. 2. Examples of isolated (A) and vascular-attached (B) nodules detected by computer-aided diagnosis system.
is whether this approach can enhance the observers’
performance for detecting malignant lung nodules (17). Li et al. (18) performed an observer study to evaluate whether a CAD scheme can help radiologists detect the peripheral lung cancers missed at low-dose CT and they showed that the use of CAD could improve radiologists’ performance for detecting subtle cancers. In that study, 17 cases with missed peripheral lung cancer and 10 control cases were included. The cases with coexisting benign nodules were excluded. When CAD was applied in the patients who underwent metastasectomy, the sensitivity increased signifi cantly from 86-91% to 94-95% for detecting malignant nodules (5). In another study by Goo et al. (4), the effect of CAD on the observer’s performance using a database that included normal cases, benign nodule cases and cases with lung cancers was evaluated. The database consisted of 150 CT scans that included 352 nodules and 23 lung cancers. The readers were asked to record the likelihood of the presence of a nodule and the likelihood of malignancy separately. This study showed that the use of CAD contributed to the detection of additional lung cancers by less experienced readers. Yet on the statistical analysis, while the detection of nodule was signifi cantly increased, the cancer detection rate was not signifi cantly increased. These results indicate that another scheme of characterization in addition to nodule detection may be necessary to achieve the ultimate goal of detecting malignant nodules.
Scanning and Reconstruction Parameters of CT Scanning Several technical aspects of CT scanning are related to the performance of CAD. The use of a narrow collimation with reconstructions of thin sections signifi cantly improves the detection of nodule, and CAD is not recommended for CTs 4 mm or greater in section thickness (19, 20).
Another technical aspect to consider is the effect of radiation exposure on automated lung nodule detection with using ultra-low-dose CT (21, 22). In a study by Lee et al. (21), 25 volunteers underwent CT scans using four different tube currents of 32, 16, 8, and 4 mAs. Although the sensitivities for detecting nodule decreased with reducing the tube currents, there were no signifi cant differences in nodule detectability between the scans at 16 mAs or 8 mAs versus those at 32 mAs. Hein et al. (22) also compared the performance of two CAD systems at different CT levels of 75 mAs and 5 mAs. For both CAD systems there were no signifi cant differences between the detection rates for the standard and ultra-low-dose data sets.
Mode of Computer-Aided Diagnosis Reading
There are several ways to use CAD: as a fi rst reader, as a second reader and as a concurrent reader. Because the sensitivity of the current CAD systems is not quite good enough, if radiologists only reviewed the CAD marks, then many nodules can be missed. So, this option of using CAD as a fi rst reader cannot be considered for clinical practice at this time. As a concurrent reader (reading the CT scans with CAD marks displayed), it may be able to help save time,
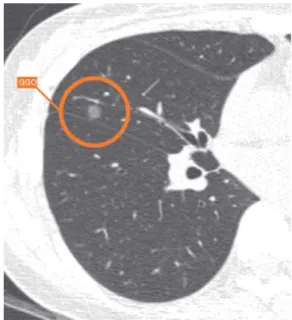
Fig. 4. Example of ground-glass nodule detected by computer- aided diagnosis system.
Fig. 3. Example of false-positive detection by computer-aided diagnosis due to mucus within bronchus.
but some nodules can still be missed. As discussed above, many studies have shown increased observer performance by using a CAD system as a second reader. In a study by Beyer et al. (23), the sensitivity of reading with CAD as a second reader was signifi cantly higher than that with reading without CAD or with CAD as a concurrent reader, although the reading time was signifi cantly shorter for the concurrent reading (274 seconds) as compared to that with reading without CAD (294 seconds) and that with CAD as a second reader (337 seconds). Given the overall moderate sensitivities of the CAD systems that are currently available, it is clear that CAD should be considered only as a second reader.
Detection of Ground-Glass Nodules
The likelihood of malignancy for ground-glass nodules (GGN) is much higher than that for solid nodules. In a study by Henschke et al. (24), 63% of the partly solid nodules and 18% of the nonsolid nodules were malignant as oppose to only 7% of the solid nodules. Despite this
clinical signifi cance, detecting GGNs is not an easy task due to their low contrast compared to the background. In addition, in the early developing stages of CAD, most CAD schemes were solely focused on detecting solid nodules. The fi rst CAD scheme for the automated detection of GGNs was reported by Kim et al. (25), and those researchers used the texture features and Gaussian curve fi tting features. More recently, Yanagawa et al. (26) evaluated the performance of a commercial CAD system for the detection of GGNs, and the sensitivity of GGN for radiologists (60-80%) was signifi cantly higher than that for the CAD system (21%).
Currently, the CAD system can only play a complementary role in detecting GGNs (Fig. 4).
Nodule Volumetry
Prediction of Nodule Malignancy
Computer-aided volumetry provides more accurate and reproducible measurement of nodules than does human observation for predicting the likelihood of malignancy and
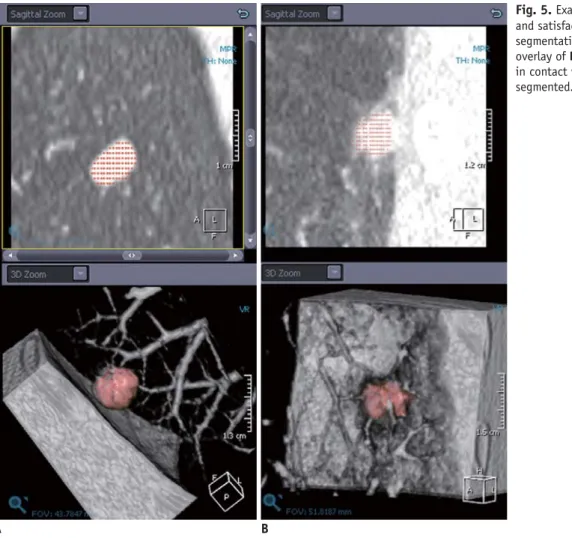
A B
Fig. 5. Examples of excellent (A) and satisfactory but not perfect (B) segmentation in nodule volumetry. Color overlay of B shows that part of nodule in contact with pleura is incompletely segmented.
for monitoring the response of the tumor to treatment.
Although the number of cases was small, it has been suggested that nodule malignancy could be identifi ed based on the changes of the nodule volume. In a study by Yankelevitz et al. (27), all fi ve malignant nodules out of 13 nodules that were evaluated showed doubling times less than 177 days, and in a study by Revel et al. (28), nine malignant nodules among the 22 evaluated nodules showed a doubling time ranging from 37 to 216 days. In a separate study that evaluated 63 nodules, when the upper value of 500 days for the doubling time of malignancy was applied, the sensitivity and specifi city of the volumetric software for diagnosing malignancy were 91% and 90%, respectively (29). This study stressed that automated nodule volumetry provided a high negative predictive value of 98% for the diagnosis of malignant lung nodules.
Sources of Measurement Variability
After much early enthusiasm, many studies have revealed that there are many sources of variability in volumetric measurements, including the size and characteristics of nodules, the scan and reconstruction parameters of the CT examinations and the patient-related factors.
The estimate of nodule volume was then based on the total number of voxels within the segmented region. It can be predicted that the percentage of partial volume voxels decreases as the nodule size increases and as the section thickness decreases. For relatively small nodules that have no contact with the surrounding structures, section thickness is one of the most important factors because by decreasing the section thickness the partial volume effect of the surface voxels of a nodule is decreased.
Therefore, obtaining CT scans with thin volumetric data is very important for nodule volumetry. Many studies have demonstrated that section thickness has a signifi cant effect on nodule volumetry (30-35). In a phantom study by Goo et al. (30), statistically signifi cant effects could be demonstrated for the segmentation threshold, the section thickness and the interaction of the threshold and section thickness. The effect of the fi eld of view was not reported to be signifi cant on volumetric measurements in several studies (30, 35, 36).
Nodule size is an important factor in determining measurement error as smaller nodules have a larger proportion of surface voxels, which result in an increased number of voxels that are affected by the partial volume effect. In a phantom study, the absolute percentage of
error of nodule volumetry progressively increased with the decreasing nodule size (30). A similar effect of increased variability in volumetric measurement for decreasing nodule size was also reported in clinical studies (33).
As the size of the nodule increases, the nodules
eventually grow to come into contact with the surrounding vessels and pleura. The resulting nodule attachment makes it diffi cult to accurately defi ne a nodule’s boundaries and therefore to segment a nodule from the background.
Segmentation of a nodule from the adjacent structures can be challenging and it may lead to differences in a nodule’s volume. In a phantom study by Das et al. (32), the absolute percentage of volume error for pleural nodules was very high compared to that for other types of nodules. Even for expert radiologists, there was considerable variability on how to draw the boundary of a nodule, with the interobserver variability accounting for 40% of the total volume variability (37). In a study by de Hoop et al. (38), the segmentation accuracy was evaluated using six software packages for nodule volumetry. When a threshold of 20%
in volume for the maximum mismatch between the overlay provided by a software package and the visual assessment was applied, the software packages provided adequate segmentation for 71% to 86% of the nodules.
With regard to radiation exposure, two studies that compared the measurement error between low-dose and standard-dose techniques showed different results (32, 39).
While the bias error was signifi cantly smaller for a 120 mAs scan than that for a 20 mAs scan in a study by Ko et al. (39), a study by Das et al. (32) showed no signifi cant effect on the volumetric measurement error between the low-dose (20 mAs) and standard-dose (100 mAs) protocols.
Volumetric measurements of lung nodules can be signifi cantly affected by changes in the lung volume (40, 41). A study by Goo et al. (40) showed that the mean percent difference in lung nodule volume was 23% between the CT scans obtained at inspiration and expiration. In another study, a 17% mean change in lung nodule volume was observed between the CT scans obtained at the total lung capacity and at the residual volume (41). Although the differences in the lung volumes on the inspiration and expiration scans used in those studies are larger than those typically expected on routine follow-up clinical CT scans, respiration-related variability in measurements should also be a consideration in determining the true growth of a lung nodule.
When six software packages for nodule volumetry were
compared using the same dataset, there were signifi cant systemic differences of the mean volumes in 11 of the 15 possible pairs of software packages (38). Therefore, the absolute nodule volumes provided by different software should not be compared.
Range of Measurement Variability
Because obtaining ground truth on nodule volume in vivo is a diffi cult task, research has been focused on evaluating the precision or reproducibility of such measurements, or whether a true change of the nodule volume can be determined.
In an early phantom study, the measurement variability for a synthetic nodule volume was reported to be as small as 3% (27). Yet in that study, the target nodules were solid, homogeneous, synthetic nodules without vascular attachment and they had a mean attenuation of 175 HU (Hounsfi eld unit). Measuring this variability is hard to do in an in vivo study. In a study that evaluated stable nodules during a 2-year observation period, the standard measurement error in nodules 2-5 mm, 5-8 mm and 8-10 mm in size was 19%, 11% and 7%, respectively (42).
Based on these results, Kostis et al. (42) suggested that the critical time to perform follow-up for nodules with initial sizes of 2, 5, 8 and 10 mm as detected at baseline screening should be 12, 5, 3 and 1 month, respectively.
Furthermore, as the measured difference includes both the true nodule change and variability due to measurement errors, the most essential question may be how we can identify the threshold for classifying the changes in volume as being medically meaningful. To address the issue of measurement variability, several studies that employed a same-day repeat CT protocol in patients with lung nodules (38, 43-46) have been conducted (Table 2). In one study, Wormanns et al. (43) reported that the 95% limits of
agreement were -20% to 22%, and the subsequent studies showed that the 95% confi dence intervals for the difference in measured volumes were up to 26%. These results indicate that an increase in measured volume by 25% has a 95%
likelihood of refl ecting true nodule growth rather than measurement variability.
Volumetry in Assessing the Response to Treatment Assessing the response to treatment has remained predominantly qualitative with performing manual
measurements on a single two-dimensional image. However, it has been suggested that changes in tumor volume could be detected more sensitively than the changes in the conventional unidimensional measurements after targeted therapy for lung cancer (47). With regard to the accurate assessment of tumor response to therapy in clinical trials, inaccuracy in the manual measurements of tumor dimensions has been shown to signifi cantly infl uence the assessment of tumor response (48). Thus, a comparison between automated volumetry and manual measurements was performed by Marten et al. (49) and in their study, while there were no discrepancies of the assessments of patients’ response between the observers and the readings using volumetry, 24% of the patients received discordant response classifi cations when manual measurements were used.
The use of quantitative volumetric CT may be able to reduce the number of total subjects enrolled in a clinical trial and the length of time an individual needs to be followed to reliably establish the treatment response by increasing the analytic power per subject enrolled in clinical trials (50).
Volume Measurement of Ground-Glass Nodules Most of the reported volumetric methods have been
Table 2. Summary of Published Interscan Variability of Same-Day CT Scans for Making Volumetric Measurements Author (Reference No.) Year No. of Nodules Mean Nodule Size
†Section Thickness 95% Limit of Agreement
Wormanns et al. (43) 2004 151 7.4 mm (2.2-20.5 mm) 1.25 mm -20~22%
Goodman et al. (45) 2006 43 345.5 mm
3(49.3-1434 mm
3) 1.25 mm -26~26%
Gietema et al. (46) 2007 218 123 mm
3(16.4-472.7 mm
3) 1 mm -21~24%
de Hoop et al. (38) 2009 214 10.9 mm (3.3-30 mm) 1 mm 16~22%*
Zhao et al. (44) 2009 32 38.2 mm (10.6-92.7 mm) 1.25 mm -12~13%
Note.— *Upper limits of agreements from six software packages. †numbers in parentheses are size range. No. = number
focused on solid lung nodules and not on GGNs due to the low contrast of GGNs compared to that of the lung parenchyma. As such, the absolute volumetric error values for GGNs are known to be higher than that for solid nodules (39). Only a few studies regarding the volumetry of GGNs have been reported thus far due to the diffi culty of measuring the volume of GGNs. When computer-aided volumetry was applied to nodules 8 mm or larger, the 95%
limits of intraobserver agreement for the measurement of the same nodules were from 15% to 17% and those for the interobserver agreement were up to 24% (51). The interscan variability of nodule volumetry for GGNs in a same-day repeat CT study was reported to be up to 19% (52).
In addition, as tumors manifesting as GGNs show lepidic growth (53), determining the growth of GGNs based on the conventional diameter or volume measurements may not be appropriate. A different approach for determining the growth of GGN has recently been proposed. In one such phantom study, Lee et al. (54) reported that the amount of soft tissue of a nodule (volume × [1 + mean attenuation value/1000]) showed a strong correlation with the reference-standard amount of soft tissue. In a clinical evaluation study, de Hoop et al. (38) also reported that GGN mass measurements showed the smallest measurement variability compared to of the diameter and volume measurements. This mass measurement method was suggested to detect the growth of GGN earlier (425 days) than that of the diameter (715 days) or volume measurements (673 days).
Application of Nodule Volumetry in Screening Trials In the NELSON (Nederlands-Leuvens Longkanker Screenings Onderzoek) randomized lung cancer screening trial, the nodule management protocol was based on volumetric nodule assessment and the presence or absence of growth (55). Based on the studies in which the measurement variation was evaluated on the same day CT scans (43, 45, 46), growth was defi ned as an increase in volume of at least 25% between the two scans. In the case of partly solid nodules, only the volume of the solid region was used. In the cases of pleural-based nodules, the diameter was measured at a point perpendicular to the costal pleura. A test was considered to be positive if a solid component of a nodule was more than 500 mm
3(> 9.8 mm in diameter). If the solid component of a nodule was 50 to 500 mm
3(4.6 to 9.8 mm in diameter), then the volume doubling time was calculated with a 3-month follow-up CT
scan, and if the volume-doubling time was less than 400 days, then the nodule was considered to be positive.
Morphologic Analysis of Lung Nodules
Conventionally, the likelihood of a nodule being malignant is usually suggested according to visual assessment by experienced radiologists through morphologic analysis of the nodule. In a study that evaluated 80 GGNs, the CT predictors of malignancy for GGNs included a size greater than 8 mm and a lobulated border for pure GGNs, and only a lobulated border for mixed GGNs (56). Studies that focused on observer performance have been conducted to evaluate whether computerized schemes can help radiologists distinguish benign from malignant nodules on CT (57, 58). In a study by Li et al. (57), the computerized output generated from 56 morphologic features and two clinical datasets were provided to 16 radiologists, and their performance was improved with the aid of the CAD scheme. In another study by Awai et al. (58), the computerized output was generated from the morphologic features of density, shape, the calcifi cation volume and the cavity volume, and the use of the CAD system signifi cantly improved the diagnostic performance of radiology residents, while it did not improve that of the board-certifi ed radiologists for assessing the malignancy of lung nodules.
Follow-Up Registration and Nodule Matching
Comparison of serial CT scans to evaluate the growth
and shrinkage of lung nodules is a routine clinical task
in chest radiology. This process is typically performed by
manually matching two series of images and it is quite time
consuming. On the basis of the improved registration of
images, automated computer assessment may provide the
opportunity to rapidly identify and compare nodules over
time to detect changes in size. Lee et al. (59) evaluated the
performance of automated matching software for patients
with metastatic lung nodules by using two serial CT scans
with a 5-mm section thickness. The overall matching rate
was 67%, and the matching rate was highly associated with
changes in the lung confi guration between two series of
CT scans. The matching rate was higher (82%) for patients
with a relatively unchanged lung confi guration, compared
to that (29%) for patients with substantial interval changes
(59). In screening settings, the interval change of the lung
confi guration is usually less than that in oncologic settings,
and the matching rates were reported to be 91% to 93% (3, 60).
Summary and Perspective
The goal of CAD is to improve the radiologic interpretation of nodules, and many studies to date have shown that CAD can indeed improve radiologists’ performance for detecting lung nodules and that CAD should be used as a second reader. It also has been shown that nodule malignancy and the response of malignant lung tumors to treatment can be assessed by using nodule volumetry and that CAD has the potential to provide objective analysis of the nodule morphology and thereby enhance the workfl ow when assessing follow-up studies.
From a technical point of view, the application of CAD systems for nodule detection and volumetry should be performed using thin-section volumetric CT datasets. CT scans should also be obtained with the same protocol that is used for the nodule volumetry, and experts should carefully review the segmentation results (Fig. 5). As most clinicians are not familiar with quantitative results that are expressed as volumes, nodule size also needs to be reported as the effective diameter. An algorithm may be taken into consideration to predict the optimal time to wait for the follow-up scan according to the size of a nodule. Furthermore, every radiologist who clinically uses a CAD scheme should remember that CAD schemes do indeed miss lung nodules and there is considerable variability in computer-aided volumetry. Although only the CAD applications in nodule evaluation were discussed in this review article, by using the volumetric CT data and CAD schemes, a global approach when performing chest imaging is possible. Applying CAD to the assessment of the extent of emphysema and the airway dimensions as well as nodule evaluation is an example of using CAD in a lung cancer screening setting or for patient with chronic obstructive lung disease. CAD outputs can serve as important imaging biomarkers and they should be interpreted within the clinical context. Systems that support clinical decision making, such as using the clinical data and molecular biomarkers in addition to the computerized output based on imaging data, will surely be developed in the near future.
Although many studies have been performed to identify the potential application of CAD to chest CT, these efforts have not reached the stage of daily routine use in the clinical fi eld. The performance of CAD still needs to be
further improved for detecting nodules. In addition, streamlining the workfl ow in CAD is important and a CAD workstation needs to start processing as soon as the CT data is generated. Subsequent integration of the data into a PACS can greatly enhance the radiologists’ workfl ow (17), and a thin-client approach in which computing is performed in a separate server may be a potential solution.
Although many obstacles remain to be overcome, CAD will eventually serve as an everyday tool for the interpretation of chest CT images. To achieve this goal, it is necessary not only to develop better CAD algorithms, but also to investigate how we can apply and optimize the effect of the computer output in clinical practice.
REFERENCES
1. Goo JM, Lee JW, Lee HJ, Kim S, Kim JH, Im JG. Automated lung nodule detection at low-dose CT: preliminary experience.
Korean J Radiol 2003;4:211-216
2. Awai K, Murao K, Ozawa A, Komi M, Hayakawa H, Hori S, et al. Pulmonary nodules at chest CT: effect of computer-aided diagnosis on radiologists’ detection performance. Radiology 2004;230:347-352
3. Beigelman-Aubry C, Raffy P, Yang W, Castellino RA, Grenier PA. Computer-aided detection of solid lung nodules on follow- up MDCT screening: evaluation of detection, tracking, and reading time. AJR Am J Roentgenol 2007;189:948-955 4. Goo JM, Kim HY, Lee JW, Lee HJ, Lee CH, Lee KW, et al. Is
the computer-aided detection scheme for lung nodule also useful in detecting lung cancer? J Comput Assist Tomogr 2008;32:570-575
5. Park EA, Goo JM, Lee JW, Kang CH, Lee HJ, Lee CH, et al.
Effi cacy of computer-aided detection system and thin-slab maximum intensity projection technique in the detection of pulmonary nodules in patients with resected metastases.
Invest Radiol 2009;44:105-113
6. Hirose T, Nitta N, Shiraishi J, Nagatani Y, Takahashi M, Murata K. Evaluation of computer-aided diagnosis (CAD) software for the detection of lung nodules on multidetector row computed tomography (MDCT): JAFROC study for the improvement in radiologists’ diagnostic accuracy. Acad Radiol 2008;15:1505- 1512
7. Sahiner B, Chan HP, Hadjiiski LM, Cascade PN, Kazerooni EA, Chughtai AR, et al. Effect of CAD on radiologists’ detection of lung nodules on thoracic CT scans: analysis of an observer performance study by nodule size. Acad Radiol 2009;16:1518- 1530
8. McCulloch CC, Kaucic RA, Mendonça PR, Walter DJ, Avila RS. Model-based detection of lung nodules in computed tomography exams. Thoracic computer-aided diagnosis. Acad Radiol 2004;11:258-266
9. Bae KT, Kim JS, Na YH, Kim KG, Kim JH. Pulmonary nodules:
automated detection on CT images with morphologic matching algorithm--preliminary results. Radiology 2005;236:286-293 10. Lee IJ, Gamsu G, Czum J, Wu N, Johnson R, Chakrapani S.
Lung nodule detection on chest CT: evaluation of a computer- aided detection (CAD) system. Korean J Radiol 2005;6:89-93 11. Marten K, Engelke C, Seyfarth T, Grillhösl A, Obenauer S,
Rummeny EJ. Computer-aided detection of pulmonary nodules:
infl uence of nodule characteristics on detection performance.
Clin Radiol 2005;60:196-206
12. Das M, Mühlenbruch G, Mahnken AH, Flohr TG, Gündel L, Stanzel S, et al. Small pulmonary nodules: effect of two computer-aided detection systems on radiologist performance.
Radiology 2006;241:564-571
13. Yuan R, Vos PM, Cooperberg PL. Computer-aided detection in screening CT for pulmonary nodules. AJR Am J Roentgenol 2006;186:1280-1287
14. Armato SG 3rd, McLennan G, McNitt-Gray MF, Meyer CR, Yankelevitz D, Aberle DR, et al. Lung image database consortium: developing a resource for the medical imaging research community. Radiology 2004;232:739-748
15. Lee JW, Goo JM, Lee HJ, Kim JH, Kim S, Kim YT. The potential contribution of a computer-aided detection system for lung nodule detection in multidetector row computed tomography.
Invest Radiol 2004;39:649-655
16. Rubin GD, Lyo JK, Paik DS, Sherbondy AJ, Chow LC, Leung AN, et al. Pulmonary nodules on multi-detector row CT scans:
performance comparison of radiologists and computer-aided detection. Radiology 2005;234:274-283
17. Goo JM. Computer-aided detection of lung nodules on chest CT: issues to be solved before clinical use. Korean J Radiol 2005;6:62-63
18. Li F, Arimura H, Suzuki K, Shiraishi J, Li Q, Abe H, et al.
Computer-aided detection of peripheral lung cancers missed at CT: ROC analyses without and with localization. Radiology 2005;237:684-690
19. Kim JS, Kim JH, Cho G, Bae KT. Automated detection of pulmonary nodules on CT images: effect of section thickness and reconstruction interval--initial results. Radiology 2005;236:295-299
20. Marten K, Grillhösl A, Seyfarth T, Obenauer S, Rummeny EJ, Engelke C. Computer-assisted detection of pulmonary nodules: evaluation of diagnostic performance using an expert knowledge-based detection system with variable reconstruction slice thickness settings. Eur Radiol 2005;15:203-212
21. Lee JY, Chung MJ, Yi CA, Lee KS. Ultra-low-dose MDCT of the chest: infl uence on automated lung nodule detection. Korean J Radiol 2008;9:95-101
22. Hein PA, Rogalla P, Klessen C, Lembcke A, Romano VC.
Computer-aided pulmonary nodule detection - performance of two CAD systems at different CT dose levels. Rofo 2009;181:1056-1064
23. Beyer F, Zierott L, Fallenberg EM, Juergens KU, Stoeckel J, Heindel W, et al. Comparison of sensitivity and reading time for the use of computer-aided detection (CAD) of pulmonary
nodules at MDCT as concurrent or second reader. Eur Radiol 2007;17:2941-2947
24. Henschke CI, Yankelevitz DF, Mirtcheva R, McGuinness G, McCauley D, Miettinen OS. CT screening for lung cancer:
frequency and signifi cance of part-solid and nonsolid nodules.
AJR Am J Roentgenol 2002;178:1053-1057
25. Kim KG, Goo JM, Kim JH, Lee HJ, Min BG, Bae KT, et al.
Computer-aided diagnosis of localized ground-glass opacity in the lung at CT: initial experience. Radiology 2005;237:657- 661
26. Yanagawa M, Honda O, Yoshida S, Ono Y, Inoue A, Daimon T, et al. Commercially available computer-aided detection system for pulmonary nodules on thin-section images using 64 detectors-row CT: preliminary study of 48 cases. Acad Radiol 2009;16:924-933
27. Yankelevitz DF, Reeves AP, Kostis WJ, Zhao B, Henschke CI.
Small pulmonary nodules: volumetrically determined growth rates based on CT evaluation. Radiology 2000;217:251-256 28. Revel MP, Lefort C, Bissery A, Bienvenu M, Aycard L, Chatellier
G, et al. Pulmonary nodules: preliminary experience with three-dimensional evaluation. Radiology 2004;231:459-466 29. Revel MP, Merlin A, Peyrard S, Triki R, Couchon S, Chatellier
G, et al. Software volumetric evaluation of doubling times for differentiating benign versus malignant pulmonary nodules.
AJR Am J Roentgenol 2006;187:135-142
30. Goo JM, Tongdee T, Tongdee R, Yeo K, Hildebolt CF, Bae KT. Volumetric measurement of synthetic lung nodules with multi-detector row CT: effect of various image reconstruction parameters and segmentation thresholds on measurement accuracy. Radiology 2005;235:850-856
31. Zhao B, Schwartz LH, Moskowitz CS, Wang L, Ginsberg MS, Cooper CA, et al. Pulmonary metastases: effect of CT section thickness on measurement--initial experience. Radiology 2005;234:934-939
32. Das M, Ley-Zaporozhan J, Gietema HA, Czech A, Mühlenbruch G, Mahnken AH, et al. Accuracy of automated volumetry of pulmonary nodules across different multislice CT scanners. Eur Radiol 2007;17:1979-1984
33. Petrou M, Quint LE, Nan B, Baker LH. Pulmonary nodule volumetric measurement variability as a function of CT slice thickness and nodule morphology. AJR Am J Roentgenol 2007;188:306-312
34. Kuhnigk JM, Dicken V, Bornemann L, Bakai A, Wormanns D, Krass S, et al. Morphological segmentation and partial volume analysis for volumetry of solid pulmonary lesions in thoracic CT scans. IEEE Trans Med Imaging 2006;25:417-434
35. Ravenel JG, Leue WM, Nietert PJ, Miller JV, Taylor KK, Silvestri GA. Pulmonary nodule volume: effects of reconstruction parameters on automated measurements--a phantom study.
Radiology 2008;247:400-408
36. Honda O, Sumikawa H, Johkoh T, Tomiyama N, Mihara N, Inoue A, et al. Computer-assisted lung nodule volumetry from multi-detector row CT: infl uence of image reconstruction parameters. Eur J Radiol 2007;62:106-113
37. Meyer CR, Johnson TD, McLennan G, Aberle DR, Kazerooni
EA, Macmahon H, et al. Evaluation of lung MDCT nodule annotation across radiologists and methods. Acad Radiol 2006;13:1254-1265
38. de Hoop B, Gietema H, van Ginneken B, Zanen P, Groenewegen G, Prokop M. A comparison of six software packages for evaluation of solid lung nodules using semi-automated volumetry: what is the minimum increase in size to detect growth in repeated CT examinations. Eur Radiol 2009;19:800- 808
39. Ko JP, Rusinek H, Jacobs EL, Babb JS, Betke M, McGuinness G, et al. Small pulmonary nodules: volume measurement at chest CT--phantom study. Radiology 2003;228:864-870
40. Goo JM, Kim KG, Gierada DS, Castro M, Bae KT. Volumetric measurements of lung nodules with multi-detector row CT:
effect of changes in lung volume. Korean J Radiol 2006;7:243- 248
41. Petkovska I, Brown MS, Goldin JG, Kim HJ, McNitt-Gray MF, Abtin FG, et al. The effect of lung volume on nodule size on CT. Acad Radiol 2007;14:476-485
42. Kostis WJ, Yankelevitz DF, Reeves AP, Fluture SC, Henschke CI.
Small pulmonary nodules: reproducibility of three-dimensional volumetric measurement and estimation of time to follow-up CT. Radiology 2004;231:446-452
43. Wormanns D, Kohl G, Klotz E, Marheine A, Beyer F, Heindel W, et al. Volumetric measurements of pulmonary nodules at multi-row detector CT: in vivo reproducibility. Eur Radiol 2004;14:86-92
44. Zhao B, James LP, Moskowitz CS, Guo P, Ginsberg MS, Lefkowitz RA, et al. Evaluating variability in tumor
measurements from same-day repeat CT scans of patients with non-small cell lung cancer. Radiology 2009;252:263-272 45. Goodman LR, Gulsun M, Washington L, Nagy PG, Piacsek KL.
Inherent variability of CT lung nodule measurements in vivo using semiautomated volumetric measurements. AJR Am J Roentgenol 2006;186:989-994
46. Gietema HA, Schaefer-Prokop CM, Mali WP, Groenewegen G, Prokop M. Pulmonary nodules: interscan variability of semiautomated volume measurements with multisection CT-- infl uence of inspiration level, nodule size, and segmentation performance. Radiology 2007;245:888-894
47. Zhao B, Schwartz LH, Moskowitz CS, Ginsberg MS, Rizvi NA, Kris MG. Lung cancer: computerized quantifi cation of tumor response--initial results. Radiology 2006;241:892-898 48. Erasmus JJ, Gladish GW, Broemeling L, Sabloff BS, Truong MT,
Herbst RS, et al. Interobserver and intraobserver variability in measurement of non-small-cell carcinoma lung lesions:
implications for assessment of tumor response. J Clin Oncol 2003;21:2574-2582
49. Marten K, Auer F, Schmidt S, Kohl G, Rummeny EJ, Engelke C. Inadequacy of manual measurements compared to automated CT volumetry in assessment of treatment response of pulmonary metastases using RECIST criteria. Eur Radiol 2006;16:781-790
50. Buckler AJ, Mulshine JL, Gottlieb R, Zhao B, Mozley PD, Schwartz L. The use of volumetric CT as an imaging biomarker in lung cancer. Acad Radiol 2010;17:100-106
51. Oda S, Awai K, Murao K, Ozawa A, Yanaga Y, Kawanaka K, et al. Computer-aided volumetry of pulmonary nodules exhibiting ground-glass opacity at MDCT. AJR Am J Roentgenol 2010;194:398-406
52. Park CM, Goo JM, Lee HJ, Kim KG, Kang MJ, Shin YH.
Persistent pure ground-glass nodules in the lung: interscan variability of semiautomated volume and attenuation measurements. AJR Am J Roentgenol 2010;195:W408-W414 53. Park CM, Goo JM, Lee HJ, Lee CH, Chun EJ, Im JG. Nodular
ground-glass opacity at thin-section CT: histologic correlation and evaluation of change at follow-up. Radiographics 2007;27:391-408
54. Lee KW, Im JG, Kim TJ, Dae CM. A new method of measuring the amount of soft tissue in pulmonary ground-glass opacity nodules: a phantom study. Korean J Radiol 2008;9:219-225 55. van Klaveren RJ, Oudkerk M, Prokop M, Scholten ET, Nackaerts
K, Vernhout R, et al. Management of lung nodules detected by volume CT scanning. N Engl J Med 2009;361:2221-2229 56. Lee HJ, Goo JM, Lee CH, Park CM, Kim KG, Park EA, et
al. Predictive CT fi ndings of malignancy in ground-glass nodules on thin-section chest CT: the effects on radiologist performance. Eur Radiol 2009;19:552-560
57. Li F, Aoyama M, Shiraishi J, Abe H, Li Q, Suzuki K, et al.
Radiologists’ performance for differentiating benign from malignant lung nodules on high-resolution CT using computer- estimated likelihood of malignancy. AJR Am J Roentgenol 2004;183:1209-1215
58. Awai K, Murao K, Ozawa A, Nakayama Y, Nakaura T, Liu D, et al. Pulmonary nodules: estimation of malignancy at thin- section helical CT--effect of computer-aided diagnosis on performance of radiologists. Radiology 2006;239:276-284 59. Lee KW, Kim M, Gierada DS, Bae KT. Performance of a
computer-aided program for automated matching of
metastatic pulmonary nodules detected on follow-up chest CT.
AJR Am J Roentgenol 2007;189:1077-1081
60. Tao C, Gierada DS, Zhu F, Pilgram TK, Wang JH, Bae KT.
Automated matching of pulmonary nodules: evaluation in serial screening chest CT. AJR Am J Roentgenol 2009;192:624- 628