• 검색 결과가 없습니다.

Both endurance- and resistance-type exercise prevents neurodegeneration and cognitive decline in mice with impaired glucose tolerance

N/A
N/A
Protected

Academic year: 2021

Share "Both endurance- and resistance-type exercise prevents neurodegeneration and cognitive decline in mice with impaired glucose tolerance"

Copied!
9
0
0

로드 중.... (전체 텍스트 보기)

전체 글

(1)

http://dx.doi.org/10.12925/jkocs.2019.36.3.804

Both endurance- and resistance-type exercise prevents neurodegeneration and cognitive decline in mice with

impaired glucose tolerance

Jinhee, Woo

1

․Ki-Ok, Shin

1

․Chan-Ho, Park

2

․Byung-Kon, Yoon

3

Do-Yeon, Kim

4

․Ju-Yong, Bae

1

․Yul-Hyo, Lee

1

․Kangeun, Ko

1

․Hee-Tae, Roh

1,✝

1

Department of Physical Education, College of Arts and Physical Education, Dong-A University, Busan, Republic of Korea

2

Department of Leisure and Sport, Dong-Eui University, Busan, Republic of Korea

3

Department of Physical Education, Dong-Eui University, Busan, Republic of Korea

4

Department of Physical Education, Pusan National University, Busan, Republic of Korea (Received August 31, 2019; Revised September 13, 2019; Accepted September 17, 2019)

Abstract : The purpose of this study was to investigate the effects of different types of exercise training on neurodegeneration and cognitive function in mice with impaired glucose tolerance (IGT).

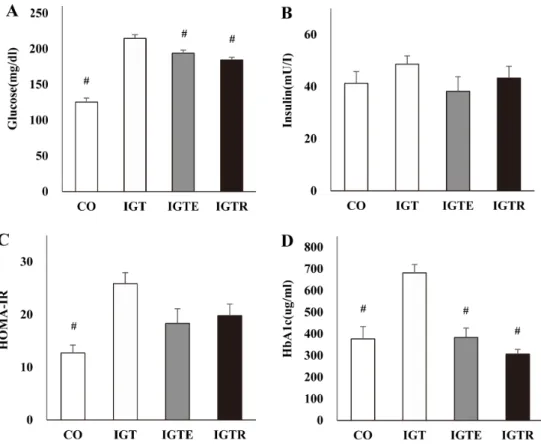
Thirty-six male C57BL/6 mice were randomly assigned to the control (CO, n = 9) and impaired glucose tolerance (IGT, n = 27) groups. The IGT group consumed 45% high fat diet for 4 weeks and received 40 mg/kg of streptozotocin twice in the lower abdomen to induce IGT. After the IGT induction period, the IGT group was subdivided into IGT + sedentary (IGT, n = 9), IGT + endurance exercise (IGTE, n = 9), and IGT + resistance exercise (IGTR, n = 9). The IGTE and IGTR groups performed treadmill and ladder climbing exercises 5 times per week for 8 weeks, respectively.

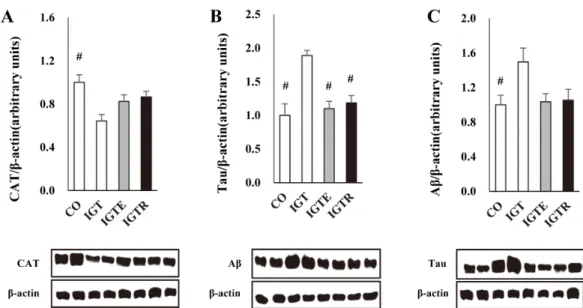
Fasting glucose and glycated hemoglobin (HbA1c) levels were significantly higher in IGT group than in CO, IGTE, and IGTR groups ( p < 0.05). HOMA-IR was significantly higher in IGT group than CO group ( p < 0.05). Hippocampal catalase (CAT) was significantly lower in IGT group than in CO group ( p < 0.05), while beta-amyloid (Aβ) was significantly higher in IGT group than in CO group ( p < 0.05). Hippocampal tau was significantly higher in IGT group than in CO, IGTE, and IGTR groups ( p < 0.05). The Y-maze test performance for cognitive function was significantly lower in IGT group than in CO, IGTE, and IGTR groups ( p <0.05). These results suggest that IGT induces neurodegeneration and negatively affects cognitive function, while regular exercise may be effective in alleviating neurodegeneration and cognitive decline regardless of exercise type.

Keywords: exercise type, impaired glucose tolerance, antioxidant capacity, neurodegeneration, cognition



Corresponding author

(E-mail: [email protected])

(2)

1. Introduction

Diabetes is a global epidemic demonstrating a rapid increase in prevalence and incidence rates in both developed and developing countries [1]. Diabetes not only induces acceleration of neurodegeneration and cognitive impairment, but contributes directly and indirectly to dementia, including Alzheimer's disease [2,3,4].

Oxidative stress (OS) has been proposed to be the main factor in neurodegeneration and decreased brain function in diabetes [5,6].

Specifically, one of the common symptoms of diabetes, hyperglycemia, leads to the production of reactive oxygen species (ROS) through various biochemical signal transduction pathways, such as glucose autoxidation, increased production of advanced glycation end products (AGEs), and the polyol pathway, which in turn leads to increased OS in various tissues [6,7]. Production of excess OS is strongly related to apoptosis and inhibition of neuron formation in the hippocampus [5,8].

Knott et al. (2008) reported that high levels of ROS production in neurons leads to changes in structure and function of cellular mitochondria due to OS, inducing the development of neurodegenerative disease(s) [9]. OS, which is increased in diabetes, induces the accumulation of beta-amyloid (Aβ), which leads to neurodegeneration [5]. An increase in AGEs was reported to increase the half-life of Aβ, allowing it to accumulate in neurons, which can cause microvascular brain lesion(s) and the development of dementia [10]. Furthermore, diabetes and diabetic complications increase glucose concentration, leading to glycation reactions in which glucose reacts with the amino groups of proteins. Son et al. (2004) reported that reacting a glycation propagator, such as glyoxal or methylglyoxal, with catalase (CAT), an antioxidant enzyme, resulted in the loss of activation and structural changes in CAT, suggesting that diabetes can negatively affect the antioxidant system in the

body [11].

On the other hand, regular exercise training is not only effective in preventing and treating diabetes, but has been proposed to have positive effects in enhancing brain function, as well as reducing OS levels by increasing the activity of antioxidant enzymes, such as superoxide dismutase, CAT, and glutathione peroxidase. However, most previous studies reported that such findings were limited due to a focus on aerobic exercise, while others have been limited in investigating prediabetic models to identify independent effects of exercise, despite previous reports suggesting the presence of impaired neurocognitive function in pre-diabetes, such as impaired glucose tolerance (IGT) or impaired fasting glucose (IFG). Therefore, the purpose of this study was to verify the effects of different exercise types on neurodegeneration and cognitive function in a mouse model of IGT.

2. Methods

2.1. Animals

Four-week-old C57BL/6 mice were used in this study. Four mice were housed per cage in the Dong-A University College of Medicine Animal Laboratory. The laboratory conditions were maintained constant: 55% relative humidity, 22 ± 2 ℃, and a 12-h dark–light cycle. The animal experiments were approved by the Dong-A University Medical School Institutional Animal Care and Use Committee, and all procedures were performed in accordance with the committee guidelines.

2.2. IGT induction and exercise intervention

Mice were divided into a normal diet

control group (CO [ n = 9]) and an IGT

group ( n = 27) at 32 weeks of age. Animals

in the IGT group were fed a high-fat diet

(35% carbohydrate, 20% protein, and 45% fat)

for 4 weeks to induce IGT. At 36 weeks,

streptozotocin (Sigma Chemical, USA) dissolved

(3)

in 0.1 M sodium citrate solution (pH 4.5) was injected in the lower abdomen at 40 mg/kg after a fast of 6 h, twice over a 2-day period.

To confirm IGT induction, blood extracted from the tail vein was measured using a GlucoDr glucometer (All Medicus, Korea);

mice with a fasting glucose level of 180–250 mg/dL were defined as IGT. In contrast, mice in the CO group were fed a normal diet (69.41% carbohydrate, 24.34% protein, and 6.25% fat) for 4 weeks. Mice with IGT were divided into the following groups at 37 weeks of age: IGT + sedentary (IGT [ n = 9], not subjected to an exercise program); and IGT +  endurance exercise (IGTE [ n = 9]), and IGT +  resistance exercise (IGTR [ n = 9], which were subjected to 8-week endurance exercise and resistance exercise programs, respectively. The IGTE group was subjected to treadmill running for 40 min/day, 5 days/week, for 8 weeks.

For warm-up and warm-down exercise, the mice ran for 5 min at 5 m/min, while the main exercise of 30 min was running at 8 m/min for 1–4 weeks, followed by gradual increase from 8 m/min to 10 m/min for 5–8 weeks. For resistance exercise, the protocol described by Sanches et al. (2014) [12], involving 8 weeks of ladder exercise (slope, 80°) 5 days/week, was adopted. To test exercise tolerance, the animals were prompted to climb up a ladder with a weight pendulum of 75% of their weight on their tails. If the mouse could climb to the top, the weight pendulum of 15% of its weight was increased each time to evaluate 1RM. Based on the results, exercise intensity at approximately 50%

of 1RM was used for each round of exercise for a total of 8 repetitions of climbing.

2.3. Cognitive function measurement Cognitive function was assessed using the Y-maze test. The Y-maze consists of three arms and each arm (5 cm wide, 35 cm length, and 10 cm height) was designated as A, B, and C, respectively. Each mouse was placed at the tip of the arm and allowed to move the

maze for 5 minutes per session. The shift action for three different arms is calculated as follows: Alternation behavior (%) = [number of entries in the other direction / (total number of entries – 2) × 100]

2.4. Blood and tissue sampling

Blood and tissue samples were acquired 48 h after the end of exercise to rule out the transient effects of the exercise in the case of the IGTE and IGTR groups. During the sampling, the feed supply was stopped 12 h before sampling but water supply continued.

All laboratory animals were anesthetized with ethyl ether and the blood samples were collected from the abdominal inferior vena cava, and then the hippocampus was extracted. The samples were immediately frozen in liquid nitrogen and stored at -80 ℃.

2.5. Blood and tissue protein level analysis The glucose level was estimated using a GlucoDr glucometer (Allmedicus, Korea). The analysis of glycated hemoglobin (HbA1c) and insulin levels were carried out using an ELISA kit for glycated hemoglobin A1c (CEA190Mu, Cloud-Clone Corp., China) and an ELISA kit for insulin (CEA448Mu, Cloud-Clone Corp., China), respectively. Insulin resistance index was assessed by homeostasis model assessment estimate of insulin resistance (HOMA-IR) as follows: HOMA-IR = Fasting insulin (μ IU/mL) × Fasting glucose (mg/dL) / 405. As previously described [13], the hippocampus tissues were lysed in 200 μl radioimmunoprecipitation assay (RIPA) buffer to extract protein from the samples. The tissue was homogenized and centrifuged for 30 min at 14,000 rpm. The protein concentration of the supernatant was measured using the BCA protein assay kit (PIERCE, USA). Samples of equal protein content were resolved by SDS-polyacrylamide gel electrophoresis on a 10 or 12% gel and transferred to a membrane.

The membrane was blocked with 5% skim

milk in phosphate-buffered saline (PBS), and

(4)

Fig. 1. The glycemic control related parameters for the four groups after intervention.

Data are presented as mean ± SE. CO: control; IGT: IGT + sedentary; IGTE:

IGT + endurance exercise; IGTR: IGT + resistance exercise;

#

versus IGT group ( p <

0.05)

subsequently incubated at 4 ℃ overnight with primary antibodies (1:1000 dilution) against CAT (sc-271803, Santa Cruz Biotechnology), Aβ (sc-28365, Santa Cruz Biotechnology), and tau (sc-32274, Santa Cruz Biotechnology).

The membrane was incubated with goat anti-mouse or anti-rabbit IgG conjugated secondary antibody for 1 h at room temperature. The signal was developed with an ECL solution (Amersham Pharmacia Biotech, USA) and visualized with ImageQuant

TM

LAS-4000 system (GE Healthcare, Sweden).

2.6. Statistical analysis

The data were analyzed using SPSS windows version 24.0 software (SPSS Inc., USA), and all

measurements were presented as the means ± standard error (SE). One-way ANOVA was used to verify the inter-group differences in the blood components and the results of tissue analysis. When statistical significance was evident, Tukey's post-hoc analysis was carried out. Statistical significance was set as ⍺ = 0.05.

3. Results

The glycemic control related parameters for

the four groups after intervention are shown in

Fig. 1. Fasting glucose and glycated

hemoglobin (HbA1c) levels were significantly

higher in the IGT group than in the CO,

(5)

Fig. 2. The CAT and neurodegeneration related parameters for the four groups after intervention.

Data are presented as mean ± SE. CO: control; IGT: IGT + sedentary; IGTE: IGT +  endurance exercise; IGTR: IGT + resistance exercise;

#

versus IGT group ( p < 0.05)

IGTE, and IGTR groups ( p < 0.05), while insulin levels were not significantly different among the groups ( p > 0.05). In addition, homeostasis model assessment estimate of insulin resistance (HOMA-IR) was significantly higher in the IGT group than in the CO group ( p < 0.05).

The catalase (CAT) and neurodegeneration related parameters for the four groups after intervention are shown in Fig. 2. Hippocampal CAT was significantly lower in the IGT group than in the CO group ( p < 0.05), while beta-amyloid (Aβ) was significantly higher in the IGT group than in the CO group ( p <

0.05). Hippocampal tau was significantly higher in the IGT group th an in the CO, IGTE, and IGTR groups ( p < 0.05).

The cognitive function for the four groups after intervention are shown in Fig. 3. Y-maze test performance was significantly lower in the IGT group than in the CO, IGTE, and IGTR groups ( p < 0.05).

Fig. 3. The cognitive function for the four groups after intervention. Data are presented as mean ± SE. CO:

control; IGT: IGT + sedentary; IGTE:

IGT + endurance exercise; IGTR: IGT +  resistance exercise;

#

versus IGT group ( p < 0.05)

4. Discussion

Physical inactivity is the primary risk factor

for metabolic syndromes, such as obesity, high

(6)

blood pressure and type 2 diabetes mellitus (T2DM), and has been confirmed in various epidemiological and prospective studies [14,15,16]. In particular, T2DM occurs over a long prodromal stage, representatively in IFG and/or IGT; thus, active glycemic control through exercise intervention during this stage can be an important strategy to prevent T2DM [14,17]. In this study, glucose, glycated hemoglobin (HbA1c), and insulin levels were analyzed and homeostasis model assessment estimate of insulin resistance (HOMA-IR) was measured to verify changes in variables related to glycemic control according to IGT and different exercise type. According to our results, the IGTE and IGTR groups exhibited significantly lower glucose and HbA1c levels compared with the IGT group. This suggests that endurance and resistance exercise were both effective for glycemic control, and also re-confirms previous studies investigating the effectiveness of various types of exercise in lowering blood glucose and HbA1c levels in prediabetes, as well as in patients with diabetes [18,19,20]. Quílez Llopiz et al. (2015) systematically reviewed 14 studies that investigated the effects of exercise on glycemic control in T2DM patients and reported that exercise interventions, such as aerobic exercise and resistance exercise, and/or combination of the two, all resulted in effective glycemic control [19]. A meta-analysis by Nery et al.

(2017), however, reported no difference between the two types of exercise (i.e., aerobic versus resistance exercise) in significantly improving HbA1c, low-density lipoprotein cholesterol, triglycerides, and total cholesterol levels [20]. However, there was no significant change in insulin and HOMA-IR according to exercise type. This could be explained by the low intensity of the exercise intervention. Ku et al. (2009) divided T2DM patients into moderate intensity (3.6–5.2 metabolic equivalents [METs]) and vigorous intensity (>

5.3 METs) groups and treated them with exercise therapy for 12 weeks to identify

changes in insulin resistance according to exercise intensity. The results revealed that only vigorous exercise intensity resulted in improved insulin resistance, suggesting that changes in insulin resistance are dependent on exercise intensity [21]. Therefore, future studies need to use higher intensities of exercise intervention to verify this hypothesis.

Brain tissue has many neurons and contains high levels of unsaturated fatty acids that can easily be oxidized, and, with a weak anti-oxidation defense system and high concentration of non-heme iron that acts as catalyst for the production of ROS, the brain is easily exposed to OS in disease(s) involving high blood glucose levels such as diabetes [22].

In this study, levels of the antioxidant enzyme CAT in the hippocampus were measured to verify the antioxidant status of the brain according to IGT and different types of exercise. The results revealed significantly higher levels in the IGT group compared with the CO group, although there was no significant difference according to exercise type.

This result suggests that high glucose levels due to IGT negatively affected antioxidant capacity. Furthermore, considering a previous study that reported an association between CAT up-regulation and exercise volume [23], there is a need to conduct future studies using increased exercise volume.

Recent studies [24,25,26] have suggested a strong association between T2DM and neurodegenerative diseases, such as Alzheimer’s disease, in which high Aβ and tau protein accumulation phenomena were observed in both diseases. Although the exact mechanism is unclear, T2DM can exacerbate neurodegenerative processes [23] and, moreover, induce cognitive decline [26].

Roberts et al. (2014) reported an association

between diabetes/IGT and mild cognitive

impairment [27]. In this study, Aβ and tau

protein in the hippocampus were analyzed to

verify variables related to neurodegeneration

and changes in cognitive ability according to

(7)

IGT and different types of exercise, followed by the Y-maze test. The results revealed significantly high Aβ levels in the hippocampus in the IGT group compared with the CO group, while tau levels were significantly lower in the CO, IGTE, and IGTR groups compared with the IGT group.

Furthermore, results of the Y-maze test to evaluate cognitive function revealed significantly higher levels in the CO, IGTE, and IGTR groups compared with the IGT group. This result suggests that IGT in the pre-diabetic stage can induce neurodegeneration by the accumulation of Aβ and tau protein in the hippocampus, while endurance and resistance exercise can effectively reduce neurodegeneration and cognitive decline, in which significant decrease in glucose and HbA1c through exercise may act as important factors. Hyperglycemia in animal model experiments can lead to Aβ accumulation in the brain [26], and high glucose levels reportedly induce hyperphosphorylation of tau protein [28].

Furthermore, these results are supported by a report that higher HbA1c levels are a risk factor for cognitive dysfunction [29].

5. Conclusion

In conclusion, impaired glucose tolerance (IGT) induces neurodegeneration and negatively affects cognitive function, while regular exercise may be effective in alleviating neurodegeneration and cognitive decline regardless of exercise type. In future studies, it is necessary to develop an exercise program to prevent progression to type 2 diabetes at high risk stages such as IGT by applying various exercise intensity and/or exercise volumes as well as exercise type.

Acknowledgment

This work was supported by the Ministry of Education of the Republic of Korea and the National Research Foundation of Korea (NRF-2015S1A5A2A03048932).

References

1. B. C. Heng, D. Aubel, M. Fussenegger,

“Prosthetic gene networks as an alternative to standard pharmacotherapies for metabolic disorders” Curr Opin Biotechnol, Vol.35, pp. 37-45, (2015).

2. G. Verdile, S. J. Fuller, R. N. Martins,

"The role of type 2 diabetes in neurodegeneration" Neurobiol Dis, Vol.84, pp. 22-38, (2015).

3. P. S. Koekkoek, L. J. Kappelle, E. van den Berg, G. E. Rutten, G. J. Biessels,

"Cognitive function in patients with diabetes mellitus: guidance for daily care"

Lancet Neurol, Vol.14, No.3 pp. 329-340, (2015).

4. G. R. Sridhar, G. Lakshmi, G. Nagamani,

"Emerging links between type 2 diabetes and Alzheimer's disease" World J Diabetes, Vol.6, No.5 pp. 744-751, (2015).

5. C. A. Cobb, M. P. Cole, "Oxidative and nitrative stress in neurodegeneration"

Neurobiol Dis, Vol.84, pp. 4-21, (2015).

6. S. Tangvarasittichai, "Oxidative stress, insulin resistance, dyslipidemia and type 2 diabetes mellitus" World J Diabetes, Vol.6, No.3 pp. 456-480 (2015).

7. B. H. Kim, S. M. Son, "Mechanism of Developing Diabetic Vascular Complication by Oxidative Stress" Endocrinol Metab, Vol.21, No.6 pp. 448-459, (2006).

8. J. H. Yoon, Y. Kim, I. Jeong, H. H. Lee,

"The effects of exercise intensity difference

on cell proliferation and dant enzymes in

dentate gyrus of hippocampus in aging

F344 rats" KJGD, Vol.13, No.2 pp. 83-93,

(2005).

(8)

9. A. B. Knott, G. Perkins, R.

Schwarzenbacher, E. Bossy-Wetzel,

"Mitochondrial fragmentation in neurodegeneration" Nat Rev Neurosci, Vol.9, No.7 pp. 505-518, (2008).

10. Y. Sawikr, N. S. Yarla, I. Peluso, A. A.

Kamal, G. Aliev, A. Bishayee,"

Neuroinflammation in Alzheimer's Disease:

The Preventive and Therapeutic Potential of Polyphenolic Nutraceuticals" Adv Protein Chem Struct Biol, Vol.108, pp.

33-57, (2017).

11. T. G. Son, Y. S. Kwak, Y. W. Jin,

"Increased DNA Damage Induced by Glycation Propagator" J Life Sci, Vol.14, No.3 pp. 406-410, (2004).

12. I. C. Sanches, F. F. Conti, M. Sartori, M.

C. Irigoyen, K. De Angelis,

"Standardization of resistance exercise training: effects in diabetic ovariectomized rats" Int J Sports Med, Vol.35, No.4 pp.

323-329, (2014).

13. J. Y. Bae, "Aerobic Exercise Increases Meteorin-Like Protein in Muscle and Adipose Tissue of Chronic High-Fat Diet-Induced Obese Mice" Biomed Res Int, Vol.2018, pp. 1-9, (2018).

14. C. H. Kim, "Role of Exercise in Prevention of Type 2 Diabetes" J Korean Diabetes, Vol.12, pp. 29-32, (2011).

15. D. E. Laaksonen, H. M. Lakka, J. T.

Salonen, L. K. Niskanen, R. Rauramaa, T.

A. Lakka, "Low levels of leisure-time physical activity and cardiorespiratory fitness predict development of the metabolic syndrome" Diabetes Care, Vol.25, pp. 1612-1618, (2002).

16. F. B. B Hu, T. Y. Li, G. A. Colditz, W.

C. Willett, J. E. Manson, "Television watching and other sedentary behaviors in relation to risk of obesity and type 2 diabetes mellitus in women" JAMA, Vol.289, pp. 1785-1791, (2003).

17. X. Zhang, H. M. Devlin, B. Smith, G.

Imperatore, W. Thomas, F. Lobelo, M. K.

Ali, K. Norris, S. Gruss, B. Bardenheier, P.

Cho, I. Garcia de Quevedo, U. Mudaliar, C. D. Jones, J. M. Durthaler, J. Saaddine, L. S.C Geiss, E. W. Gregg, "Effect of lifestyle interventions on cardiovascular risk factors among adults without impaired glucose tolerance or diabetes: A systematic review and meta-analysis" PLoS One, Vol.12, No.5 pp. 1-27, (2017).

18. C. Sanz, J. F. Gautier, H. Hanaire,

"Physical exercise for the prevention and treatment of type 2 diabetes" Diabetes Metab, Vol.36, No.5 pp. 346-351, (2010).

19. P. Quílez Llopiz, M. Reig García-Galbis,

"Glycemic control through physical exercise in type 2 diabetes systematic review" Nutr Hosp, Vol.31, No.4 pp. 1465-72, (2015).

20. C. Nery, S. R. A. Moraes, K. A. Novaes, M. A. Bezerra, P. V. C. Silveira, A.

Lemos, "Effectiveness of resistance exercise compared to aerobic exercise without insulin therapy in patients with type 2 diabetes mellitus: a meta-analysis" Braz J Phys Ther, Vol.21, No.6 pp. 400-415, (2017).

21. Y. H. Ku, B. K. Koo, H. J. Ahn, J. Y.

Jeong, H. G. Seok, H. C. Kim, K. A.

Han, K. W. Min, "Effects of Aerobic Exercise Intensity on Insulin Resistance in Patients with Type 2 Diabetes Mellitus"

Korean Diabetes J, Vol.33, No.5 pp.

401-411, (2009).

22. D. A. Butterfield, F. Di Domenico, E.

Barone, "Elevated risk of type 2 diabetes for development of Alzheimer disease: a key role for oxidative stress in brain"

Biochim Biophys Acta, Vol.1842, No.9 pp.

1693-1706, (2014).

23. W. L. Knez, D. G. Jenkins, J. S. Coombes,

"The effect of an increased training volume on oxidative stress" Int J Sports Med, Vol.35, No.1 pp. 8-13, (2014).

24. P. Bharadwaj, N. Wijesekara, M.

Liyanapathirana, P. Newsholme, L. Ittner, P. Fraser, G. Verdile, "The Link between Type 2 Diabetes and Neurodegeneration:

Roles for Amyloid-β, Amylin, and Tau

(9)

Proteins" J Alzheimers Dis, Vol.59, No.2 pp. 421-432, (2017).

25. S. M. de la Monte, "Type 3 diabetes is sporadic Alzheimer׳s disease: mini-review"

Eur Neuropsychopharmacol, Vol.24, No.12 pp. 1954-1960, (2014).

26. M. Shinohara, N. Sato, "Bidirectional interactions between diabetes and Alzheimer's disease" Neurochem Int, Vol.108, pp. 296-302, (2017).

27. R. O. Roberts, D. S. Knopman, S. A.

Przybelski, M. M. Mielke, K. Kantarci, G.

M. Preboske, M. L. Senjem, V. S.

Pankratz, Y. E. Geda, B. F. Boeve, R. J.

Ivnik, W. A. Rocca, R. C. Petersen, C. R.

Jr. Jack, "Association of type 2 diabetes with brain atrophy and cognitive impairment" Neurology, Vol.82, No.13 pp.

1132-1141, (2014).

28. J. Wu, S. L. Zhou, L. H. Pi, X. J. Shi, L.

R. Ma, Z. Chen, M. L. Qu, X. Li, S. D.

Nie, D. F. Liao, J. J. Pei, S. Wang, "High glucose induces formation of tau hyperphosphorylation via Cav-1-mTOR pathway: A potential molecular mechanism for diabetes-induced cognitive dysfunction"

Oncotarget, Vol.8, No.25 pp.

40843-40856, (2017).

29. R. K. West, R. Ravona-Springer, J.

Schmeidler, D. Leroith, K. Koifman, E.

Guerrero-Berroa, R. Preiss, H. Hoffman, J. M. Silverman, A. Heymann, M.

Schnaider-Beeri, "The association of

duration of type 2 diabetes with cognitive

performance is modulated by long-term

glycemic control" Am J Geriatr Psychiatry,

Vol.22, No.10 pp. 1055-1059, (2014).

수치

Fig.  1.  The  glycemic  control  related  parameters  for  the  four  groups  after  intervention
Fig.  2.  The  CAT  and  neurodegeneration  related  parameters  for  the  four  groups  after  intervention

참조

관련 문서

In the present study, 0.12% myricetin was effective for decreasing insulin and HOMA-IR in mice fed the HFHS diet and reduced serum glucose levels near to those of the control

In contrast, the OB-SBE group showed a reversal in the metabolic defects, including a decrease in glucose, insulin, IAUC, HOMA-IR, TNF-α, IL-6 and leptin levels. These results